Impact of Russia-Ukraine war on Indian stock Market - An Event Study with Reference to NIFTY 50
Mr. Sanath Kumar K 1, Mr. Gururaj P 2![]()
![]() , Ms. Deepa C. Bhat 3
, Ms. Deepa C. Bhat 3
1, 2 Faculty, Department of Commerce Mangalore University, India
3 Final M. Com, Department of Commerce Mangalore University, India
|
|
|
ABSTRACT |
|
|
The
Russia-Ukraine conflict is a major blow to the global economy as financial
backlash unleashed not only in Russia and Ukraine but also in the rest of the
world. Both the countries, being prominent international players constitute a
major part in global trade especially in the export of wheat, crude oil, raw
material for industries and so on. The world market was hit massively on
account of invasion of Ukraine by Russia on 24 February 2022, from when the
stock markets tanked even in India. This paper is an attempt to understand
and analyses the effects of the Russia-Ukraine conflict on Indian stock
market by taking Nifty-50 index as the base. The Event Study methodology is
used in this study, considering the changes in Nifty-50 indices for an event
period of 16 days (8 days of estimation period+8 days of observation period)
from 8th February 2022 to 4th March 2022. The index values thus obtained and
analyzed elucidated that there has been a significant impact of
Russia-Ukraine war on Nifty-50 in particular and Indian stock market in
general. |
|||
|
Received 19 March 2022 Accepted 19 April 2022 Published 05 May 2022 Corresponding Author Gururaj P,
DOI 10.29121/granthaalayah.v10.i4.2022.4566 Funding: This research
received no specific grant from any funding agency in the public, commercial,
or not-for-profit sectors. Copyright: © 2022 The
Author(s). This work is licensed under a Creative Commons
Attribution 4.0 International License. With the
license CC-BY, authors retain the copyright, allowing anyone to download,
reuse, re-print, modify, distribute, and/or copy their contribution. The work
must be properly attributed to its author.
|
|||
|
Keywords: Stock Market, Average Abnormal Returns,
Russia-Ukraine, Nifty 50 Index, CAAR |
|||
1. INTRODUCTION
Ukraine, the largest country after Russia in Europe, which is situated in the Eastern Europe, remained as a part of USSR (Union of Soviet Socialist Republics) till it dis-integration in 1991 Russo-Ukrainian War (2022). The hostility on Ukraine’s border with Russia rose with the Russian invasion and annexation of Crimea in the year 2014. Taking into consideration, certain economic, geopolitical and some strategic factors like eastward expansion of NATO (North Atlantic Treaty Organization), in which USA, the arch-rival of Russia is a part Paul (N.d.), Russia is against the Ukraine’s interest to join NATO. This geopolitical issue triggered in February 2022 as Russia indulged in the deployment of military troops along with its borders with Ukraine. The implications of the crisis were felt around the globe to which India was not an exception.
The aggression of Russia on Ukraine put pressure on India to choose between the USA and Russia Ukraine is one of the prominent exchange partners of India The Times of India (2022), as India exports pharmaceutical products, oil seeds, electrical and electronic components to Ukraine. Furthermore, India is reliant on Russia for the proffer of oil, fertilizers, iron, and steel and so forth. The harsher sanctions against Russia by the various countries around the world in general and the USA in particular led to the soar in oil prices, as Russia is one among the countries exporting oil and petroleum products. This reflected in the inflation with Indian rupee reaching the historic low. Resultantly, the Russia-Ukraine crisis discombobulated the investment activities in the country with bearish trend in the stock market.
As empirically tested by Eugene Fama in his Efficient Market Hypothesis, market responds quickly and accurately to the information available, events both favourable and unfavourable, affects the market and the stock prices correspondingly. Equivalently, Indian stock indices and the stock prices saw substantial volatile movements with investors fearing and divesting funds in response to Russia-Ukraine crisis and global reactions to it.
2. LITERATURE REVIEW
Studies delineate how the world economy, and the stock markets are influenced by the international conflict. Numerous studies demonstrate the impact of macro-economic variables like inflation, FDIs, FIIs, oil prices, pandemics like Covid 19 on stock price movements. Singh (2018), Abhinandan (2019), Stephen et al. (1985), Abhinandan (2019).
Fama, in his book “The Capital Markets: A Review of Theory and Empirical Work” described about three forms of Efficient Markets namely, Strong form, semi-strong form and weak form. Literature reviews depicts that the event study is an ideal tool in testing the efficiency of market in general and semi-strong form of EMH in particular. It is the most widely used paradigm to understand the behaviour of stock markets.
2.1. OBJECTIVE OF THE STUDY
This study, by taking NSE Nifty 50 index as a reference tries to understand and evaluate the impact of Russia-Ukraine war on the Indian Stock Market to demonstrate the comprehensive movement of the stock prices.
3. RESEARCH METHODOLOGY
For elucidating the impact of Russia-Ukraine Conflict on Indian stock market returns, the event study methodology is used. This study analyses the change in the index prices which in turn will reflect how the event affected the market returns beyond expectation. The event study is conducted by taking the estimation period of 8 days from 8th February 2022 to 17th February 2022.The observation period is also of 8 days from 22nd February 2022, two days prior to the event date (24-02-2022) to 4th March 2022.Nifty 50 Index data used is collected from the official website of National Stock Exchange of India.
Estimation period is a period preceding the event date, in which we believe nothing of significance has occurred in the market and the performance is normal as a result of which we take that period as a base for comparison. Observation period is the period in which we suspect the influence of the event. Event day or day 0 is the day in which a particular event took place, here the date on which Russia invaded Ukraine.
3.2. EVENT STUDY TIMELINE
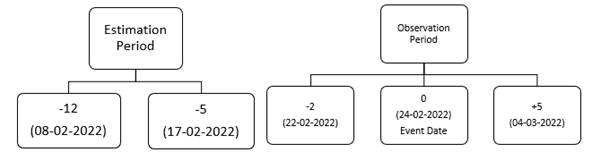
According to EMH, it is not possible for any participant in the market, to outperform the market by earning abnormal returns as the stock prices quickly adjust to all the publicly available information. To empirically test the market efficiency, especially the semi-strong form of market efficiency during the event of Russia-Ukraine war, event study methodology is adopted by taking an event window of 16 days.
The values in the Table 1 is calculated as follows:
1. Daily
Returns
Rt= (Pt-Pt-1)/Pt-1
Where, Pt = Closing Nifty value of the current day
Pt-1= Closing Nifty value of the previous day
2. Average
Abnormal Returns
AAR= Actual Return-Expected Returns
*Expected Returns is the average or mean returns in the observation period’
3. Cumulative
Average Abnormal Returns
CAAR is the summation of all the AARs calculated to know the total abnormal returns made before and after the event. CAAR by giving a clear picture of the cumulative abnormal returns in case the influence is not completely reflected on the date of the event, acts as an effective tool of analysis in addition to the AAR.
4. t-value
Statistical significance of the test is empirically by applying t-test and the by calculating t-values.
t value (AAR) = AAR/Standard Deviation of AAR
t value (CAAR) = CAAR/Standard Deviation of CAAR
For the statistical test conducted the hypotheses are stated as specified below:
H0: There is no significance difference between the Average Abnormal Returns before and after the announcement Russia-Ukraine war in Nifty 50 Index.
H1: There is significance difference between the Average Abnormal Returns before and after the announcement Russia-Ukraine war in Nifty 50 Index.
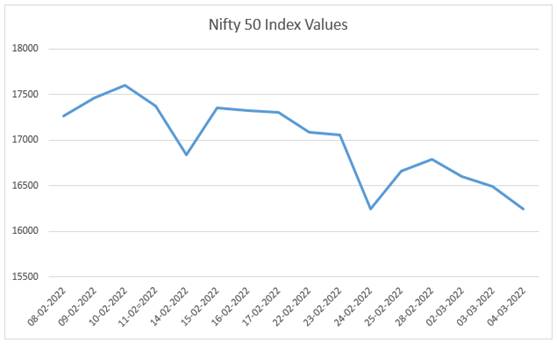
Graphical presentation of Nifty 50 performance before and after the event
Figure 1
|
|
|
Figure 1 Daily
closing values of Nifty 50 Index of National Stock Exchange of India during
the event window Source: National Stock Exchange of India |
Data Analysis and Interpretation
Table 1
|
Table 1 Average Abnormal Returns (AAR) and Cumulative Average Abnormal Returns (CAAR) of Nifty 50 Index during estimation period and observation period |
||||||
|
Day |
Nifty
values |
Daily
Returns |
Avg.
Abnormal Returns |
Cumulative
AAR |
t-value
of AAR |
t-value
of CAAR |
|
-12 |
17266.75 |
0.308767486 |
0.229268691 |
0.22926869 |
0.11952 |
0.08902 |
|
-11 |
17463.8 |
1.141210708 |
1.061711913 |
1.2909806 |
0.553481 |
0.50125 |
|
-10 |
17605.85 |
0.813396855 |
0.73389806 |
2.02487866 |
0.382588 |
0.78619 |
|
-9 |
17374.75 |
-1.312631881 |
-1.392130676 |
0.63274799 |
-0.72573 |
0.24568 |
|
-8 |
16842.8 |
-3.061626786 |
-3.141125581 |
-2.5083776 |
-1.6375 |
-0.9739 |
|
-7 |
17352.45 |
3.025922056 |
2.946423261 |
0.43804567 |
1.535999 |
0.17008 |
|
-6 |
17322.2 |
-0.174326968 |
-0.253825763 |
0.1842199 |
-0.13232 |
0.07153 |
|
-5 |
17304.06 |
-0.104721109 |
-0.184219904 |
0.000001 |
-0.09604 |
0.00001 |
|
-2 |
17092.2 |
-0.665149811 |
-0.744648606 |
-0.74465 |
-0.38819 |
-0.2891 |
|
-1 |
17063.25 |
-0.169375505 |
-0.2488743 |
-0.99352 |
-0.12974 |
-0.3858 |
|
0 |
16247.95 |
-4.778104992 |
-4.857603787 |
-5.85113 |
-2.53232 |
-2.2718 |
|
1 |
16658.4 |
2.526164839 |
2.446666044 |
-3.40446 |
1.275471 |
-1.3218 |
|
2 |
16793.9 |
0.813403448 |
0.733904653 |
-2.67056 |
0.382592 |
-1.0369 |
|
3 |
16605.95 |
-1.11915636 |
-1.198655155 |
-3.86921 |
-0.62487 |
-1.5023 |
|
4 |
16498.05 |
-0.649767102 |
-0.729265897 |
-4.59848 |
-0.38017 |
-1.7854 |
|
5 |
16245.35 |
-1.53169617 |
-1.611194965 |
-6.20967 |
-0.83993 |
-2.411 |
Data is collected about the daily Nifty 50 Index values from official website of the NSE, India for both observation period and estimation period Table 1 shows the daily returns, Average Abnormal Returns (AAR), Cumulative Average Abnormal Returns (CAAR) and the t-values calculated on AAR and CAAR. Historical Index Data (2022)
The abnormal returns are computed on the grounds that there should not be any changes in abnormal returns if there is no impact of the event. Nonetheless, in few of the cases impact may reflect not on the event date, but after a few days. In cases as such, Cumulative Average Abnormal Returns can be calculated as it becomes a better indicator delineating the cumulative impact of the event on index values.
The null hypothesis is that there is no significance difference between the Average Abnormal Returns before and after the announcement Russia-Ukraine war in Nifty 50 Index. It is statistically tested using paired t-test by which the t-statistics obtained is 0.656 implying that the null hypothesis stated above is rejected at 5% level of significance which paves a way for us to conclude that there is significance difference between the Average Abnormal Returns before and after the announcement Russia-Ukraine war in Nifty 50 Index. This means that the said conflict did affect the Indian stock market resulting in significant variations in the abnormal returns.
The following tables show the various statistical values calculated.
Paired Samples Statistics
|
Mean |
N |
Std.
Deviation |
Std.
Error Mean |
||
|
Pair
1 |
Estimation
period |
0 |
8 |
1.78497 |
0.63108 |
|
Observation
period |
-0.7762 |
8 |
2.08676 |
0.73778 |
Paired Samples Correlations
|
N |
Correlation |
Sig. |
|
|
Pair
1 Estimation
period & Observation period |
8 |
-.489 |
.218 |
Paired Samples Test
|
Paired
Differences |
|||||||||
|
95%
Confidence Interval of the Difference |
Sig.
(2-tailed) |
||||||||
|
|
Mean |
Std.
Deviation |
Std.
Error Mean |
Lower |
Upper |
t |
df |
||
|
Pair
1 |
Estimation
period - Observation period |
0.77621 |
3.34466 |
1.18252 |
-2.02 |
3.57241 |
0.656 |
7 |
0.533 |
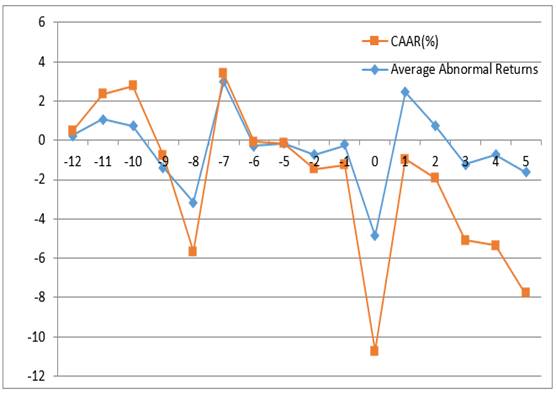
Figure 2
|
|
|
Figure 2 Average Abnormal Returns and
CAAR of Nifty 50 Index of NSE during the event window Source: As calculated |
Figure 2 represents the graphical up-down movements of Average abnormal returns and the CAAR in the event window, depicting the statistical test results of CAAR for Nifty 50 returns of Indian stock exchange due to Russia-Ukraine war. The null hypothesis in this case is that CAAR is equal to zero, implying that there are no abnormal returns during the4 period under study. The said null hypothesis is rejected at 5% level of significance, indicating that CAAR is not equal to zero (but negative), which also portrays that the event of Russia-Ukraine crisis did impact the nifty 50 index in a retreating manner, and it is statistically evident.
4. CONCLUSION
The full-blown Russia-Ukraine war and the severe sanctions on Russia after its invasion of Ukraine plunged the Stock markets around the globe in conjunction with India with Nifty 50 declining sharply Bhakti (2022). It is empirically elucidated in this study as the null hypothesis was rejected at 0.1 level of significance. The soar in the oil price movements the along with the rise in prices of other commodities, worsened the situation creating a panic among the investors Lokeshwarri (2022). The fear of world war, the price of crude oil and the threat of resulting inflation impacted the economy and the market performance. As stated in the EMH the markets do reflect the available information and change accordingly. In the study, rejection of null hypothesis and the acceptance of the alternative hypothesis implies that the Russia-Ukraine war pushed the Indian market down. Thus, it is an illustration of how a market responds to the global events as we statistically understand the negative response of Nifty 50 index values.
REFERENCES
Abhinandan, K, Sanath, K. K., Yathish, K. (2020). Impact of Coronavirus on Indian Stock Market - An Event Study with Reference to Nifty 50.
Abhinandan. (2019). Impact Of Coronavirus On Indian Stock Market-An Event Study With Reference To Nifty 50.
Bhakti, M. (2022). Indian markets are the second worst performers this week in Asia hit by the Russia-Ukraine war. 5.
Historical Index Data. (2022).
Lokeshwarri SK. (2022). The Russia-Ukraine conflict escalates; what next for the stock market? 6.
Paul, K. (N.d.). Why has Russia invaded Ukraine and what does Putin want ?
Singh, S. K. (2018). Stock Market Volatility A Case Study Of Bse And Nse.
Stephen J.BrownJerold B.Warner. (1985). Using daily stock returns: The case of event studies, Journal of Financial Economics, 14(1), 3-31.
The Times of India (2022). Explainer : How much oil, gas and coal India imports from Russia.
 This work is licensed under a: Creative Commons Attribution 4.0 International License
© Granthaalayah 2014-2022. All Rights Reserved.