CHEMICAL ANALYSIS OF MACROPHYTE (CYPERUSALTERNIFOLIUS) GROWING IN SURFACE FLOW CONSTRUCTED WETLAND (SFCW) FOR WASTEWATER TREATMENTLuna Al-Hadidi 1, Amer Sweity 2 1,2 National Agricultural Research Center, P.O. Box 639, Baqa'a 19381, Jordan |
|
||
|
|
|||
|
Received 07 January 2022 Accepted 18 February 2022 Published 03 March 2022 Corresponding Author Amer Sweity, amersweity@narc.gov.jo DOI 10.29121/granthaalayah.v10.i2.2022.4506 Funding: This research
received no specific grant from any funding agency in the public, commercial,
or not-for-profit sectors. Copyright: © 2022 The
Author(s). This is an open access article distributed under the terms of the
Creative Commons Attribution License, which permits unrestricted use, distribution,
and reproduction in any medium, provided the original author and source are
credited.
|
ABSTRACT |
|
|
|
We examined the chemical contents of Cyperusalternifolius growing in surface flow
constructed wetlands (SFCW) used in the treatment of partially treated
wastewater. The (SFCW) wetland is composed of three cells in series of which
two are open water surfaces and one is a channel bed planted with Cyperusalternifolius was designed and
constructed. Four different mixtures
of treated wastewater TWW effluent and the primary TWW effluent were used
under different hydraulic retention times (HRT) of 3, 6, 9, and 12 days
within the (SFCW) wetland. Higher accumulation of nitrogen N was detected in
the plant’s parts in an order magnitude of leaves>stem>rhizome>root.
Pronounced increase in potassium K concentration at the rhizome and stem was
detected, while high amount of manganese Mn was accumulated in leaves. Roots
and rhizomes were the main sinks for zinc Zn and phosphorus P. |
|
||
|
Keywords: Constructed Wetlands, Cyperusalternifolius,
Water Treatment, Macrophytes 1. INTRODUCTION
Constructed free water surface (SFCW) wetlands are low-cost artificial
wastewater treatment technology composed of one or more treatment cells in a
building design Davis (1995). It is also known as surface flow wetlands closely
mimicking natural wetlands in appearance as they comprise aquatic plants that
are rooted in a soil layer on the bottom of the wetland and water flows
through the leaves and stems of plants Vymazal (2001). Constructed wetlands can be used as the main unit
process in a system to treat municipal wastewater Sundaravadivel et al. (2001). While some degree of pre-or post-treatment will be
required in conjunction with the wetland to treat wastewater to meet reuse
requirements, the wetland will be the central treatment component.
Constructed wetlands technology can be used in combination with other
secondary treatment technologies Vymazal et al. (2006). A constructed wetland could be placed upstream in
the treatment train to optimize the cost of secondary treatment. In other
uses, constructed wetlands could discharge secondary effluent to other
enhancement wetlands for polishing Davis (1995). The
constructed wetlands can provide secondary treatment for higher-strength
municipal wastewater and treat it to secondary effluent standards and better.
Wetland plants create a good environment that supports a wide range of
physical, chemical, and microbial processes. These processes separately and
in combination remove total suspended solids (TSS), reduce the. influent
biochemical oxygen demand (BOD), transform nitrogen species, provide storage
for metals, cycle phosphorus, and |
|
||
attenuate organisms of public
health significance Hammer
(2020). Due to
sufficient water, wetlands are considered home to a variety of microbial and
plant species Kadlec
and Wallace (2008). The presence
of macrophytes in the wetlands is one of the most obvious features and their
presence allows differentiating wetlands from other unplanted soil filters or
lagoons Vymazal and Kröpfelová (2008). Wetlands are
home to a diverse group of plants, including emergent, floating, and submerged
species. In general, only emergent macrophytes are specified for wastewater
treatment wetlands as their occurrence and distribution are easily managed Brix (2003). Wetland
vegetation assimilates minerals and nutrients into plant biomass and oxygenates
the substrate in the vicinity of the plant rootTanner (1996). Macrophytes
have a great tendency to remove pollutants by assimilating them into their
tissue and providing surfaces and a suitable environment for microorganisms to
transform the nutrients and decrease their concentrations Healy et
al. (2007). Persistent
emergent plants are among the most often used plants in constructed wetlands. One of the most common plants used in constructed wetlands
is Cyperusalternifolius, it is a multiyear old
plant that can tolerate extreme wastewater and can grow in humid soil Kyambadde et al. (2004). It is well known that not all
emergent wetland species are proper for wastewater treatment since plants for
treatment wetlands must have the ability to tolerate and withstand high
salinity, flooding, and exposure to high pollutants water Stottmeister et al. (2003), Tanner (1996). Most wetland
plants are adapted to survive in very saturated conditions. While most plants
absorb oxygen through their roots, wetland plants can also absorb oxygen
through their stems and leaves and transport it to their roots through
specialized root cells Tanner
(1996). Vegetation
plays a significant role in constructed wetlands, especially on nitrogen and
phosphorus removal. In this research chemical analysis of SFCW Wetland
macrophyte (Cyperus alternifolius) was
examined.
2. MATERIALS AND METHODS
2.1. STUDY AREA
Field experiments were conducted at the National
Agricultural Research (NARC) research station at Ramtha in the northern part of
Jordan. The experimental site is located near the Ramtha wastewater treatment
plant, where irrigation with treated wastewater is highly practiced. The
climatic conditions of the study area are characterized by cold winter with an
average temperature of 9 C° and hot summer with an average temperature of 24.5
C° and an average annual rainfall of 275 mm.
2.2. SITE CONSTRUCTION AND PREPARATION OF SFCW
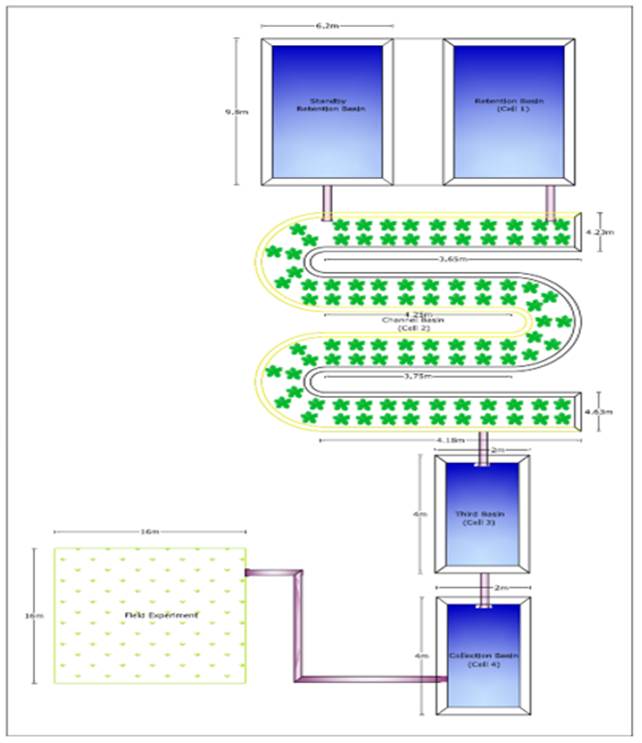
The area allocated for the construction of the wetlands was approximately 25 m in width by 125 m in length. The site was shaped and graded using natural gravity. A survey was carried out using the “level instrument” to check for the natural slope of the site and determine the cut and fill areas. The surface wetland was designed using the multi-cell, multistage approach with different water levels at each cell as the water flows across the wetland (Figure 1). The advantage of the design is that it provides good flow distribution, thus maximizing shallow areas required for the successful growth of the macrophyte used and facilitating a more cost-effective maintenance program. In constructing the free surface wetland, the flow path was divided into a series of zones perpendicular to the flow path similar to those observed in natural wetlands. In general, the longer the flow path the closer flow patterns approximate plug flow Kyambadde et al. (2004). FWS cells length to width ratios is recommended to be in the range of 2:1 to 5:1 Crites (1994). Flow into and through the system is controlled by gravity. The free water surface wetland cells were configured in series to minimize short-circuiting and subsequently, leading to better overall treatment in the system. The first cell was an open water zone consisting of two cells configured in a parallel sequence to maintain flexibility and redundancy in operation. It is of a rectangular shape and is used as a retention basin with an aspect ratio of 2:1 length to width (L: W) and a total depth of 120 cm. The depth of the soil media is 30 cm and 20 cm are left as a freeboard. The second cell is a channel basin having a depth range from 0.5 to 0.7 m. The depth of the soil ranges between 20-25 cm over the liner to support the vegetation and 10 cm is left as a freeboard. The third cell is 2´4m2 (W: L) of a rectangular shape basin having a depth of 0.5 m, the soil media depth is 20 cm and also a 10 cm is left as a freeboard. Large stones were added near the inlet and the outlet of the basins to spread the wastewater across the width of the wetland. Also, a layer of zeolite gravel media was added to the third cell to provide extra surface area and therefore, increase the effectiveness of the treatments. The fourth cell which is the collection basin was a 2´4m2 (W: L) of rectangular shape basin. After finishing construction works, the whole wetland was flooded for 2 months to settle the soil and level the bed. The channel bed cell was then dewatered in (but not completely dried) shortly before planting to produce soft, moist soil. The layout of the free water surface wetland was comprised of a deep, open water basin (cell 1) followed by a shallow vegetated channel bed (cell 2) and another shallow, open water basin (cell 3), and a collection basin (cell 4). The first three cells were constructed for the treatment of wastewater and the fourth one was for the collection of the treated effluent (Figure 1). The soil was compacted within all the treatment cells that were also lined to prevent seepage to the groundwater and to maintain the water level in the cells using 600-micron polyethylene layers. Planting was carried out by hand. Planting layout patterns for emergent species include band planting (across the wetland) and parallel to the wetland edge Davis (1995). Cyperus alternifolius was planted inside the channel bed cell. Cyperus alternifolius is known as dwarf palm or umbrella plant or umbrella sedge, which can reach as high as 1-2 m. It is cold-tolerant and can be grown in relatively dry climates. Stems and leaves are likely to withstand (-3°C to -5°C) frosts while roots may survive down to (-6°C to -8°C). The plants were brought from one of the neighboring nurseries. For a tall plant such as Cyperus alternifolius, the stem was cut back to approximately 30 cm to prevent wind-throw. The potted plants were placed in the soil in two rows across the wetland with a distance ranging from 0.75 to 1 m between the plants and the rows. The total number of plants used in this experiment was 108 plants. When plants were placed in the wetland, enough treated wastewater was added to maintain good saturation of the substrate, but not to flood it. After new growth reached 10 - 12 cm in, the treated wastewater level was raised to the recommended operational level.
|
|
|
Figure 1 Free Water Surface Constructed Wetland Layout |
The volume of the CFWS wetland was estimated at about 80 m3.
To simulate different qualities of treated wastewater and study the removal
efficiency of different pollutants by the free water surface constructed
wetland, the primary treated wastewater effluent was taken from Ramtha treated
wastewater plant and mixed with the treated wastewater effluent with different
mixtures. Access to treat and primary treated wastewater was established
through a pipe network from Ramtha treated wastewater plant to the free water
surface wetland. To study the removal efficiency of the free water surface
wetland, mixtures were used as experimental factors. The mixture was tested
under various hydraulic retention times of 3, 6, 9, and 12 days (Table 1). The
experiment was begun with the best quality effluent of 100% TWW, and then the
other effluents with different mixtures were used.
|
Table 1 Types of Wastewater Quality Mixture Tested in the FWS Wetland |
|||
|
Treatment (Mixture) |
Fully treated wastewater |
Primary treated wastewater |
Legend of mixture used in the text |
|
1 |
100 |
0 |
T100 |
|
2 |
75 |
25 |
T75, P25 |
|
3 |
50 |
50 |
T50, P50 |
|
4 |
25 |
75 |
T25, P75 |
2.3. CHEMICAL ANALYSIS OF WATER
Inlet and outlet effluent samples were taken for both
wetlands according to the sampling schedule and then samples were transferred
to the laboratory for analysis. Salinity (ds/m) and turbidity (NTU: nephelometric
turbidity unit) were measured directly at the field using portable instruments.
pH and EC were measured at the lab using a pH meter and conductivity meter
in addition to measuring cations and anions. Total suspended solids (TSS)
as mg/l were determined by filtering the sample and weighing the dry material.
Available phosphorus (P) was determined using ammonium molybdate, stannous
chloride method, and reading with a spectrophotometer at 720 nm. Total Kjeldahl nitrogen (TKN) was determined by digestion and
using the Kjeldahl distillation apparatus. Nitrate
(NO3) was measured after adding an acid to the sample and then
reading it with a spectrophotometer at 206 nm wavelength. Heavy metals were
determined by inductively coupled plasma-atomic emission spectroscopy. Samples
were preserved (if needed) for further analysis using the appropriate
preservation method specified for each parameter according to the standard
methods for the examination of water and APHA (1998).
2.4. CHEMICAL ANALYSIS OF HARVESTED PLANT
At the end of each influent mixture treatment shown in Table 1, a plant
sample (Cyperus alternifolius) was taken from
the channel bed basin for chemical analysis. Two plant samples were selected at
each sampling time and separated into rhizomes, roots, stems, and leaves for
further chemical analysis. Cyperus alternifolius
wetland plant was harvested and biomass weight was measured and recorded. All
statistical tests were performed using the SAS software. In all cases,
significance was defined by P<0.05. Test for a significant difference in
water quality between hydraulic retention times and influent mixtures of the
treatment wetland was tested using the mixed procedure analysis of variance
(ANOVA) at which time and mixture were factorially arranged. After sampling,
plant samples were taken to the laboratory for further cleaning and preparation
for future analysis. Samples were then oven-dried and grounded up using Thomas
– Wiley mill. Dry ashing was carried out for the
determination of potassium (K), calcium (Ca), and heavy metals, while wet ashing was carried out for the determination of sodium
(Na). Total Kjeldahl nitrogen (TKN) was determined by
digestion and using the Kjeldahl distillation
apparatus. All the above parameters were determined using the “Official Methods
of Analysis of AOAC International” 18th ed, (2010) Horwitz
(2010). Total
phosphorus (TP) was determined according to methods of analysis for soil plants
and waters Chapman and
Pratt (1962).
3. RESULTS AND DISCUSSION
3.1. WASTEWATER CHARACTERIZATION
Results of biological and chemical analysis for both the
treated wastewater effluent (TWW) and the primary treated effluent (PE) are
listed in Table 2 and Table 3. Both
effluents exhibited pH and EC (ds/m) values of (7.3 and 1.85) for TWW and (6.5
and 1.89) for PE. Both effluents showed a high concentration of Na and Cl.
Phosphorus (PO4), nitrate, and total Kjeldahl
nitrogen (TKN) concentration (mg/l) were (2.6, 9.4, 74) and (11.3, 55, 185) for
TWW and PE, respectively. Results of the biological analysis indicated
excellent biological standards for TWW in terms of faecal coliform, BOD5,
and COD. The primary treated wastewater exhibited poor biological
standards in terms of the faecal coliform and had a high
organic loading related to BOD5 and COD. The quality of wastewater and/or HRT time in FWS
constructed wetland significantly affected the pH, EC, TSS, E. coli, P, and
turbidity to greater levels and insignificantly affected the concentrations of
BOD5, COD, TKN, and NO3(data are not presented).
|
Table 2 Chemical Analysis of fully and primary Treated Wastewater Effluents |
||||
|
Parameters |
||||
|
Treatment |
TC/100ml |
(FC)
E. coli/100ml |
BOD5
(mg/l) |
COD
(mg/l) |
|
TWW |
800 |
40 |
15 |
73 |
|
Primary
treated |
≥
1600 |
160×105 |
570 |
831 |
|
Table 3 Biological Analysis of Fully and Primary Treated Wastewater Effluents |
|||||||||
|
(dS/m) |
meq/l |
||||||||
|
Effluent |
pH |
EC |
Ca |
Mg |
Na |
K |
Cl |
HCO3 |
SO4 |
|
TWW |
7.3 |
1.8 |
2.2 |
2.7 |
14.9 |
1.2 |
12.5 |
3.5 |
5 |
|
Primary treated |
6.5 |
1.9 |
2.7 |
4.9 |
12.2 |
0.9 |
10 |
6.3 |
4.5 |
|
mg/l |
|||||||||
|
SAR |
Fe |
Cu |
Zn |
Mn |
Cd |
Pb |
P |
TKN |
|
|
TWW |
9.5 |
0.07 |
0.01 |
0.06 |
0.03 |
<0.002 |
<0.01 |
2.6 |
74 |
|
Primary treated |
6.3 |
0.34 |
0.01 |
0.07 |
0.03 |
<0.002 |
<0.01 |
11.3 |
185 |
3.2. CHEMICAL ANALYSIS OF MACROPHYTE
Emergent macrophytes
assimilate nutrients from sediments and also act as
nutrient pumps and play a key role in seasonal changes in available N, P, and K
Vymazal and Kröpfelová (2008), Vymazal and Kröpfelová (2009). Nitrogen is
taken up and assimilated by growing plants throughout the growing season.
However, the uptake rate varies widely during the growing season. The uptake
rates are much higher during the exponential growth phase as compared to the
steady-state growth phase. Plants contain 1 to 6% N by weight and absorb N as
both nitrate and ammonium Hernandez
and Mitsch (2007). Ammonium is
toxic to plant cells and therefore must be assimilated rapidly to amino acids Vymazal and Kröpfelová (2008). Results
indicated that the different plant parts show changes in nitrogen content
during their various stages of growth. Results of nitrogen % in the plant were
0.62 to 3.25. This is very close to other results obtained with respect to
nitrogen % in emergent plants which were 0.93 to 2.56 Kadlec
and Wallace (2008). Roots
comprise only a minor pool of nitrogen compared to rhizomes and leaves.
Nitrogen concentration in both roots and leaves was 0.62% and 2.05%,
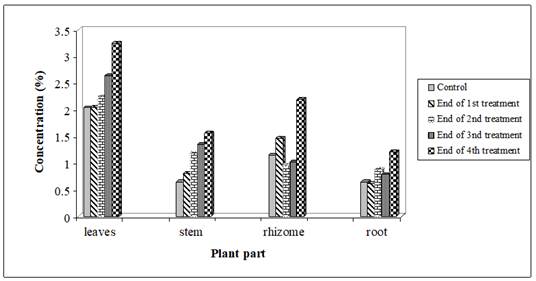
respectively (Figure 2). The relative
importance of plant uptake depends upon the nitrogen loading to the treatment
wetland Khanijo (2002). Results
indicated that all plant parts were capable of absorbing and accumulating
nitrogen with the magnitude of leaves>stem>rhizome>root. The
accumulation of nitrogen increased even when the quality of the wetland
effluent deteriorates, with leaves accumulating the highest N concentration
(3.25%).
|
|
|
Figure 2 (A)Nitrogen Concentration (%)
in Different Macrophyte Parts under the Different Influent mixtures, (B) |
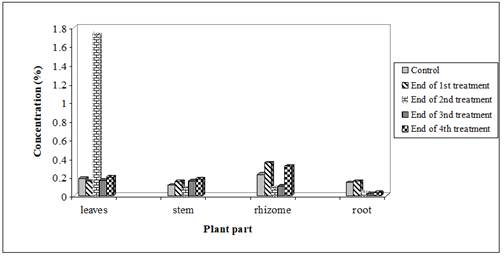
Phosphorus in wetlands occurs as phosphate in organic and inorganic compounds. Free orthophosphate is the only form of phosphorus believed to be utilized directly by algae and macrophytes and thus represents a major link between organic and inorganic phosphorus cycling in wetlands. Phosphorus is incorporated in the tissues of all living organisms and is frequently a limiting factor for vegetative productivity Kadlec and Wallace (2008). Total phosphorus concentration ranged between 0.024 for roots to 0.355% for rhizomes (Figure 3). Results indicated a pronounced increase in phosphorus concentration as the nutrient status of the wetland was increased, with the rhizome accumulating the highest P concentration (0.32%). This is very close to results observed for the concentration of phosphorus in the plant tissue in constructed wetlands which was in the range of 0.08 to 0.63% dry matter with an average of 0.25% DM. Phosphorus storage in the aboveground biomass of emergent macrophytes is usually short-term, with a large amount of P being released during the decomposition of litter. The aboveground portions of macrophyte return P to the water, while belowground portions return P to the soil. Some radio studies outlined that phosphorus uptake by microbiota occurs on a time scale of less than 1 hour. However, more than 90% was released within the next 6 hours Vymazal and Kröpfelová (2008), Zhu et al. (2003).
|
|
|
Figure 3 Total Phosphorus Concentration (%) in Different
Macrophyte Parts under the Different Influent mixtures |
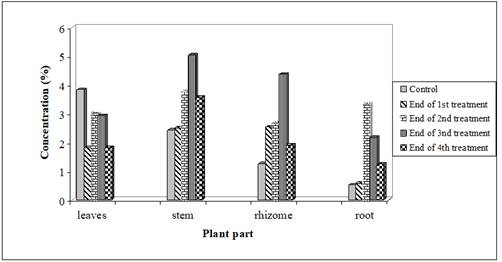
Potassium has
an elevated concentration in wastewater, but wetland systems are commonly used
for its control Batool and Saleh (2020), Kadlec
and Wallace (2008). It is highly mobile because it is more
exchangeable from wetland soils than nitrogen and phosphorus. Potassium is
essential for carbohydrate synthesis and the transfer of sugars. It regulates
the water status of plants and activates several enzyme systems. Potassium
typically comprises about 2.6% of the dry weight of wetland plants. Results
indicated a pronounced increase in potassium concentration as the nutrient
status of the wetland was increased, with the rhizome and stem accumulating the
highest amount of 4.37 and 5.03% (Figure 4).
|
|
|
Figure 4 Potassium Concentration (%) in
Different Macrophyte Parts under the Different Influent mixtures |
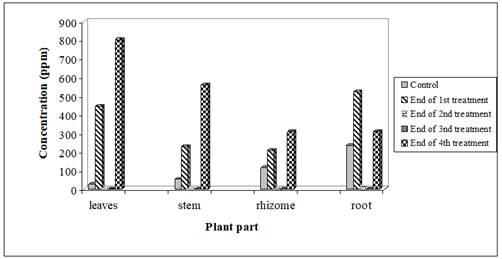
Metals in the soluble and exchangeable form are considered readily mobilized and available to plants. Macrophytes have been shown to play important roles in wetland biogeochemistry through their active and passive circulation of elements Khanijo (2002), Weis and Weis (2004). Manganese is considered one of the essential metals for the growth of plants. Manganese is vital to plant photosynthesis and is used as an enzyme cofactor for respiration and nitrogen metabolism by plants. Manganese occurs in a number of valency states, the existence of a particular valency state depending, to a large extent, on the pH and redox potential of the system in the normal pH range (pH 6-9) of natural waters, soluble divalent Mn consists of Mn+2 and MnOH-. Results indicated a sudden reduction in manganese concentration under the second and third mixture without known reasons. Results from the research indicated that some of the Mn is accumulated in the roots 308.72 ppm but also a high amount was translocated to the leaves as 802.66 ppm to be used by the plant (Figure 5).
|
|
|
Figure 5 Manganese Concentration (ppm)
in Different Macrophyte Parts under the Different Influent mixtures |
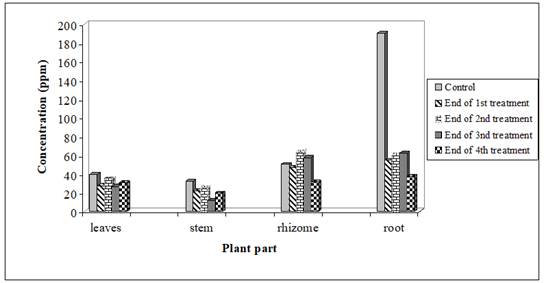
Results from our experiment showed that roots (62.3%) and rhizomes (63.5%) are the main sinks for zinc followed by leaves (35.4%) and stems (25.6%) (Figure 6). Zinc is considered one of the essential metals for the growth of plants and is considered to be toxic at relatively low concentrations. As with most trace elements, the concentration of Zn+2 in plants at which toxicity appears is not well known Drakatos et al. (2000), Weis and Weis (2004). Results indicated that the plant was able to accumulate zinc within the root and the rhizome. Weis and Weis (2004) concluded that there have been conflicting reports as to whether the presence of iron plaque reduces or increases the uptake of metals like zinc by the plants. Because of the high binding capacity for metallic micronutrients by soil particles, plants have evolved several strategies for increasing their soil bioavailability. These strategies include the production of metal-chelating compounds which are synthesized in response to iron and possibly zinc deficiencies.
|
|
|
Figure 6 Zinc Concentration (ppm) in Different Macrophyte Parts
under the Different Influent mixtures |
4. CONCLUSION
Vegetation
plays a significant role in constructed wetlands, especially on nitrogen and
phosphorus removal. Higher accumulation of
nitrogen N was detected in the plant’s parts in an order magnitude of
leaves>stem>rhizome>root. Pronounced increase in potassium K concentration at the rhizome and stem
was detected, while high amount of manganese Mn was accumulated in leaves. Roots
and rhizomes were the main sinks for zinc Zn and phosphorus P.
ACKNOWLEDGMENTS
The authors are very thankful to Middle East Regional Cooperation program US-AID MERC for the financial support and to all the associated personnel in any reference that contributed /to this research
REFERENCES
APHA, A. P. H. A. (1998). Standard methods for the examination of water and wastewater (Vol. 2). American Public Health Association.
Batool, A., & Saleh, T. A. (2020). Removal of toxic metals from wastewater in constructed wetlands as à green technology ; catalyst role of substrates and chelators. Ecotoxicology environmental safety, 189, 109924. Retrieved from https://doi.org/10.1016/j.ecoenv.2019.109924
Brix, H. (2003). Plants used in constructed wetlands and their functions. 1st International Seminar on the use of Aquatic Macrophytes for Wastewater Treatment in Constructed Wetlands, edit. Dias V., Vymazal J. Lisboa, Portugal, Retrieved from https://www.researchgate.net/profile/Hans-Brix/publication/230563384_Plants_used_in_constructed_wetlands_and_their_functions/links/00b4952c01bcfede04000000/Plants-used-in-constructed-wetlands-and-their-functions.pdf
Chapman, H. D., & Pratt, P. F. J. S. S. (1962). Methods of analysis for soils, plants and waters. 93(1), 68. Retrieved from https://doi.org/10.1097/00010694-196201000-00015
Crites, R. W. (1994). Design Criteria and Practice for Constructed Wetlands. Water Science and Technology, 29(4), 1-6. https://doi.org/10.2166/wst.1994.0144 Water Science and Technology Retrieved from https://doi.org/10.2166/wst.1994.0144
Davis, L. (1995). A handbook of constructed wetlands : à guide to creating wetlands for : agricultural wastewater, domestic wastewater, coal mine drainage, stormwater in the Mid-Atlantic Region.
Drakatos, P., Kalavrouziotis, J., & Drakatos, S. (2000). Synergism of Cu and Zn in plants irrigated with processed wastewater. Land Contamination Reclamation, 8(3), 201-207. Retrieved from https://www.cabdirect.org/cabdirect/abstract/20001916091
Hammer, D. A. (2020). Constructed wetlands for wastewater treatment : municipal, industrial and agricultural. CRC Press. Retrieved from https://doi.org/10.1201/9781003069850
Healy, M. G., Newell, J., & Rodgers, M. (2007). HARVESTING EFFECTS ON BIOMASS AND NUTRIENT RETENTION IN PHRAGMITES AUSTRALIS IN A FREE-WATER SURFACE CONSTRUCTED WETLAND IN WESTERN IRELAND. Biology and Environment: Proceedings of the Royal Irish Academy, 107B(3), 139-145. Retrieved from https://doi.org/10.1353/bae.2007.0009
Hernandez, M. E., & Mitsch, W. (2007). Denitrification in created riverine wetlands : Influence of hydrology and season. Ecological Engineering, 30(1), 78-88. Retrieved from https://doi.org/10.1016/j.ecoleng.2007.01.015
Horwitz, W. (2010). Official methods of analysis of AOAC International. Volume I, agricultural chemicals, contaminants, drugs/edited by William Horwitz. Gaithersburg (Maryland) : AOAC International, 1997.
Kadlec, R. H., & Wallace, S. (2008). Treatment wetlands. CRC press. Retrieved from https://doi.org/10.1201/9781420012514
Khanijo, I. (2002). Nutrient removal from waste water by wetland system. Wetlands, 10, 1-12. Retrieved from https://www.engineering.iastate.edu/~tge/ce421-521/ishadeep.pdf
Kyambadde, J., Kansiime, F., Gumaelius, L., & Dalhammar, G. (2004). A comparative study of Cyperus papyrus and Miscanthidium violaceum-based constructed wetlands for wastewater treatment in a tropical climate. Water Research, 38(2), 475-485. Retrieved from https://doi.org/10.1016/j.watres.2003.10.008
Stottmeister, U., Wießner, A., Kuschk, P., Kappelmeyer, U., Kästner, M., Bederski, O., . . . Moormann, H. (2003). Effects of plants and microorganisms in constructed wetlands for wastewater treatment. Biotechnology Advances, 22(1), 93-117. Retrieved from https://doi.org/10.1016/j.biotechadv.2003.08.010
Sundaravadivel, M., Vigneswaran, S., & technology. (2001). Constructed wetlands for wastewater treatment. Critical reviews in environmental science technology 31(4), 351-409. Retrieved from https://doi.org/10.1080/20016491089253
Tanner, C. C. (1996). Plants for constructed wetland treatment systems - A comparison of the growth and nutrient uptake of eight emergent species. Ecological Engineering, 7(1), 59-83. Retrieved from https://doi.org/10.1016/0925-8574(95)00066-6
Vymazal, J. (2001). Types of constructed wetland for wastewater treatment: Their potential for nutrient removal. The Netherlands: Backhuys Publishers.
Vymazal, J., & Kröpfelová, L. (2008). Wastewater treatment in constructed wetlands with horizontal sub-surface flow (Vol. 14). Springer science & business media. Retrieved from https://doi.org/10.1007/978-1-4020-8580-2
Vymazal, J., & Kröpfelová, L. (2009). Removal of nitrogen in constructed wetlands with horizontal sub-sureface flow : à review. Wetlands, 29(4), 1114-1124. Retrieved from https://doi.org/10.1672/08-216.1
Vymazal, J., Greenway, M., Tonderski, K., Brix, H., & Mander, Ü. (2006). Constructed Wetlands for Wastewater Treatment. In J. T. A. Verhoeven, B. Beltman, R. Bobbink, & D. F. Whigham (Eds.), Wetlands and Natural Resource Management (pp. 69-96). Springer Berlin Heidelberg. Retrieved from https://doi.org/10.1007/978-3-540-33187-2_5
Weis, J. S., & Weis, P. (2004). Metal uptake, transport and release by wetland plants : implications for phytoremediation and restoration. Environment International, 30(5), 685-700. Retrieved from https://doi.org/10.1016/j.envint.2003.11.002
Zhu, T., Maehlum, T., Jenssen,
P. D., & Krogstad, T. (2003). Phosphorus sorption characteristics
of a light-weight aggregate.
Water Science and Technology, 48(5), 93-100.
https://doi.org/10.2166/wst.2003.0290 Water Science and Technology
Retrieved from https://doi.org/10.2166/wst.2003.0290
 This work is licensed under a: Creative Commons Attribution 4.0 International License
© Granthaalayah 2014-2022. All Rights Reserved.