ANALYSIS OF THE EFFECT OF CUSTOMER BUYING INTENTION ON THE SELECTION OF THE NEW NORMAL KIT IN THE COVID-19 PANDEMICGolan Hasan 1 1, 2 Faculty of Economic, University International Batam, Batam City, Indonesia |
|
||
|
|
|||
|
Received 17 December 2021 Accepted 4 January 2022 Published 31 January 2022 Corresponding Author Richart,
richarttzheng@gmail.com DOI 10.29121/granthaalayah.v10.i1.2022.4480 Funding:
This
research received no specific grant from any funding agency in the public,
commercial, or not-for-profit sectors. Copyright:
© 2022
The Author(s). This is an open access article distributed under the terms of
the Creative Commons Attribution License, which permits unrestricted use, distribution,
and reproduction in any medium, provided the original author and source are
credited.
|
ABSTRACT |
|
|
|
This
study aims to analyze the effect of Health benefit, Brand Quality, Brand
Trust, and Price by mediating Perceived Value on Buying Intention. according
to the requirements in the known population of 1.1 million people have
visited, then based on Krejcie and Morgan table, the number of samples that
must be required is 384 respondents. The data used in this study were 384
respondents. Results obtained from the Partial Least Square (PLS) approach
for data analysis it is said that the Health Benefit variable has a
significant effect on Perceived value, as well as Brand Quality, Brand Trust,
Price variables which also have a significant effect on Perceived value. and
then also has a significant effect on the perceived value variable on buying
intention, as well as the health benefit variable with price which also has a
significant effect on buying intention. |
|
||
|
Keywords: Health
Benefit, Brand Quality, Brand Trust, Price, Perceive Value, And Buying
Intention 1. INTRODUCTION In the last two
decades, there have been outbreaks of diseases that infect human respiratory
tract which can lead to death, so that it is seen as one of the serious
dangers for global health. In 2002, the emergence of a viral disease named
SARS-CoV had a very dangerous impact on global health. Then in 2012 the
emergence of a viral disease named MERS-CoV which also greatly affects human
health. In early December 2019, a case of pneumonia with unknown reasons
appeared in Wuhan City, Hubei, in China. It was stated that a deadly virus
called the Corona Virus or COVID-19 had emerged He and Harris (2020). COVID-19 causes infection in human
respiration which causes shortness of breath which can lead to death.
COVID-19 is spreading rapidly in such a manner that as of March 16, 2020, it
is known that there have been 180,000 confirmed cases of COVID-19 worldwide,
with more than 7000 deaths. This COVID-19 is spreading rapidly to all
countries causing an increasing infection rate and also an increasing death
rate. The outbreak of the COVID-19 virus has spread throughout the world and
the State of Indonesia is also one of the countries affected by COVID-19. On
March 19, 2020, it was stated that Indonesia had many patients infected with
COVID-19 and also the percentage of deaths of COVID-19 patients in Indonesia
was increasing. |
|
||
|
Table 1 Number of Covid-19 Cases in Asian Countries 2020 |
||||
|
Country |
Total Confirmed
case |
Total New Case |
Total Death |
Total New Death |
|
South East-Asia
Region |
||||
|
Thailand |
2518 |
45 |
35 |
2 |
|
India |
7447 |
1035 |
239 |
40 |
|
Indonesia |
3512 |
0 |
306 |
0 |
|
Srilanka |
197 |
7 |
7 |
0 |
|
Bangladesh |
424 |
94 |
27 |
6 |
|
Maldives |
19 |
0 |
0 |
0 |
|
Myanmar |
28 |
1 |
3 |
0 |
|
Nepal |
9 |
0 |
0 |
0 |
|
Bhutan |
5 |
0 |
0 |
0 |
|
Timor-Leste |
2 |
1 |
0 |
0 |
|
Subtotal |
14161 |
1183 |
617 |
48 |
|
Source : (Kompas.com 2020) Indonesia |
||||
In preventing the transmission of the COVID-19 virus, the Government has also implemented healthy living and health protocols that must be adhered to by the community in order to reduce the percentage of the risk of contracting the COVID-19 virus in their daily lives and activities. The government urges the public to always wash their hands, use the New Normal Kit such as hand sanitizers, masks, and do social distancing. This is a Health Protocol that must be adhered to by the Indonesian people in order to prevent the possibility of spreading the COVID-19 virus Spinelli and Pellino (2020). because it is the community's obligation to always maintain cleanliness and wear masks and New Normal Kit equipment, this causes the level of public demand for masks and other health equipment to increase. To meet the needs of public health, there are so many New Normal Kits that have their own brands that can meet the needs of the community in undergoing health protocols. The use of the New Normal Kit during the COVID-19 pandemic has triggered an increasing number of New Normal Kit products with different brands. So that the community can make decisions in choosing the health equipment they want to meet their health needs in undergoing health protocols.
2. LITERATURE REVIEW
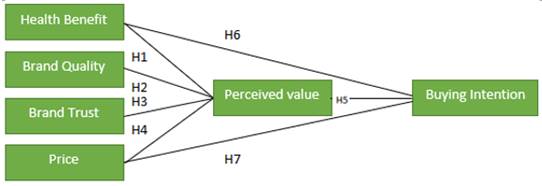
Health Benefit on
Perceived Value
Han and Hwang (2013) stated that the effect of Health Benefit on Perceived Value has a result that states it has a significant effect. This statement is also supported by Chen and Hu (2010). which also has research results showing that Health Benefit has a significant effect on Perceived value. Research conducted by Konuk (2018). The statement states that Health benefits can make consumers feel that they are getting more benefits.
H1: Health Benefit has a
significant positive effect on Perceived value
Brand Quality with
Perceived Value
Chen and
Chen (2010) states that the level of profit received by consumers is significantly
influenced by brand quality. This statement is also supported by Dewi (2020) with the results of his research which states that quality has a
significant effect on perceived value. The research conducted Coelho
et al. (2020), states that quality has a
significant effect on the benefits received by consumers.
H2: Brand Quality has a
significant positive effect on Perceived value
Brand Trust with Perceived
Value
Ruan et al. (2020) stated that the influence of Brand trust on Perceived Value has results
which state that it has a significant effect. This statement is also supported
by Choi and Lee (2019), who also have research results
showing that trust has a significant effect on Perceived value. The research
conducted by Chae et al. (2020), states that consumer trust in a brand creates a value that is accepted
by consumers.
H3: Brand Trust has a
significant positive effect on Perceived value
Price with Perceived Value
Pandey
et al. (2020) said that the relationship between Price and Perceived Value had a
result which stated that it had a significant effect. This statement is also
supported by García-Acebrón et al. (2010) which also has research results showing that the price of a product has
a significant effect on the perceived value received by consumers. The research
conducted by Ali and Bhasin (2019) states that the right price can make consumers feel that they get more
benefits.
H4: Price has a significant
positive effect on Perceived value
Perceived Value to Buying
Intention
García-Acebrón et al. (2010)states that the value received by consumers has a significant effect on
consumers' purchase intentions. This statement is also supported by Ali and Bhasin (2019) who also have research results showing that Perceived Value has a
significant effect on Buying Intention. The research conducted by Pandey
et al. (2020) states that the benefits received by consumers will be a factor that
influences their purchase intentions.
H5: Perceived Value has a
significant positive effect on Buying Intention
Health Benefit with Buying
Intention
Huang et al. (2020) stated that the health benefits perceived by consumers had an effect on purchase intentions. This statement is also supported by Tudoran et al. (2009) which also has research results showing that Health benefits have a significant effect on Buying Intention. The research conducted by Bower et al. (2003) states that Health Benefit is one of the factors that influence consumer buying intentions.
H6: Health Benefit has a
significant positive effect on Buying Intention
Price with Buying
Intention
Alford
and Biswas (2002) stated that the influence of Price on Buying Intention has a result
which states that it has a significant effect. This statement is also supported
by Lien et al. (2015) which also has research results showing that Price has a significant
effect on Buying Intention. The research conducted by Katt and Meixner (2020) states that price is one of the factors that significantly influences
consumers' purchase intentions.
H7: Price has a significant
positive effect on Buying Intention
|
|
|
Figure 1 Effect of Health Benefit, Brand Quality, Brand trust,
Price, and Perceived value on Buying Intention |
3. RESEARCH METHODS
This research methodology
uses sample data collection techniques carried out through surveys by utilizing
digital in the form of questionnaires distributed online to get responses from
respondents who are residents of Batam City, totaling 1.1 million people, which
is then based on Krejcie and Morgan table, the number of samples or respondents
who must be accepted as many as 384 respondents. Then the data generated from 384
respondents was processed through a partial Least Square (PLS) approach for
data analysis. The object taken in the survey is the New Normal Kit with the
brands of Dettol, Nuvo, Sensi, Antis and Grace. In an effective data collection
process, namely through the distribution of questionnaires to respondents to
find out the response of the target respondents to find data regarding the New
Normal Kit chosen by the Batam City Community during the Covid-19 Pandemic.
4. RESULT AND DISCUSSION
The demographic data below
are obtained from the results of distributing online questionnaires to 384
respondents from the Batam City community through the distribution of online
links.
|
Table 2 Characteristic of Respondent |
||
|
Variable |
Amount |
Percent |
|
Gender |
||
|
Male |
208 |
54,2 |
|
Female |
176 |
45,8 |
|
Age |
||
|
17-25 Years |
347 |
90,4 |
|
26-35 Years |
27 |
7 |
|
Education |
||
|
High School |
311 |
81 |
|
Bachelor's degree |
65 |
16,9 |
|
Master's degree |
6 |
1,6 |
|
Doctor's degree |
2 |
0,5 |
|
Income per Month |
||
|
Below Rp. 4,000,000 |
102 |
26,6 |
|
Rp. 4,000,000 - Rp. 6,000,000 |
236 |
61,4 |
|
Rp. 6,500,000 - Rp. 8,500,000 |
36 |
9,4 |
|
Above Rp. 8,500,000 |
10 |
2,6 |
|
Favorite New Normal Kit Brand |
||
|
Nuvo |
123 |
32 |
|
Sensi |
125 |
32,6 |
|
Dettol |
95 |
24,7 |
|
Grace |
41 |
10,7 |
|
Source: Primary Data Processed (2022) |
||
Based
on the results of the data collected, the conclusions from the results of the
table above are as follows:
1) The result of the majority of Male respondent were
208 respondent (54.2%).
2) The result of the majority of respondent aged 17 –
25 Years were 347 respondent (90.4 %).
3) The result of the majority of high school education
respondent were 311 respondent (81%).
4) The result of the majority of respondent who earn
Rp. 4.000.000 – Rp. 6.000.000 per month were 236 respondent (61.4%).
5) The result of the majority of Sensi that was
respondent favorite New Normal Kit Brand were 125 respondent (32.6%).
The
number of questions distributed through questionnaires is data obtained from
previous research, all variables have 4 questions Sumi and Kabir (2018), Because there are 6 variables, a total of 24
questions are formed Jalilvand
et al. (2011).
5. CMB TEST (COMMON METHOD BIASES)
From the analysis of the SPSS
24.0 program, the result of the variance value is 46% which means the result is
less than 50%, it means that there is no common method bias in this research.
6. VALIDITY AND RELIABILITY TEST
in testing the data in this
study using the PLS system which can test the validity and reliability data
which can be determined from the outer loading value of each indicator whose
value exceeds 0.6. then validity can also be determined through the value of
Average Variance Extracted (AVE) which must show the value of each variable
that exceeds 0.5. then the results will be declared significant if the results
of the processed data show a t-statistic value more than 1.96 or a P-value
below 0.05.
|
Table 3 Summary of Validity Test Result |
|||
|
Variable |
Indicator |
Loadings |
AVE |
|
Buying Intention |
BI1 |
0.716 |
0.691 |
|
BI2 |
0.927 |
||
|
BI3 |
0.750 |
||
|
BI4 |
0.910 |
||
|
Brand Quality |
BQ1 |
0.743 |
0.549 |
|
BQ2 |
0.898 |
||
|
BQ3 |
0.857 |
||
|
BQ4 |
0.321 |
||
|
Brand Trust |
BT1 |
0.915 |
0.634 |
|
BT2 |
0.829 |
||
|
BT3 |
0.911 |
||
|
BT4 |
0.424 |
||
|
Health Benefit |
HB1 |
0.853 |
0.670 |
|
HB2 |
0.751 |
||
|
HB3 |
0.838 |
||
|
HB4 |
0.827 |
||
|
Price |
P1 |
0.870 |
0.697 |
|
P2 |
0.797 |
||
|
P3 |
0.893 |
||
|
P4 |
0.774 |
||
|
Perceived Value |
PV1 |
0.874 |
0.695 |
|
PV2 |
0.753 |
||
|
PV3 |
0.822 |
||
|
PV4 |
0.880 |
||
|
Source: Primary Data Processed (2022) |
|||
In the Cronbach's Alpha
test if the test results show a value above 0.05 then the data can be declared
reliable and if Composite Reliability shows results that have a value that
exceeds 0.7, then the data table can be declared reliable.
|
Table 4 Reliability Test Result |
||
|
Variable |
Composite
Reliability |
Cronbach's
Alpha |
|
Brand Quality |
0.815 |
0.701 |
|
Brand Trust |
0.866 |
0.788 |
|
Buying Intention |
0.898 |
0.847 |
|
Health Benefit |
0.890 |
0.835 |
|
Perceived Value |
0.901 |
0.853 |
|
Price |
0.902 |
0.854 |
|
Source: Primary Data Processed (2022) |
||
based on the results
above, shows the results of reliability and can it is said that all questions
have a composite reliability above 0.7 so that declared reliable.
7. INNER MODEL TEST (STRUCTURAL MODEL)
Path Coefficient Test
A relationship can be said to
be significant with a significance level of 5%, if it has P-values
below 0.05 or T-statistics more than 1.96. This test uses the path coefficient test and specific
indirect effects.
|
Table 5 Summary of Path Coefficients Test Result |
|||
|
Variable |
T-Statistic |
P-Value |
Explanation |
|
Brand Quality-> Percevied Value |
2.814 |
0.006 |
Significant |
|
Brand Trust-> Perceived Value |
2.389 |
0.002 |
Significant |
|
Health Benefit-> Buying Intention |
2.896 |
0.004 |
Significant |
|
Health Benefit-> Perceived Value |
13.664 |
0.000 |
Significant |
|
Perceived Value-> Buying Intention |
6.518 |
0.000 |
Significant |
|
Price-> Buying Intention |
5.353 |
0.000 |
Significant |
|
Price-> Perceived Value |
2.611 |
0.009 |
Significant |
|
Source: Primary Data Processed (2022) |
|||
Hypothesis 1
H1 : Health Benefit
Affects Perceived Value
The results of the direct
influence test in the table above show the Health Benefit variable The
Perceived Value has a significant effect as seen from the tstatistics value of 13.664
and with a P-Value of 0.000. The results of this test are in line with research
from Chen and Hu (2010) and Han and Hwang (2013).
Hypothesis 2
H2 : Brand Quality
Affects Perceived Value
The results of the direct
influence test in the table above show the Brand Quality variable The Perceived
Value has a significant effect as seen from the tstatistics value of 2.814 and
with a P-Value of 0.006. The results of this test are in line with research
from Chen and Hu (2010) and Coelho
et al. (2020).
Hypothesis 3
H3 : Brand Trust Affects
Perceived Value
The results of the direct
influence test in the table above show the Brand Trust variable The Perceived
Value has a significant effect as seen from the tstatistics value of 2.389 and
with a P-Value of 0.002. The results of this test are in line with research
from Chae et al. (2020) and Ruan et al. (2020).
Hypothesis 4
H4 : Price Affects
Perceived Value
The results of the direct
influence test in the table above show the Price variable The Perceived Value
has a significant effect as seen from the tstatistics value of 2.611 and with a
P-Value of 0.009. The results of this test are in line with research from Pandey
et al. (2020) and García-Acebrón et al. (2010).
Hypothesis 5
H5 : Perceived Value
Affects Buying Intention
The results of the direct
influence test in the table above show the Perceived Value variable The Buying
Intention has a significant effect as seen from the tstatistics value of 6.518
and with a P-Value of 0.000. The results of this test are in line with research
from Pham et al. (2018) and Jalilvand
et al. (2011).
Hypothesis 6
H6 : Health Benefit
Affects Buying Intention
The results of the direct
influence test in the table above show the Health Benefit variable The Buying
Intention has a significant effect as seen from the tstatistics value of 2.896
and with a P-Value of 0.004. The results of this test are in line with research
from Jalilvand
et al. (2011) and Tudoran
et al. (2009).
Hypothesis 7
H7 : Price Affects
Buying Intention
The results of the direct
influence test in the table above show the Price variable The Buying Intention has
a significant effect as seen from the tstatistics value of 5.353 and with a P-Value
of 0.000. The results of this test are in line with research from Sumi and Kabir (2018) and Calvo-Porral
and Lévy-Mangin (2017).
|
Table 6 Indirect Effect Test Result |
|||
|
Variable |
T-Statistic |
P-Value |
Explanation |
|
Brand Quality-> Buying Intention |
1.485 |
0.138 |
Not Significant |
|
Brand Trust-> Buying Intention |
1.256 |
0.210 |
Not Significant |
|
Health Benefit-> Buying Intention |
5.020 |
0.000 |
Significant |
|
Price-> Buying Intention |
2.589 |
0.010 |
Significant |
|
Source: Primary Data Processed (2022) |
|||
This test shows that the Brand Quality variable has an
indirect effect on Buying Intention showing a t-statistic value of 1.485 and a
p-value of 0.138, so it can be stated that it has no significant effect on
advertising, as well as the brand trust variable that has an indirect effect on
buying intention. which shows the results of the t-statistic value of 1.256 and
also the p-value of 0.210 which can be stated to have no significant effect.
However, the Health benefit variable that indirectly affects Buying Intention
shows the results of a t-statistic value of 5.020 and a p-value of 0.000 which
can be stated that the two variables have a significant effect, as well as the
price variable which has an indirect effect on Buying. Intention which shows
the results of the T-statistic value of 2.589 and the p-value of 0.010 which
can be stated that the two variables have a significant effect.
8. R SQUARE TEST
This test has the aim of
testing the relationship between independent variable, mediating variable and
dependent variable. Seen in the Table 7 results from each variable.
|
Table 7 R Aquare Adjusted |
|
|
Variable |
R Square
Adjusted |
|
Buying Intention |
0.946 |
|
Perceived Value |
0.984 |
|
Source: Primary Data Processed (2022) |
|
9. QUALITY INDEX TEST
In the Gof test can find out
the quality of a good index Using the formula GoF = Common x R2, where Common
is the average of AVE(community) and R2 is the average of R square, then the
calculation of GoF test = 0.656 x 0.965 produces 0.63304 (> 0.36), so it is
stated that this research model belongs to the large outcome group (GoF Large) Hair et al. (2020).
10. CONCLUSIONS
The purpose of this research is to have an understanding of the buying intention of a New Normal Kit brand during the COVID-19 pandemic. The conclusion in this study states that Health Benefit has a significant effect on Perceived Value, Brand Quality has a significant effect on Perceived Value, Bran Trust has a significant effect on Perceived Value, Price has a significant effect on Perceived Value, then Perceived Value also has a significant effect on Buying Intention, Health Benefit also has a significant effect on Buying Intention and so does Price which also has a significant effect on Buying Intent. it can be concluded that health benefits can affect the value of benefits received by consumers, as well as quality, trustworthiness and price, then also perceived value that can affect consumers' purchase intentions as well as health benefits and prices received by consumers can also affect their purchase intentions. The limitations of this study are that it only uses a limited object, and also hopes that subsequent observations can consider questions that do not valid not to be used in further research but can be add variable questions - certain variables in order to be able to strengthen a variable. then it is also recommended that in the next research it can add a sample of the New Normal Kit brand which will be studied and can also add the trust variable as an intervening variable which then affects the dependent variable Buying Intention.
REFERENCES
(Jalilvand et al., 2011) Alford, B. L., & Biswas, A. (2002). The effects of discount level, price consciousness and sale proneness on consumers' price perception and behavioral intention. Journal of Business Research, 55(9), 775-783. Retrieved from https://doi.org/10.1016/S0148-2963(00)00214-9
Ali, A., & Bhasin, J. (2019). Understanding Customer Repurchase Intention in E-commerce : Role of Perceived Price, Delivery Quality, and Perceived Value. Jindal Journal of Business Research, 8(2), 142-157. Retrieved from https://doi.org/10.1177/2278682119850275
Bower, J. A., Saadat, M. A., & Whitten, C. (2003). Effect of liking, information and consumer characteristics on purchase intention and willingness to pay more for a fat spread with a proven health benefit. Food Quality and Preference, 14(1), 65-74. Retrieved from https://doi.org/10.1016/S0950-3293(02)00019-8
Calvo-Porral, C., & Lévy-Mangin, J. P. (2017). Store brands' purchase intention : Examining the role of perceived quality. European Research on Management and Business Economics, 23(2), 90-95. Retrieved from https://doi.org/10.1016/j.iedeen.2016.10.001
Chae, H., Kim, S., Lee, J., & Park, K. (2020). Impact of product characteristics of limited edition shoes on perceived value, brand trust, and purchase intention ; focused on the scarcity message frequency. Journal of Business Research, 120(November), 398-406. Retrieved from https://doi.org/10.1016/j.jbusres.2019.11.040
Chen, C. F., & Chen, F. S. (2010). Experience quality, perceived value, satisfaction and behavioral intentions for heritage tourists. Tourism Management, 31(1), 29-35. Retrieved from https://doi.org/10.1016/j.tourman.2009.02.008
Chen, P. T., & Hu, H. H. (2010). The effect of relational benefits on perceived value in relation to customer loyalty : An empirical study in the Australian coffee outlets industry. International Journal of Hospitality Management, 29(3), 405-412. Retrieved from https://doi.org/10.1016/j.ijhm.2009.09.006
Choi, E., & Lee, K. C. (2019). Effect of trust in domain-specific information of safety, brand loyalty, and perceived value for cosmetics on purchase intentions in mobile e-commerce context. Sustainability (Switzerland), 11(22). Retrieved from https://doi.org/10.3390/su11226257
Coelho, F. J. F., Bairrada, C. M., & de Matos Coelho, A. F. (2020). Functional brand qualities and perceived value : The mediating role of brand experience and brand personality. Psychology and Marketing, 37(1), 41-55. Retrieved from https://doi.org/10.1002/mar.21279
Dewi, V. F. (2020). Analisis Pengaruh Reputation dan Satisfaction Terhadap Purchase Intention pada Website Travelling. Retrieved from http://repository.uib.ac.id/2108/
García-Acebrón, C., Vázquez-Casielles, R., & Iglesias, V. (2010). The effect of perceived value and switching barriers on customer price tolerance in industrial energy markets. Journal of Business-to-Business Marketing, 17(4), 317-335. Retrieved from https://doi.org/10.1080/10517121003620704
Hair, J. F., Howard, M. C., & Nitzl, C. (2020). Assessing measurement model quality in PLS-SEM using confirmatory composite analysis. Journal of Business Research, 109(November 2019), 101-110. Retrieved from https://doi.org/10.1016/j.jbusres.2019.11.069
Han, H., & Hwang, J. (2013). Multi-dimensions of the perceived benefits in a medical hotel and their roles in international travelers' decision-making process. International Journal of Hospitality Management, 35, 100-108. Retrieved from https://doi.org/10.1016/j.ijhm.2013.05.011
He, H., & Harris, L. (2020). The impact of Covid-19 pandemic on corporate social responsibility and marketing philosophy. Journal of Business Research, 116, 176-182. Retrieved from https://doi.org/10.1016/j.jbusres.2020.05.030
Huang, L., Bai, L., & Gong, S. (2020). The effects of carrier, benefit, and perceived trust in information channel on functional food purchase intention among Chinese consumers. Food Quality and Preference, 81, 103854. Retrieved from https://doi.org/10.1016/j.foodqual.2019.103854
Hyun, S. S., & Han, H. (2012). A model of a patron's innovativeness formation toward a chain restaurant brand. International Journal of Contemporary Hospitality Management, 24(2), 175-199. Retrieved from https://doi.org/10.1108/09596111211206141
Jalilvand, M. R., Samiei, N., & Mahdavinia, S. H. (2011). The Effect of Brand Equity Components on Purchase Intention : International Business and Management, 2(2), 149-158.
Katt, F., & Meixner, O. (2020). Is it all about the price ? An analysis of the purchase intention for organic food in à discount setting by means of structural equation modeling. Foods, 9(4), 1-13. Retrieved from https://doi.org/10.3390/foods9040458
Konuk, F. A. (2018). The role of store image, perceived quality, trust and perceived value in predicting consumers' purchase intentions towards organic private label food. Journal of Retailing and Consumer Services, 43(April), 304-310. Retrieved from https://doi.org/10.1016/j.jretconser.2018.04.011
Lien, C. H., Wen, M. J., Huang, L. C., & Wu, K. L. (2015). Online hotel booking: The effects of brand image, price, trust and value on purchase intentions. Asia Pacific Management Review, 20(4), 210-218. Retrieved from https://doi.org/10.1016/j.apmrv.2015.03.005
Pandey, N., Tripathi, A., Jain, D., & Roy, S. (2020). Does price tolerance depend upon the type of product in e-retailing ? Role of customer satisfaction, trust, loyalty, and perceived value. Journal of Strategic Marketing, 28(6), 522-541. Retrieved from https://doi.org/10.1080/0965254X.2019.1569109
Pham, Q. T., Tran, X. P., Misra, S., Maskeliunas, R., & Damaševičius, R. (2018). Relationship between convenience, perceived value, and repurchase intention in online shopping in Vietnam. Sustainability (Switzerland), 10(1). Retrieved from https://doi.org/10.3390/su10010156
Ruan, W. Q., Zhang, S. N., Liu, C. H., & Li, Y. Q. (2020). A new path for building hotel brand equity : the impacts of technological competence and service innovation implementation through perceived value and trust. Journal of Hospitality Marketing and Management, 29(8), 911-933. Retrieved from https://doi.org/10.1080/19368623.2020.1738302
Spinelli, A., & Pellino, G. (2020). COVID-19 pandemic : perspectives on an unfolding crisis. British Journal of Surgery, 107(7), 785-787. Retrieved from https://doi.org/10.1002/bjs.11627
Sumi, R. S., & Kabir, G. (2018). Factors affecting the buying intention of organic tea consumers of Bangladesh. Journal of Open Innovation : Technology, Market, and Complexity, 4(3). Retrieved from https://doi.org/10.3390/joitmc4030024
Tudoran, A., Olsen, S. O., & Dopico, D. C. (2009). The effect of health benefit information on consumers health value, attitudes and intentions. Appetite, 52(3), 568-579. Retrieved from https://doi.org/10.1016/j.appet.2009.01.009
 This work is licensed under a: Creative Commons Attribution 4.0 International License
© Granthaalayah 2014-2022. All Rights Reserved.