TWINSPAN CLASSIFICATION OF VEGETATION FROM NORTHEAST ASPECT OF LOWER TANAWAL ABBOTTABAD, PAKISTANAdeela Bibi 1 1 Department of Botany, Hazara University Mansehra-21300, Pakistan |
|
|||
|
|
||||
|
Received 2 November 2021 Accepted 16 December 2021 Published 31 January 2022 Corresponding Author Adeela
Bibi, adeelabibi4@gmail.com DOI 10.29121/granthaalayah.v10.i1.2022.4423 Funding:
This
research received no specific grant from any funding agency in the public,
commercial, or not-for-profit sectors. Copyright:
© 2022
The Author(s). This is an open access article distributed under the terms of
the Creative Commons Attribution License, which permits unrestricted use, distribution,
and reproduction in any medium, provided the original author and source are
credited.
|
ABSTRACT |
|
||
|
The main objective of this research study was to explore the vegetation of Lower
Tanawal, Pakistan from Northeast aspect. The ordination techniques TWINSPAN, DCA and CCA were used to classify
the data. TWINSPAN classified 157
plant species and 20 stands into four plant
communities. Four plant communities Dodonaea-Ziziphus-Oxalis, Pinus–Olea–Micromeria, Debregessia-Mentha-Isodon, and Pinus-Punica-Isodon community were noted. This study provides first information about the vegetation of Lower Tanawal, Abbottabad Pakistan from
Northeast aspect. |
|
|||
|
Keywords: TWINSPAN,
Northeast, Vegetation, CCA, DCA, Lower Tanawal 1. INTRODUCTION In this research study for
the classification of species and stands TWINSPAN techniques have been used Hill (1979). The relationship between
plant species and environmental variable is determined with the
help of CCA. To determine the relationship among vegetation the
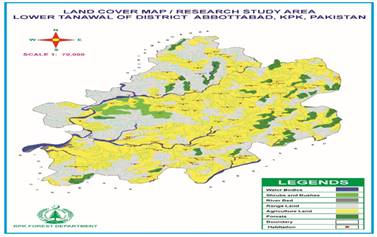
DCA is used (Antoine and Niklaus, 2000). Study
Area The Lower Tanawal is located in
District Abbottabad, Pakistan. The Lower Tanawal is part of the Lesser
Himalayas Hussain and Illahi
(1991). It is situated between the 34° 12' 32 and
34° 15´ 76 North latitude to 73° 09' 39 and 73° 03´ 31 East longitudes Bibi et al. (2019).
|
|
|||
2. METHODOLOGY
The vegetation analysis of Lower Tanawal from Northeast
aspect was done in different seasons from 2016-2018. Line transects method was
used for quantitative sampling. In this
method to measure the distribution of plants measuring tape of
3. RESULTS
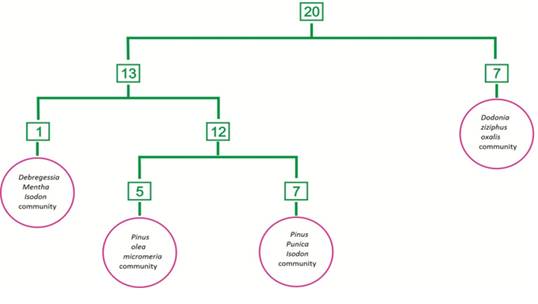
In this classification 20 stands and 157 species were noted. The
data was classified into two groups. In
division 1, thirteen stands were positioned in negative groups (*0) whereas seven stands were positioned in positive group (*1). In division 1 the eigenvalue was 0.40. In division 2 (13) one stand was positioned in negative group (*00) whereas twelve
stands were positioned in positive group (*01).
In division 3 (12) five
stands were positioned in negative group (*00)
whereas seven stands were positioned in positive group (*01).
Then following four plant communities were formed (Figure 2).
|
|
|
Figure 2 Twinspan Classification
of Vegetation from Northeast Aspect of Lower Tanawal |
1) Dodonaea-Ziziphus-Oxalis
Community (DZO)
During the analysis it was observed that in
this community 7 stands and 105 species were recognized. This
plant community was noted from the stand
19,26,20,66,23,64,51 between the elevations of 3025-4302
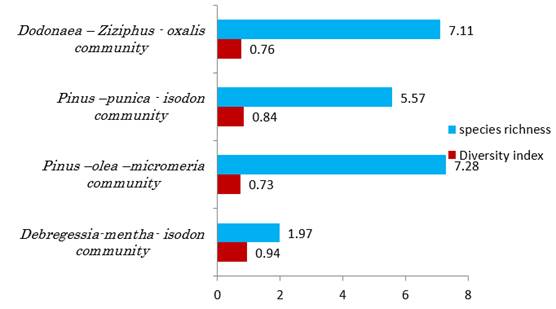
ft. The diversity index was 0.76 and the species richness was 7.11 (Figure 3). The soil of this community was loam and pH range of the soil was
6.87 to 7.29.
2) Pinus–Olea–Micromeria Community
(POM)
This community was noted from the stands
2, 11, 14, 58 and 60 between the elevations of 3892 to
3) Debregessia-Mentha-Isodon Community
(DMI)
Debregessia
salicifolia, Mentha arvensis, Isodon rugosus community was recorded from
stand 79, locality of Panduthana at an elevation of 4220
ft. In this community one stand and eighteen plant species were recognized. The
diversity index was 0.94. The species richness was 1.97 (Figure 3). The soil of was loam and pH of the soil was 7.40.
4) Pinus-Punica-Isodon
Community (PPI)
Pinus
roxburghii, Punica granatum, Isodon rugosus
community was recorded from stand 6,
41,32, 44, 54, 47, 57 between the elevations of 3560 to 4827 ft. In this
community seven stands and 78 species were noted. The index of diversity was 0.84. The
species richness was 5.57 (Figure 3). The soil of this
community was loam to clay loam and pH range of the soil was 6.80 to 7.28.
|
|
|
Figure 3 Diversity
index and species richness of Northeast aspect |
3.1. DCA
ORDINATION OF VEGETATION FROM NORTHEAST ASPECT
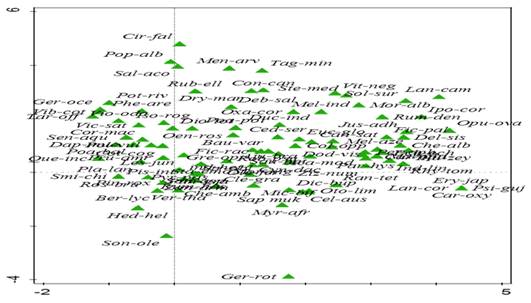
In
DCA ordination, for axis 2 the maximum gradient length was 3.01 having and
Eigenvalue was 0.27. The gradient length at axis 1 was 2.69 with Eigenvalue
0.40. At axis 3 the gradient length was 2.13 with Eigenvalue 0.19. The gradient
length for axis 4 was 1.63 having Eigenvalue 0.12. The dominant gradient length
on axis 2 indicated that maximum species has similarities on axis 2. The
Eigenvalue of axes 1 and 2 shown strong correlation of species and habitat on
these axes.
Cynodon dactylon,
Indigofera heterantha, Indigiofera linifolia, have positive correlation
with each other at axis I. Salix acmophylla, Oenotrera rosea and Isodon
rugosus have positive correlation with axis 2. Berberis lycium, Pinus roxburghii, Hedera helix, Smilax china were
negatively correlated with axis 1 and 2. Psidium
guajava, and Eriobotrya japonica
showed positive correlation on axis 1 and negative correlation with Similx china and Pinus roxburghii. Mentha
arvensis and Tagetes minuta were
present on the top of the ordination space and shown negative correlation with Geranium rotundifolium. Mostly species
shown strong correlation and grouped together in the center. (Figure 4).
|
|
|
Figure 4 Northeast DCA ordination of
species |
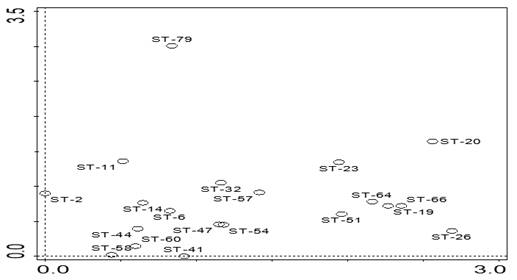
DCA ordination of stands showed that stand 79 was present at the
top of the ordination space and away from the others stands having diverse
species and negatively correlated with stand 58 and 41 which were present on
axis 1 whereas stand 2 was present on axis 2 which showed negative correlation
with stand 20 whereas other stands were in the center of ordination space (Figure 5).
|
|
|
Figure 5 Northeast DCA ordination of
stands |
3.2. CCA ORDINATION OF
VEGETATION FROM NORTHEAST ASPECT
The CCA ordination shown
that maximum Eigenvalue was 0.39 at axis I. For axis 2 (0.34) for axis 3 (0.28)
and for axis 4 (0.25). The total variation was 3.45, explanatory variables
account for 92.1% whereas adjusted explained variation was 24.8%. The explained
fitted variation for axes 1, 2, 3 and 4 were 12.27, 23.01, 32.06 and 40.12
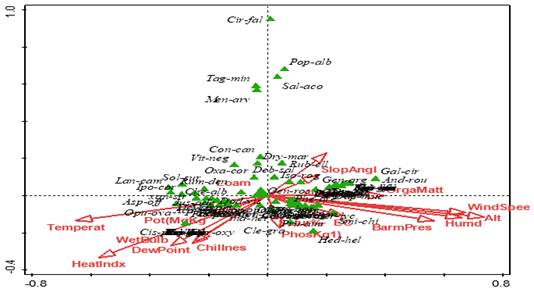
respectively. The
CCA ordination shown that Asparagus
officinalis, Justicia adhatoda Indigofera heterantha, and Opuntia ovata indicated positive
correlation with temperature, wet bulb, chillness, dew point, heat index and
negatively correlated with slope angle.
Hedra helix, Berberis lycium, and Smilax
china indicated positive correlation with phosphorus, humidity, barometer
pressure, electrical conductivity, saturation, wind speed, altitude and while Oxalis corniculata, Vitis negundo, and
Chenopodium album were negatively correlated with these factors.Gallium circaezans, and Gentiana argenta shown positive
correlation with organic matter. Most species were present near average position
in ordination space (Figure 6). The environmental factors dew point, chillness, temperature, and
heat index have positive correlation with each other and negative correlation
with slope angle and organic matter.
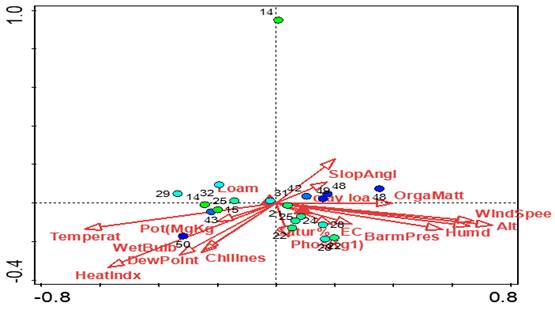
CCA
ordination of stands showed that one stand with 14 plant species was present at
the top of the ordination space. This stand has more diverse species as compared
to other stands. The results of CCA
ordination shown that maximum vectors strength was noted for heat index, altitude,
and temperature. The intermediate vectors strength was noted for wind speed,
chillness, dew point, slope angle and humidity. The less strength of vectors
was documented for organic matter, saturation, slope angle, electrical conductivity,
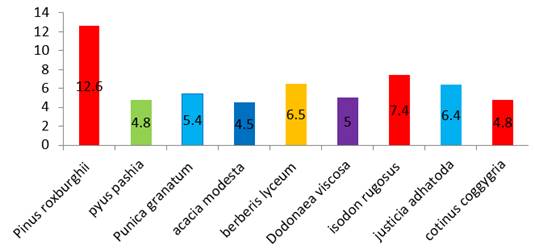
and barometer pressure (Figure 7) It was observed that from the Northeast aspect
in tree maximum density was noted for Pinus
roxburghii (12.6) and in shrubs maximum density was recorded for Isodon rugosus (7.4) (Figure 8).
|
|
|
Figure 6 Northeast CCA ordination of species and environmental variable |
|
|
|
Figure 7 Northeast CCA ordination of
stands and environmental Variable |
|
|
|
Figure 8 Density of major tree and shrubs from Northeast aspect |
4. DISCUSSION
In
DCA ordination, for axis 2 the maximum gradient length was 3.01 having and
Eigenvalue was 0.27. The dominant gradient length on axis 2 indicated that
maximum species has similarities on axis 2. The results of CCA ordination shown that maximum vectors strength
was noted for temperature and wind speed, which indicated that these, were most
influential variable in this aspect. There was less strength of vectors for
phosphorus, slope angle, potassium, and organic matter.
Phosphorus, humidity, barometer pressure, electrical conductivity, saturation, wind speed, altitude showed positive correlation with each other. Dew point, chillness, temperature, and heat index have positive correlation with each other and negative correlation with slope angle and organic matter. Most species were present near average position in ordination space. It was observed that from the Northeast aspect in tree maximum density was noted for Pinus roxburghii (12.6) and in shrubs maximum density was recorded for Isodon rugosus (7.4). It was also noted that maximum species richness (7.28) was recorded from Pinus–Olea–Micromeria Community. Maximum diversity index was noted from Debregessia-Mentha-Isodon Community.
REFERENCES
Bibi, A. Z. Iqbal, G.M. Shah. (2019). Floristic diversity, biological spectrum of Lower Tanawal, KP, Pakistan. Ukr. J. Ecol., (9) 4, 505-514. Retrieved from https://doi.org/10.15421/2019_782
Dasti.A, S.A. Malik. (1998) A transect of vegetation and soil on the indus valley scarp slope, Pakistan, Pak. Plant sci, 4(2), 73-84.
F. Hussain and I. (1991) Ilahi. Ecology and Vegetation of Lesser Himalayas Pakistan. Jadoon Printing Press Peshawar,
Farag, El. M. (2014). Floristic Composition and traditional uses of plant species at Wadi Alkuf, Al-Jabal Al-Akhder, Libya. American-Eurasian J. Agric. Environ. 14 : 685-697. Retrieved from https://www.researchgate.net/profile/Farag-Elmokasabi-2/publication/309373648_Floristic_composition_and_traditional_uses_of_plant_species_at_Wadi_Alkuf_Al-Jabal_Al-Akhder_Libya/links/60c5c7714585157774d2e788/Floristic-composition-and-traditional-uses-of-plant-species-at-Wadi-Alkuf-Al-Jabal-Al-Akhder-Libya.pdf
Hill, M.O. (1979). Twinspan : A Fortran Program For Arranging Multivariate Data In An Ordered Two-Way Table By Classifcation Of The Individuals And Attributes. Ecology And Systematics, Cornell University, Ithaca, Ny.
Hill, M.O. and H.G. Gauch. (1980). Detrended correspondence analysis: An improved ordination technique. Vegetatio., 42 : 47-58. Retrieved from https://doi.org/10.1007/BF00048870
Hussain, F. and I. Illahi. (1991). Ecology and Vegetation of Lesser Himalayan Pakistan. Botany, Department. University of Peshawar, pp. 187
Khan, S.M. (2012). Plant communities and vegetation ecosystem services in the Naran valley, Western Himalaya. (Unpublished) PhD thesis, Department of Biological sciences, University of Leicester. 271 pp.
McCune, B. (1986). PC-ORD : an integrated system for multivariate analysis of ecological data. Abstr. Bot. 10 : 221-225.
Ter Braak, C.J.F. & Barendregt, L.G., (1986). Weighted averaging of species indicator values : Its efficiency in environmental calibration. Mathematical Biosciences. 78, 57-72. Retrieved from https://doi.org/10.1016/0025-5564(86)90031-3
Ter Braak, C.J.F., (1989). CANOCO - an extension of DECORANA to analyze species-environment relationships. Hydrobiologia. 184, 169-170 Retrieved from https://doi.org/10.1007/BF02392953
 This work is licensed under a: Creative Commons Attribution 4.0 International License
© Granthaalayah 2014-2022. All Rights Reserved.