LUNG CANCER DETECTION TECHNIQUE BASED ON SURF DESCRIPTOR AND KNN ALGORITHMSDalia Shihab Ahmed 1 1, 2 Department of Computer Science, College of Science,
Mustansiriya University, Baghdad, Iraq.
|
|
||
|
|
|||
|
Received 3 November 2021 Accepted 14 December 2021 Published 31 December 2021 Corresponding Author Karim
Q. Hussein, karim.q.h@uomustansiriyah.edu.iq DOI 10.29121/granthaalayah.v9.i12.2021.4416 Funding:
This
research received no specific grant from any funding agency in the public, commercial,
or not-for-profit sectors. Copyright:
© 2021
The Author(s). This is an open access article distributed under the terms of
the Creative Commons Attribution License, which permits unrestricted use, distribution,
and reproduction in any medium, provided the original author and source are
credited.
|
ABSTRACT |
|
|
|
In this
century, lung cancer is undoubtedly one of the major serious health problems,
and one of the leading causes of death for women and men worldwide. Despite advances
in treating lung cancer with unprecedented products of pharmaceutical and
technological advances, mortality and morbidity rates remain a major
challenge for oncologists and cancer biologists. Thus, there is an urgent
need to provide early, accurate, and effective diagnostic techniques to
improve the survival rate and reduce morbidity and mortality related to lung
cancer patients. Therefore, in this paper, an effective lung cancer screening
technique is proposed for the early detection of risk factors for lung
cancer. In this proposed technique, the powerful acceleration feature Speeded
up robust feature (SURF) was used to extract the features. One of the machine
learning methods was used to detect cancer by relying on the k nearest
neighbor (KNN) method, where the experimental results show an effective way
to discover SURF features and tumor detection by relying on neighborhoods and
calculating the distance using KNN. As a result, a high system sensitivity
performance success rate of 96% and a system accuracy of 99% has been
achieved. |
|
||
|
Keywords: Lung
Cancer, Detection Technique, SURF Descriptor, Feature Extraction, Machine
Learning 1. INTRODUCTION The World Health
Organization considers cancer to be one of the deadliest diseases. The most
prevalent disease is lung cancer, which is responsible for 18.4% of
cancer-related deaths and 11.6% of all cancer cases worldwide Bermúdez et al. (2021). Globally, there
has been an increase in recent trends of rates of malignancies, which can be
attributed to the increase in population. Especially since there are age
groups that are at greater risk than others for developing cancer, and those
between the ages of 50 and 60 years. According to some estimates, mortality
rates could rise by 60% by 2035 if current trends continue Schüz and Espina (2021). Malignant cells arise when cells in the lungs begin
to mutate uncontrollably, forming clusters known as tumors Bergers and Fendt
(2021). The high rates
of cancer worldwide are attributed to several reasons, the most important of
which are the increased exposure of the lung to hazardous substances and the
increase in the number of elderly people. Symptoms of such diseases are
usually undetectable until they have spread to other organs of the body,
making treatment difficult Koo et al. (2020). People who
smoke are more likely to develop lung cancer at some point in their lives,
but lung cancer can also affect people who have never smoked. Adenocarcinomas
and |
|
||
squamous cell carcinomas are the most common types of lung cancer, while other classes of tissue diseases include small and large cell carcinomas Zhou et al. (2021). Adenocarcinoma is a type of lung cancer that can occur in people who smoke or have recently quit. Predicting the early stage of lung cancer can save many lives when the cancerous tumor is in its early stages Vaishaw et al. (2018). In addition to examining the patient, a blood test, X-ray, biopsy, and CT scan are used to diagnose cancer. The detection of the lung nodule through chest radiography is the most difficult aspect for the radiologist Nanda et al. (2019). Small lumps of tissue that appear as white shadows on CT scans and X-rays are known as pulmonary nodules. When dealing with such high-dimensional data, statistical analysis alone confronts many difficulties. Complications also arise when low-characterized radiographs put the health care professional's overall decision-making to the test. Due to a lack of image characterizes, one-third of radiologists fail to identify tiny nodules in positive instances, according to previous research. As a result, photo-containing pulmonary nodules must be pre-processed Huang and Shan (2017).
Diagn Lung cancer early detection and prevention should be prioritized. computed tomography (CT), Chest radiography (X-ray), magnetic resonance imaging (MRI), and sputum cytology are only a few of the methods used to diagnose lung cancer. The majority of these methods, however, are costly and time-consuming. The majority of these methods identify lung cancer in its late stages when the patient's chances of survival are little to none. As a result, a combination of methods for early detection of lung cancer is urgently required. Techniques for image processing offer a useful tool for enhancing manual analysis Reddy and Reddy (2019).
Early detection is critical, but there are a variety of methods for speeding up the process of finding cancer tumors, particularly after the introduction of artificial intelligence methods such as machine learning and relying on methods for extracting strong characteristics using the SURF method, which is a fast and robust algorithm for local, similarity invariant representation and comparison. The primary attraction of the SURF method is its ability to compute operators quickly using box filters, allowing real-time applications such as tracking and object identification, as well as cancer detection Ansari (2019).
In this paper, we will talk about the advantages of the SURF method and how it works, as well as the use of machine learning methods in detecting lung cancer tumors
2. LITERATURE REVIEW
In this paragraph, the scope of research that has been utilized in the detection of lung cancer will be reviewed as described below:
A technique for identifying the presence of abnormalities in a computed tomography (CT) scan image has been proposed to aid in the early identification of lung nodules. Pre-processing, image enhancement, image segmentation, feature extraction, and the neuro-fuzzy algorithm are all important steps in the detection process. The suggested system is a fully automated, fully functional technique that does not need any physical calculations, and it provides a superior outcome with a high accuracy rate has been presented Joshya et al. (2021) .
Create a machine learning model that takes lung-CT images as input and produces a categorized output that detects lung disease. Before being applied to the model, the images are pre-processed, and the watershed transformed. SVM and ML method is used in this application and is successful in terms of specificity, accuracy, and sensitivity. The model's overall accuracy is 65.16 percent. As a result, it can be inferred that if the SVM classifier is trained with big datasets, it may be utilized to identify lung cancer with considerably greater accuracy have been presented Pinjala and Sujana (2021).
The use of CT scans to detect the pathogenic kind of lung cancer is suggested using a new residual neural network. We investigated a medical-to-medical transfer learning method due to the scarcity of CT images in practice. A residual neural network is pre-trained on the public medical image dataset luna16 and then fine-tuned on our intellectual property lung cancer dataset from Shandong Provincial Hospital. Our approach outperforms previous models trained with 2054 labels in detecting pathological kinds of lung cancer from CT scans, with an accuracy rate of 85.71 percent. Our approach outperforms AlexNet, VGG16, and DenseNet in terms of providing a non-invasive pathological diagnostic detection tool that has been presented Wang et al. (2020).
A hybrid method was created by combining the support vector machine with the back-propagation feedback neural network to further decrease the complexity of classification calculation. A total of 500 images were utilized, with 75 percent of the data being used for training and the remaining 25% for classification. In light of the abandonment of the three-block mechanism, a classification is proposed in which the first block performs introductory operations as a data set, the second block extracts features using the SURF technique, followed by optimization with a genetic algorithm, and the final block is intended for classification using FFBPNN. Kernel Attribute Selected Classifier is the name of the hybrid classification method, and its total classification accuracy is 98.08 percent has been presented Pankaj et al. (2020).
Screening for lung cancer is suggested for CT images. It utilizes strong feature-acceleration (SURF) for feature extraction, a genetic algorithm (GA) for feature optimization and back-diffusion feeding (FFBP), and a neural network (NN) for classification. The training mechanism utilizes 200 cancer images and the experimental result of classification sensitivity of 94.7% and an accuracy of 96% has been presented Roy et al. (2019).
Deep residual learning is a method for detecting lung cancer using CT images. Provide a set of preprocessing methods for highlighting cancer-prone lung areas and extracting features using UNet and ResNet models. To estimate the probability of a CT scan being malignant, the feature set is fed through several classifiers, including Random Forest and, XGBoost and the individual predictions are ensembled. On LIDC-IRDI, the accuracy obtained was 84%, surpassing prior attempts that have been presented Bhatia et al. (2019).
Attempts to evaluate the discriminative capacity of a variety of predictors to enhance the efficiency of lung cancer detection through symptoms. Several classifiers are evaluated using a benchmark dataset obtained from the UCI repository, including the SVM, Neural Network, C4.5 Decision Tree, Nave Bayes (NB), and Multi-Layer Perceptron. The performance is compared to two well-known ensembles: Majority Voting and Random Forest. According to performance evaluations, Gradient-boosted Tree outperformed all other individuals as well as ensemble classifiers, achieving 90% accuracy. Faisal et al. (2018).
3. SPEEDED UP ROBUST FEATURES (SURF)
There are two steps to getting a SURF descriptor: First, find the SURF point, and then retrieve the SURF point's descriptor.
3.1. Interest Points at Multiple Scale
The following three stages make up the first step of the SURF algorithm Fidalgo (2011).
·
Laplacian of Gaussian
The blurred image that emerged from the first phase of the proposed system is subjected to this method. Where equations (1) and (2) are used to apply the Gaussian Laplacian. This phase is used to get rid of any undesirable features in the image. Next to the LoG filter approximation on each scale, the difference between the input and smoothed images is utilized in the meter layers. Finally, the local maximum in the region of the LoG scale is computed to identify the points of interest. After determining a spatial scale and hessian matrix, LOG was
used King et al. (2013). Figure 1shown the Laplacian of Gaussian.
|
|
|
Figure 1 Laplacian of Gaussian |
1) Integral
Image
The total of all pixels in I(u,v) in a rectangular area created by (0,0) and (u,v) is represented by the integral image IΣ(u,v) of an image I(u, v) shown in Eq (1) . We may quickly determine the sum of the original image inside the boundaries by using an integrated image that requires assessments in the four corner rectangle angles Dash and Sigappi (2018).
![]()
2) Hessian
matrix
In Hessian matrix approximation, integral images are utilized, which significantly lowers calculation time. Because Hessian matrices have excellent performance and accuracy, the Hessian Matrix H (k,σ) in K at scale is described in Eq. 2: In image I, X= (u, v) is a specified point in an original image.
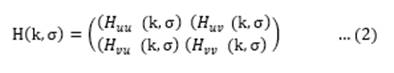
where Huu (k,σ)), etc. is the convolution of the
second-order derivative of Gaussian with the image I(u,v) at the point u. as
shown in Figure 2
|
|
|
Figure 2 derivation gaussian of u and v |
In blob response maps, the lowest level (with the greatest spatial resolution) is represented by a box filter with dimensions of 9x9, which represents a Gaussian with σ=1.2. The terms Duu, Dvv, and Duv will be used to refer to them. For computational efficiency, the weights applied to rectangular areas are kept simple Gupta et al. (2021). may be used in Eq.3 to estimate the determinant of a hessian.
![]()
3) Scale-Space
Representation
Since searching for correspondence often requires comparing images as they are presented at different scales, the locations of points of interest can be located at different stages. Among the detection methods of another feature, space is often seen as a pyramid of images. The images are smoothed several times with a Gaussian filter, after which, the sub-sample is obtained for the next higher level of the pyramid. Therefore, several floors or stairs of different sizes are calculated for the visors
![]()
The scale space is split up into octaves, where Octave is used about a series of response maps that cover double the scale. In SURF, the minimum standard of the scale space is obtained from the output of the 9x9 filter. Thus, in the SURF method scale spaces are implemented by the application of multi-sized square filters. This is different from other methods. As such, the size is analyzed by expanding the size of the filter instead of shrinking the image repeatedly. The output of the 9 × 9 filter mentioned above is the primary scale layer on the s = 1.2 scale (in correspondence with the Gaussian derivatives with σ = 1.2). These layers are acquired by gradually filtering the image with larger masks and take separate accounts of the nature of the merged images and the structure of the selected filter. This results in 9 × 9, 15 × 15, 21 × 21, 27 × 27, ... non-parametric suppression is applied in a 3 × 3 × 3 neighborhood to localize the points of interest in the image and on the scales. Scale-space in the SURF algorithm is analyzed by up-scaling the filter size instead of iteratively reducing the size of an image Kaur and Pratham (2021) as shown in Figure 3
|
|
|
Figure 3 SURF utilizing different filter
sizes of the original image unchanged |
3.2. Localization Key Point
Eliminates key points with low contrast or that are
poorly localized on an edge. Taylor expansion is used to exclude candidate
locations with poor contrast. If the results of applying this equation are less
than a certain threshold, the key point from the candidate point will be
discarded. The Hessian matrix, if the value is less than a particular
threshold, is reserved as one of the candidate points to filter out the
unstable point with strong reactions along edges. As a result, the unsteady
item with strong edge reactions will be eliminated. The goal of this step is to
get rid of low contrast spots, such as those around the margins Oyallon
and Julien (2015).
3.3. Assigning the Orientation
The goal of this phase is to give the important points in the image a consistent orientation based on local image characteristics. The gradient magnitudes of the sample points within the region around the key point are used to build an orientation histogram. Rotation stability can only be achieved by locating the focal point's orientation.Within the circular area surrounding the radius of the point of interest, the responses of the Haar wavelet in both -u and -v the directions are calculated where the point in focus’ scale is located. The responses found with the Gaussian function are weighted around the point in focus, then are plotted as dots in a 2D area, where the horizontal and vertical responses lie in the abscissa and ordinate respectfully. An estimate for the most prominent trend is found by working out the total of all answers in a sliding orientation window of magnitude π/3. Responses in both directions are summarized inside this area. Next, the summary questionnaires produce a direction vector locally. The longer the vector generally determines the direction of the point in focus. The size of the aforementioned sliding window must be selected with caution as it plays a key role in whether a desirable balance between the durability and the angular resolution will be struck Sykora et al. (2014) as shown in Figure 4
|
|
|
Figure 4 Assigning the Orientation |
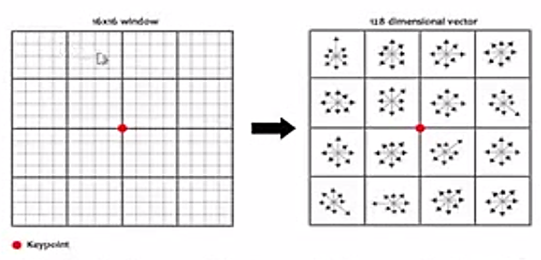
3.4. Descriptor key point
For the local image region, a keypoint description is generated that is as distinct as feasible for each of the potential key points. Around this time, the gradient and magnitude are sampled. Those data are sampled in the area around the keypoint. The coordinates and magnitude are rotated relative to the keypoints orientation to ensure orientation invariance. The Haar wavelet responses are extracted at 5x5 sample point space regularly after the space of interest is split up into tiny sub-regions, in this instance of size 4x4 and for every other one as well. For each sub-region, add the responses for du and dv individually. Extract the total of the absolute value of the answers as well to get information on the polarity of the intensity changes. Size of feature vector: 4 x 16 = 64 Sharma et al. (2020). As seen in Figure 5
|
|
|
Figure 5 Keypoint descriptor |
4. K-NEAREST NEIGHBORS (KNN)
The KNN classifier is a case-based MLA that uses a similarity or distance function for distinct pairings of observations, comparable to the Euclidean distance function. Because of its efficiency, ease of implementation, and non-parametric features, this classifier is used in a wide range of applications. Furthermore, the classification time using this method is very lengthy, and obtaining the optimum K value is difficult. In general, the best alternative of k should be chosen based on the facts. The noise impact on classification is also reduced by using larger values of k, although the borders between classes become less clear. A preferred 'k' may be determined by using several heuristic methods. Instead of employing a fixed value for all classes, the traditional KNN with different K values for various classes must be adjusted to overcome the aforementioned drawbacks. The algorithm of KNN is utilized for classifying instances depending on the closest training examples in the space of the frame. This algorithm is named the slow learning algorithm since its work is approximately locally, and the calculations are delayed till classification. A greater part of instances is utilized in the process of classification. The object is classified into the specific class that possesses the largest number of closest instances.
|
|
|
Figure 6 An instance for KNN |
In Figure 6 The red triangles or blue squares classes must be assigned to the green circle (test case). When k = three (circle with continuous line), the green circle (test object) is classified as a red triangle because two triangle instances and one square instance are available inside the green circle (test object). When k = five (circle with disconnected line), the green circle (test object) is classified into the class of blue squares because three blue squares and two red triangles instances are available inside the green circle (test object). Khorshid et al. (2021). Figure 7depicts the steps of a K-NN algorithm.
|
|
|
Figure 7 KNN Algorithm Steps |
5. METHODOLOGY
The proposed system includes two basic phases, a training phase, and a testing phase, and each of these two phases includes several steps where pre-processing of lung cancer models is applied and the ROI portion of the cancer is extracted and stored in the database. Then the SURF algorithm is applied to extract the powerful feature from the image, and the goal of this algorithm is similar to the SIFT algorithm, to reduce the processing time, which helps in improving detection and matching speed.
|
|
|
Figure 8 proposal
system of lung cancer |
1) Dataset
This data set consists of CT and PET-CT DICOM images of lung cancer topics with XML suspension files indicating the location of the tumor with surrounding squares. Retrospective images were obtained from patients suspected of lung cancer, who underwent standard lung biopsy care and positron emission tomography/CT scan. Subjects were compiled according to histological diagnosis. Patients with names/IDs containing the letter "A" were diagnosed with adenoma, "B" small cell cancer, "E" for large cell carcinoma, and "G" for squamous cell carcinoma. In this research, the loss is made to determine whether a person has lung cancer or not. Figure 9 showed a sample of lung cancer.
|
|
|
Figure 9 A sample of lung cancer |
2) Pre-processing
stage
It is common knowledge that the most essential image processing processes cannot begin before pre-processing is completed. It aims to improve the target image such that further processing yields better results. The following are the preprocessing procedures done on the models at this point: Convert the image from the original to HSV in the database's storage.
·
Convert Original Image into HSV Image
This stage involves converting the color image of lung cancer into an HSV image. Because the color image of lung cancer includes a lot of data that may or may not be needed to process the image. Because when we convert the color image of lung cancer to HSV, you lose a lot of information that is not necessary for processing, so the image will be improved in terms of detail perception in the models by focusing on the brightness factor, making it more accurate and specific than the standard HSV. The equations below are used to convert the original image to HSV.

![]()
![]()
![]()
![]()
Where: -
Min: Smaller value between R, G, and B
Max: larger value between R, G, and B
R: Red value. G: Green value. B: Blue value
·
Cutting of RoI of Lung Cancer
After the color image processing, we need to extract the important part of the lung image taken by computed tomography CT scan, where the lung cancer part is cut and stored, and it can be used in the process of matching the part with computed tomography using machine learning.
3) Strong
Interest Point of SURF Algorithm
SURF interest Point Detection and point features have included feature information. We choose the strongest features by paying attention to certain criteria and a specific threshold, and then we return all characteristics that reflect the strongest aspects of our item of interest and the original image. Following that, feature descriptors, also known as data carrier features, are retrieved from pixels around a point of interest. Pixels are characteristics that are defined by the location of a single point. Finally, this defines the center position of neighborhood pixels, from which we get the strongest descriptor. Because of the download information that may be recognized and identified, Poi’s lung cancer representation points are termed. Finally, the original image is matched with a character from the first batch of lung cancer photos. The phase of matching returns indications for features that are compatible with the feature set of two.
4) Machine
Learning using KNN
Lung cancer is classified using a representative classifier based on the "K" distance. KNN is a supervised learning technique in which the new instance classifies itself based on the training samples that are closest in the feature space. With no model for the test dataset, the new instance is mapped to the class that is extremely frequent among the K neighbors. Weighted KNN is utilized in this system, and the distance is computed using Euclidean distance. In addition, K is the number of neighbors. Computing the distance using KNN from the query to each of the single points in the SURF result key points and returning the closest one will result in rejecting certain points that are deemed distant from a group of key points. This works well because, to achieve the reliable matching, valid matches must have a neighbor that is much closer than the closest invalid match. As a result, in his application, he discards any match with a distance ratio greater than 0.8.
6. EXPERIMENTAL RESULTS
The results acquired throughout the process of detecting lung cancer are described in this section. The first stage represented the image that was being pre-processed. This is a critical step in which the original image is converted to grayscale and the ROI is extracted as shown in Figure 10. Figure 11 Following the pre-processing stage, feature descriptors were extracted at the interest locations in both images, and a descriptor was calculated based on the areas cantered around the identified features. As illustrated in Figure 12 this entails transforming a local pixel neighborhood into a compact vector representation that enables comparison across neighborhoods independent of changes in the lung cancer orientation or size. The KNN calculates the transformation of matched points, thus eliminating outliers. This transformation allows it possible to find the item in the scene of the CT scan, as shown in Figure 13
Figure 14 shown the sample of lung cancer using surf and shown the key point of each image
|
|
|
Figure 10 HSV
image |
|
|
|
Figure 11 Region
of Interest Image |
|
|
|
Figure 12 Feature extraction using SURF algorithm |
|
|
|
Figure 13 Machine
Learning using KNN |
|
|
|
Figure 14 The sample of the key point of
each lung cancer image |
7. EVALUATION OF LUNG CANCER
The proposed system is applied to a data set used, where 70 of the system were trained and 30 of them were tested. On this basis, the accuracy of the system was calculated, and the result is discussed after using a group of samples affected by cancer and others. The results are based on the browsing algorithm and KNN, with an accuracy of 98%. The accuracy and sensitivity of the system are calculated according to the following equations (10) (11). Table 1 shown the accuracy of the proposal system
ACC = (TP + TN)/ (TP + TN + FN + FP) = (TP + TN)/ (P + N) (10)
SN =TP/ (TP + FN) =TP/P (11)
|
Table 1 Accuracy of proposal system |
|||
|
Class |
Samples |
Accuracy |
|
|
Class1 |
100 |
0.96 |
0.98 |
|
Class2 |
100 |
0.97 |
0.99 |
|
Class3 |
100 |
0.95 |
0.99 |
|
Class4 |
100 |
0.98 |
0.98 |
|
Class5 |
100 |
0.92 |
0.98 |
|
Class6 |
100 |
99% |
99% |
|
Class7 |
100 |
95% |
98% |
|
Class8 |
100 |
96% |
99% |
|
overall |
96% |
99% |
|
Finally, the collected findings show that the suggested model is efficient in the identification of brain cancer. Following that, the acquired findings were compared to previous work, and our suggested model came out on top with an accuracy of 99 percent and a sensitivity of 96 percent, as shown in the table below (3).
|
Table 2 Comparison proposal system vs related work |
||||
|
Authors |
Years |
Dataset |
Techniques |
Accuracy |
|
Joshya,
Y. Camy, et al. (2021) |
2021 |
CT scan |
Neuro-Fuzzy Algorithm |
71.05% |
|
Pinjala, Jahnavi, and Sujana Hanumara (2021) |
2021 |
CT scan |
SVM |
65.16% |
|
Wang,
Shudong, et al. (2020) |
2020 |
CT scan |
Residual Neural Network (RNN) |
85.71% |
|
Nanglia et al. (2020) |
2020 |
CT scan |
FFBPNN |
98.08% |
|
Roy et al., (2019) |
2019 |
CT scan |
SURF, GA, FFBP, NN |
96% |
|
Bhatia et al. (2019) |
2019 |
CT scan |
Random Forest and Majority Voting |
84% |
|
Faisal
et al. (2018) |
2018 |
CT scan |
Random Forest, RNN |
90% |
|
Proposal system |
2021 |
CT scan |
SURF and KNN |
99% |
8. CONCLUSION
The SURF method and K nearest neighbor are used to identify and recognize lung cancer in the scene in this paper, and the lung cancer detection performance is enhanced by picking the strongest neighbor. The descriptor's characteristics, as well as our recommended approach the result data set relating to lung cancer in the image was computed by applying three types of thresholds and accuracy scales that distinguish objects under varying situations of rotation and partial occlusion, orientation, and lighting. When compared to the previously perplexing graph, employing SURF for concordance makes the approach more robust. The algorithm was discovered to be capable of achieving high accuracy with only a few training instances. This demonstrates the robustness of our feature vector representation. Furthermore, in the prototype, the use of lower thresholds during the filtering of SURF points and characteristic network vectors improves the overall algorithm's resistance to spin and partial occlusion changes. To get high accuracy, the test samples are categorized with these Neighbors, and the accuracy is determined for various numbers of K values; hence, the calculation time of K-NN is decreased from the obtained results in this technique. The CT lung images are processed using the MATLAB image processing toolkit, and classifications of these images are performed. Calculate and tabulate the k value, execution time, and accuracy. For doctors, such early diagnosis might be beneficial. Where the precision is 99 percent.
REFERENCES
Ansari, Sadaf. (2019) "A review on SIFT and SURF for underwater image feature detection and matching." 2019 IEEE International Conference on Electrical, Computer and Communication Technologies (ICECCT). Retrieved from https://doi.org/10.1109/ICECCT.2019.8869489
Bergers, G. ; (2021) Fendt, S.M. The metabolism of cancer cells during metastasis. Nat. Rev. Cancer, 21, 162-180. Retrieved from https://doi.org/10.1038/s41568-020-00320-2
Bermúdez, A. ; Arranz-Salas, I. ; Mercado, S. ; López-Villodres, J.A. ; González, V. ; Ríus, F. ; Ortega, M.V. ; Alba, C. ; Hierro, I. ; Bermúdez, D. (2021) Her2-Positive and Microsatellite Instability Status in Gastric Cancer-Clinicopathological Implications. Diagnostics, 11, 944. Retrieved from https://doi.org/10.3390/diagnostics11060944
Bhatia S., Sinha Y., Goel L. (2019) Lung Cancer Detection: A Deep Learning Approach. In : Bansal J., Das K., Nagar A., Deep K., Ojha A. (eds) Soft Computing for Problem Solving. Advances in Intelligent Systems and Computing, vol 817. Springer, Singapore. Retrieved from https://doi.org/10.1007/978-981-13-1595-4_55
Dash, Puspita, and A. N. Sigappi. (2018) "Detection and Classification of Retinal Diseases in Spectral Domain Optical Coherence Tomography Images based on SURF descriptors." 2018 IEEE International Conference on System, Computation, Automation and Networking (ICSCA). IEEE, Retrieved from https://doi.org/10.1109/ICSCAN.2018.8541254
E. G. Fidalgo, (2011) "Experimental Assessment of Different Image Descriptors for Topological Map-Building and Scene Recognition," MSc Computer Science Thesis,
Gupta, Surbhi, Kutub Thakur, and Munish Kumar. (2021) “2D-human face recognition using SIFT and SURF descriptors of face's feature regions." The Visual Computer 37.3: 447-456. Retrieved from https://doi.org/10.1007/s00371-020-01814-8
Huang X., Shan J., (2017) Vaidya V.Lung nodule detection in CT using 3D convolutional neural networks 2017 IEEE 14th International Symposium on Biomedical Imaging (ISBI 2017), IEEE, pp. 379-383. Retrieved from https://doi.org/10.1109/ISBI.2017.7950542
Joshya, Y. Camy, et al. (2021) "Automated Detection of Lung Cancer Based on Neuro Fuzzy Technique." Journal of Physics: Conference Series. Vol. 1979. No. 1. IOP Publishing, Retrieved from https://doi.org/10.1088/1742-6596/1979/1/012021
K. Roy et al., (2019) "A Comparative Study of Lung Cancer detection using supervised neural network," 2019 International Conference on Opto-Electronics and Applied Optics (Optronix), Kolkata, India,, pp. 1-5, 4 Retrieved from https://doi.org/10.1109/OPTRONIX.2019.8862326
Kaur, Parneet, and Pratham Mittal. (2021) "A Comparative Study of LBPH, SIFT and SURF Algorithms for Face Recognition Task.".
Khorshid, Shler Farhad, and Adnan Mohsin Abdulazeez. (2021) "breast cancer diagnosis based on k-nearest neighbors : A review." PalArch's Journal of Archaeology of Egypt/Egyptology 18.4 : 1927-1951 Retrieved from https://archives.palarch.nl/index.php/jae/article/view/6601
Koo, M.M. ; Swann, R. ; McPhail, S. ; Abel, G.A. ; Elliss-Brookes, L. ; Rubin, G.P. ; Lyratzopoulos, G. (2020) Presenting symptoms of cancer and stage at diagnosis: Evidence from a cross-sectional, population-based study. Lancet Oncol., 21, 73-79. Retrieved from https://doi.org/10.1016/S1470-2045(19)30595-9
M. I. Faisal, S. Bashir, Z. S. Khan and F. Hassan Khan, (2018) "An Evaluation of Machine Learning Classifiers and Ensembles for Early Stage Prediction of Lung Cancer," 2018 3rd International Conference on Emerging Trends in Engineering, Sciences and Technology (ICEEST), pp. 1-4, doi : 10.1109/ICEEST.2018.8643311. Retrieved from https://doi.org/10.1109/ICEEST.2018.8643311
M. P. King, M. B. Anstey, and D. A. Vardy, (2013) "Comparison of Feature Detection Techniques for AUV Navigation Along a Trained Route," OCEANS, p. 8,
Nanda N., Kakkar P., (2019) Nagpal S.Computer-aided segmentation of liver lesions in CT scans using cascaded convolutional neural networks and genetically optimized classifier Arab. J. Sci. Eng., 44 (4), pp. 4049-4062. Retrieved from https://doi.org/10.1007/s13369-019-03735-8
Oyallon, Edouard, and Julien Rabin. (2015) "An analysis of the SURF method." Image Processing On Line 5 : 176-218. Retrieved from https://doi.org/10.5201/ipol.2015.69
Pankaj Nanglia, Sumit Kumar, Aparna N. Mahajan, Paramjit Singh, Davinder Rathee, (2020) A hybrid algorithm for lung cancer classification using SVM and Neural Networks,ICT Express, ,. Retrieved from https://doi.org/10.1016/j.icte.2020.06.007
Pinjala, Jahnavi, and Sujana Hanumara. (2021) "LUNG CANCER DETECTION USING SUPPORT VECTOR MACHINE." SPAST Abstracts 1.01. Retrieved from https://spast.org/techrep/article/view/758
Reddy U.J., Reddy B.R.V.R., (2019) Reddy B.E.Recognition of lung cancer using machine learning mechanisms with fuzzy neural networks Trait. Signal, 36 (1), pp. 87-91. Retrieved from https://doi.org/10.18280/ts.360111
Schüz, J. ; Espina, C. (2021) The eleventh hour to enforce rigorous primary cancer prevention. Mol. Oncol., 15, 741. Retrieved from https://doi.org/10.1002/1878-0261.12927
Sharma, Manvinder, et al. (2020) "A novel approach of object detection using point feature matching technique for colored images." Proceedings of ICRIC 2019. Springer, Cham, 561-576. Retrieved from https://doi.org/10.1007/978-3-030-29407-6_40
Sykora, Peter, Patrik Kamencay, and Robert Hudec. (2014) "Comparison of SIFT and SURF methods for use on hand gesture recognition based on depth map." Aasri Procedia 9 : 19-24. Retrieved from https://doi.org/10.1016/j.aasri.2014.09.005
Vaishaw K, et al. (2018) An Innovative Approach for Investigation and Diagnosis of Lung Cancer by Utilizing Average Information Parameters, Elsevier Procedia of Computer Science, ;132 :525. Retrieved from https://doi.org/10.1016/j.procs.2018.05.005
Wang, Shudong, et al. (2020) "Classification of pathological types of lung cancer from CT images by deep residual neural networks with transfer learning strategy." Open Medicine 15.1: 190-197. Retrieved from https://doi.org/10.1515/med-2020-0028
Zhou, W. ; Liu, G. ; Hung, R.J. ; Haycock, P.C. ; Aldrich, M.C. ; Andrew, A.S. ; Arnold, S.M. ; Bickeböller, H. ; Bojesen, S.E. ; Brennan, P. ; et al. (2021) Causal relationships between body mass index, smoking and lung cancer : Univariable and multivariable Mendelian randomization. Int. J. Cancer, 148, 1077-1086. Retrieved from https://doi.org/10.1002/ijc.33292
 This work is licensed under a: Creative Commons Attribution 4.0 International License
© Granthaalayah 2014-2021. All Rights Reserved.