THE INFLUENCE OF SERVICE QUALITY, EXPERIENCE, DESTINATION IMAGE WITH SATISFACTION MEDIATION ON TOURISTS VISITING BATAM CITYGolan Hasan 1 1, 2 Faculty of Economics, University International Batam, Batam
City, Indonesia.
|
|
||
|
|
|||
|
Received 5 November 2021 Accepted 16 December 2021 Published 30 December 2021 Corresponding Author Golan
Hasan, golan.hasan@uib.ac.id DOI 10.29121/granthaalayah.v9.i12.2021.4404 Funding:
This
research received no specific grant from any funding agency in the public,
commercial, or not-for-profit sectors. Copyright:
© 2021
The Author(s). This is an open access article distributed under the terms of
the Creative Commons Attribution License, which permits unrestricted use, distribution,
and reproduction in any medium, provided the original author and source are
credited.
|
ABSTRACT |
|
|
|
This
research aims to analyze the influence of Service Quality, Experience,
Destination Image by mediating Satisfaction on Revisit Intention. according
to the requirements in the number of known populations as many as 2.2 million
people had visited, so based on Krejcie and Morgan tables, the number of
samples that must be needed is 384 respondents. Data that being used in this
research is 384 respondents. The results obtained from Partial Least Square
(PLS) approach for data analysis said that Satisfaction variable has no
significant effect on Destination Image, but Satisfaction has a significant
effect on Service Quality and Experience. Service Quality, Experience,
Destination Image and Satisfaction have a significant effect on Revisit
Intention. |
|
||
|
Keywords: Service
Quality, Experience, Destination Image, Satisfaction, And Revisit Intention. 1. INTRODUCTION Batam City is an
industrial city that has been developed into a tourist city. The changes that
occur are because the industry in Batam City cannot operate as optimally as
possible as in general. Apart from the industrial city, Batam City has made a
decision to change its creative place which is used as a tourist destination.
After being developed, Batam City became a tourism city which was visited by
many foreign tourists. There are several tourist locations that are the
center of tourist visits such as Golden Prawn Batam, Ranoh Island, Abang
Island, Batam Botanical Garden, Mirota Hotel and so on. For tourists who like
tourist attractions that provide seafood, they will tend to visit Ocarina
Park, Fatmawati coffee house, and Mirota hotel. Visits of foreign tourists
not only end at tourist locations, but also culinary delights introduced by
the City of Batam itself so that they get attention and praise from foreign
tourists. At present there has been a problem that has caused the tourism
sector to experience a decrease in tourist visits, both local and non-local,
this problem occurs due to the corona virus outbreak which surged from
November 2019 in Wuhan, China. Even though the plague appeared and largely
affected tourist lines, Batam City maintained its distance and health during
the outbreak. |
|
||
|
Table 1 The number of tourist visits to Batam City during the end of 2019 to the end of 2020 |
||
|
Year |
Month |
Number of tourists
(people) |
|
2019 |
October |
159.292 |
|
2019 |
November |
167.288 |
|
2019 |
December |
190.232 |
|
2020 |
January |
156.752 |
|
2020 |
February |
95.256 |
|
2020 |
March |
No Information
avaible |
|
2020 |
April |
No Information avaible |
|
2020 |
May |
No Information
avaible |
|
2020 |
June |
1.785 |
|
2020 |
July |
1.754 |
|
2020 |
August |
1.505 |
|
2020 |
September |
1.843 |
|
2020 |
October |
1.832 |
|
2020 |
November |
1.627 |
|
Source: BPS (Central Statistics Agency) Batam City |
||
The impact of this epidemic certainly triggers companies and tourists in Batam city; therefore, companies and tourists try to maintain their work. The part that can be done is quality service, the service in question is service to the concern of employees or other workers to the current condition, by ensuring the distance during direct service can be increased again. Quality of service is built as a personal touch for each visitor, providing personalized service to visitors through standard service quality. It was found that service quality and quantity of previous visits had a significant effect on revisit intention. This explains that tourist satisfaction is the factor most relevant to the intention of visiting back in the short and long term Saragih and Taufik (2020) . Intention says, when people have a strong intention to engage in behavior, they prefer to do recreational behavior in the tourism sector, this is taking back tourism services or recreational services or revisiting from destinations or visitors to tourist objects. Reconsideration is defined as an important factor to continue to create profits or company performance in a long-term perspective Purnama and Wardi (2019). After knowing that these three factors have been visualized and have worked with it, it makes tourists or the community plan to revisit tourist sites. The results showed that visitor satisfaction has a positive and significant relationship with the intention to revisit visitors. These results indicate that visitor satisfaction which is determined as the level of conformity between aspirations and experiential reality has an important role in determining the intention of returning visitors. The more visitors are satisfied with the goal, the more possibilities for the visitor; to revisit at a future date. Mujihestia et al. (2018).
2. LITERATURE REVIEW
Service Quality on Revisit Intention
Core product performance occurs with its value. However, service quality performance occurs because of the interaction between customers and employees. Thus, customer and employee interactions play an important role in terms of service quality. Employee good behavior will influence customer opinion and increase satisfaction. Since the level of personal satisfaction has a positive influence on the general consumption experience, it is possible to say that if customers evaluate their experience positively, their intention will be more likely to repurchase Timur (2018). Service quality is a measure and quality improvement to improve service quality that is even better for consumers. Service quality is also a measure of how well the level of service provided is in accordance with the expectations desired by the customer. Service quality is the company's expectation to fulfill its wants and expectations Hasan et al. (2020).
H1: Service quality has a significant positive effect on revisit intention
Service Quality to Satisfaction
Meeting the specific needs of visitors is a major factor in increasing visitor satisfaction and intention to visit again. service quality leads to visitor satisfaction, the nature of service quality is about achieving tourist satisfaction, personnel satisfaction, and organizational goals Peranginangin (2019) Many restaurant operators strive to offer high-quality service that exceeds the expectations of their customers. This is because restaurant owners who provide great service and value are better evaluated by customers. Consumers rate service quality based on different dimensions such as front staff punctuality and courtesy, their responsiveness to special requests, personnel appearance and
willingness to help customers. Thus, a good understanding of the desired service quality is essential for a restaurant to maintain a reliable customer relationship which is essential for business success Banerjee and Singhania (2018) Song et al. (2019).
H2: Service quality has a significant positive effect on satisfaction
Experience for Satisfaction
A consumer-satisfying consumption experience increases the readiness or desire of the individual to engage in favorable consumption behavior. For this reason, service managers always try to satisfy customers to get customer recommendations, develop customer re-visit intentions, and achieve a profitable company. In the context of tourism, research shows that when tourists are satisfied with their specific travel experiences, they tend to spread positive WOM and participate in this type of travel again Meng and Han (2018) . Ethical behavior is a systematic thought process that leads to the desired action and involves a step-by-step procedure that includes obtaining relevant information, assessing its reliability, mapping viable alternatives to action and selecting defensible solutions. individual belief that decisions are made that serve organizational interests or provide personal benefits Chelliah et al. (2019).
H3: Experience has a significant positive effect on satisfaction
Destination Image for Satisfaction
Destination image significantly affects tourist satisfaction. The higher the degree of the destination image will increase tourist visits to the destination. Image greatly affects tourist satisfaction. Image is divided into stereotypical image peculiarities, affective image peculiarities, and uniqueness image uniqueness. This has proven to be an image of a tourist spot that is very much in tune with visitor satisfaction. Image affects tourist satisfaction, the higher the image level, the higher the level of tourist satisfaction Higgins-Desbiolles (2020). Destination images are mental representations of tourists' overall feelings and perceptions of their knowledge of a particular destination. The formation of destination images can differ between first-time and repeat visitors and 'recreational activities' contribute the most to the overall destination image. Tourists are said to make travel decisions based on destination images and it plays an important role in their decision-making process as it is said that destination images lead to emotional bonding of tourists which further affects tourist satisfaction. Abdullah and Lui (2018)
H4: Destination image has no significant effect on satisfaction
Destination Image for Revisit Intention
The goal image is defined not only as an attribute of the goal but also the overall impression displayed by the goal. The concept of drawing goals as an expression of all objective knowledge, prejudice, imagination and emotional thinking of an individual or group about a location. To define an image as the sum of
all beliefs, ideas, and impressions that a person is related to a goal Purnama and Wardi (2019). Satisfaction has become a central concept in marketing theory and practice, and one of the important goals of business activities. Researchers argue that tourist satisfaction has contributed to important aspects to create customer loyalty. Meanwhile, it takes into account that customer satisfaction is an after-purchase evaluation. It is chosen at least by sharing or exceeding customer expectations, while dissatisfaction is experienced if the goals do not meet the customer's expectations. Referring to the experts' definition, it can be concluded that tourist satisfaction comes from the comparison between product performance and experience. If the experience is less than
expected, then they are not satisfied. Conversely, if the experience exceeds their expectations, they are satisfied Permana (2018).
H5: Destination image has a significant positive effect on revisit intention
Satisfaction with Revisit Intention
The intention of visiting returned to goal measurement by visitor satisfaction. Explain that good destination governance will lead to increased visitor satisfaction and, in turn, will influence return visit intentions. The effect of competition on visitor satisfaction will result in loyalty to the goal Peranginangin (2019). The results showed that visitor satisfaction has a positive and significant relationship with the intention to revisit visitors. These results indicate that visitor satisfaction which is determined as the level of conformity between aspirations and experiential reality has an important role in determining the intention of returning visitors. The more visitors are satisfied with the goal, the more possibilities for the visitor; to revisit in the future Mujihestia et al. (2018). Tourist Satisfaction is the result (output) of the natural expanse of the environment and a sense of awe is an important and most anticipated feeling for tourists visiting a place and results in tourists’ satisfaction and quality and emotional values have a positive impact on tourist satisfaction Hasan et al. (2020).
H6: Satisfaction has a significant positive effect on revisit intention
|
|
|
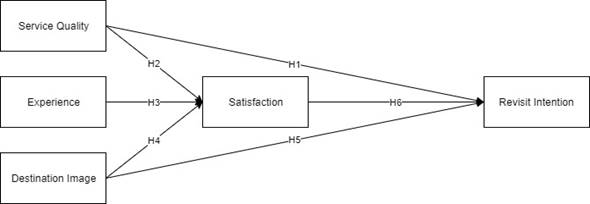
Figure 1 The
Effect of Service Quality, Experience, Destination Image with Satisfaction
Mediation on Tourists Visiting Batam City |
3. RESEARCH METHODS
This research methodology examines structured equation modeling with partial least squares. This study has used an easy sampling approach and an online survey. Researchers can only collect 276 data that have met the requirements as data that can be processed with a digital questionnaire distribution technique, namely the Google Form link, due to the health protocol being implemented in the current pandemic condition, only visitors who complete their journey are asked to participate in this research. A total of 384 questionnaires were given and all of them were returned according to the requirements in the number of known populations as many as 2,210,297 people that has been visiting in 2019 and 2020, so when seen in the Krejcie and Morgan (2019) tables, the number of samples that must be needed is 384 respondents. A total of 384 data were used for data analysis and 9 data were deleted because they did not meet the criteria of the respondent. The final sample size is considered sufficient to produce a stable solution using the Partial Least Square (PLS) approach for data analysis. Objects taken by researchers are tourists who visit Batam city and have had culinary in Batam city. In general, tourists who visit must have had culinary delights, especially in well-known locations such as Fatmawati coffee house beach destinations, Mirota hotels, Golden Prawn Batam, Ranoh Island or other restaurants close to the sea. The samples needed by researchers during this research are foreign tourists as well as local tourists, due to the location of Batam city which is close to Singapore, Malaysia, and other islands adjacent to Batam city.
4. RESULTS AND DISCUSSION
In the study, there were 384 samples obtained from the data of distributing questionnaires to the community in Batam City. Of the 384 questionnaires have been distributed using the google form link and 384 data were retrieved to be processed.
|
Table 2 Characteristics of Respondents |
||
|
Variable |
Amount |
Percent |
|
Gender |
||
|
Male |
176 |
45.8 |
|
Female |
208 |
54.2 |
|
Age |
||
|
18-25 years |
347 |
90.4 |
|
26-35 years |
27 |
7 |
|
36-50 years |
10 |
2.6 |
|
Education |
||
|
High School |
311 |
81 |
|
Bachelor's degree |
65 |
16.9 |
|
Master's degree |
6 |
1.6 |
|
Doctor's degree |
2 |
0.5 |
|
Income per month |
||
|
Above Rp.9.000.000 |
10 |
2.6 |
|
Below Rp.4.000.000 |
102 |
26.6 |
|
Rp.4.000.000- 6.000.000 |
236 |
61.4 |
|
Rp.6.500.000- 9.000.000 |
36 |
9.4 |
|
Traveling Partner |
||
|
Partner |
14 |
3.6 |
|
Family |
194 |
50.5 |
|
Friends |
113 |
29.4 |
|
Alone |
63 |
16.5 |
|
Number of visit |
||
|
2 times |
28 |
7.3 |
|
3 times |
34 |
8.9 |
|
>3 times |
322 |
83.9 |
|
Purpose of visiting |
||
|
Work |
123 |
32 |
|
Study |
95 |
24.7 |
|
Personal traveling |
125 |
32.6 |
|
Others (work while studying) |
41 |
10.7 |
|
Kind of travel |
||
|
Culture |
131 |
34.1 |
|
Nature preserve |
118 |
30.7 |
|
Culinary |
135 |
35.2 |
|
Source: Primary Data Processed (2021) |
||
Based on the processed survey data, the following are the results of the survey from the characteristics of the respondents studied:
1) The results of the majority of female respondents were 208 respondents (54.2%).
2) The results of the majority of respondents aged 18-25 years were 347 respondents (90.4%).
3) The results of the majority of respondent’s high school education and equivalent as many as 311 respondents (81%).
4) The results of the majority of respondents who earn Rp.4,000,000-6,000,000 are 236 respondents (61.4%).
5) The results of the majority of respondents traveling with their families as many as 194 respondents (50.5%).
6) The results of the majority of respondents numbered more than 3 times as many as 322 respondents (83.9%).
7) The results of the majority of respondents that take personal trip goals are 125 respondents (32.6%)
8) The results of the majority of culinary tourism respondents were 135 respondents (35.2%).
Number of questionnaire questions distributed by researchers were obtained from other studies, 10 questions on destination image and satisfaction ((Mujihestia et al., 2018), 9 questions on experience and revisit intention Purnama and Wardi (2019). and 5 questions of service quality Gholipour Soleimani and Einolahzadeh (2018).
5. CMB TEST (COMMON METHOD BIASES)
The CMB test is processed using the IBM SPSS application, problems in the occurrence of CMB can be done if there is an explanation of the variance that is owned has a level above 50%. If the variance value tested is <50%, then it identifies the absence of CMB, then the test carried out does not occur CMB, namely the results obtained are 46%.
6. VALIDITY AND RELIABILITY TEST
Partial Least Square (PLS) approach to data analysis. The validity test is measured using two indicators, namely convergent validity and discriminant validity. Convergent validity was measured using the outer loading of each indicator whose slice value was higher than 0.6. Convergent validity can also be measured by using the Average Variance Extracted (AVE) value where the AVE value for each latent variable must be higher than 0.5. In the Inner Model test, it is declared significant with a significance level of 5% if the processed value meets the requirements of the T-statistics value of more than 1.96 or P-values <0.05.
|
Table 3 Summary of Validity Test Results |
|||
|
Variable |
Indicator |
Loadings |
AVE |
|
Destination Image |
DI1 |
0.614 |
0.576 |
|
DI2 |
0.831 |
||
|
DI3 |
0.778 |
||
|
DI4 |
0.804 |
||
|
DI5 |
0.746 |
||
|
Experience |
EXP1 |
0.676 |
0.571 |
|
EXP2 |
0.771 |
||
|
EXP3 |
0.823 |
||
|
EXP3 |
0.718 |
||
|
EXP4 |
0.781 |
||
|
EXP5 |
0.71 |
||
|
Revisit Intention |
RI1 |
0.757 |
0.587 |
|
RI2 |
0.834 |
||
|
RI3 |
0.758 |
||
|
RI4 |
0.745 |
||
|
Satisfaction |
S1 |
0.754 |
0.562 |
|
S2 |
0.775 |
||
|
S3 |
0.716 |
||
|
S4 |
0.756 |
||
|
S5 |
0.873 |
||
|
Service Quality |
SQ1 |
0.363 |
0.506 |
|
SQ2 |
0.606 |
||
|
SQ3 |
0.746 |
||
|
SQ4 |
0.84 |
||
|
SQ5 |
0.614 |
||
|
Source: Primary Data Processed (2021) |
|||
In the Cronbach's Alpha test with a determination value of more than 0.5, it will be stated as a reliable result and Composite Reliability with a value that exceeds 0.7, it is stated as a reliable result.
|
Table 4 Reliability Test Results |
||
|
Variable |
Composite Reliability |
Cronbach’s Alpha |
|
Destination Image |
0.87 |
0.811 |
|
Experience |
0.869 |
0.81 |
|
Revisit Intention |
0.85 |
0.764 |
|
Satisfaction |
0.865 |
0.805 |
|
Service Quality |
0.826 |
0.728 |
|
Source: Primary Data Processed (2021) |
||
Based on the results, the data that has been tested have results that exceed the determination value, namely 0.7, so that all variables are declared reliable.
7. INNER MODEL TEST (STRUCTURAL MODEL)
Path Coefficients Test
The value of the indirect effect or the relationship under study is significant if the t-statistics value is> 1.96 and the p-value is <0.05. In this study, tests were carried out on the path coefficients and specific indirect effects as follows.
|
Table 5 Summary of Path Coefficients Test Results |
|||
|
Variable |
T-statistics |
P Value |
Explanation |
|
Destination Image -> Revisit Intention |
10.618 |
0 |
Significant |
|
Destination Image -> Satisfaction |
0.842 |
0.4 |
Not Significant |
|
Experience -> Satisfaction |
11.713 |
0 |
Significant |
|
Satisfaction -> Revisit Intention |
7.899 |
0 |
Significant |
|
Service Quality -> Revisit Intention |
2.645 |
0.008 |
Significant |
|
Service Quality -> Satisfaction |
9.507 |
0 |
Significant |
|
Source: Primary Data Processed (2021) |
|||
Hypothesis 1
H1: Service Quality Affects Revisit Intention.
The results of the processed data explain that the Service Quality variable has a significant positive effect on Revisit Intention which can be seen in the T-statistics value of 2.645 which is greater than 1.96 and the P value of 0.008 is less than 0.5. These results concluded that hypothesis 1 (first) can be accepted. This shows that service quality affects a person's opinion and increases trust and satisfaction. With trust and satisfaction that is built, it fosters a sense of desire to visit again, in line with research Timur (2018) and Rahman et al. (2019).
Hypothesis 2
H2: Service Quality Affects Satisfaction.
The results received indicate that the Service Quality variable has a significant positive effect on Satisfaction, which can be seen in the T-statistics value of 9.507 which is greater than 1.96 and the P value of 0.000 is less than 0.5. These results concluded that hypothesis 2 (second) can be accepted. Providing great service and value is better evaluated by customers. Consumers judge service quality based on different dimensions such as punctuality and courtesy of front staff, their responsiveness to special requests, personnel appearance and willingness to help customers, so that good service can give an impression of customer satisfaction with company performance, according to research. Banerjee and Singhania (2018). and lamai et al. (2020).
Hypothesis 3
H3: Experience Affects Satisfaction.
The results of this data explain that the Experiece variable has a significant positive effect on Satisfaction which can be seen in the T-statistics value of 11.713 which is greater than 1.96 and the P value of 0.000 is less than 0.5. These results concluded that hypothesis 3 (third) can be accepted. A consumer-satisfying consumption experience increases the readiness / desire of the individual to engage in favorable consumption behavior. For this reason, service managers always try to satisfy customers to get customer recommendations, develop customer re-visit intentions, and achieve a profitable company. In the context of tourism, research shows that when tourists are satisfied with their specific travel experience and participate in this type of trip again, this is consistent with research Meng and Han (2018). and Chelliah et al. (2019).
Hypothesis 4
H4: Destination Image Affects Satisfaction.
In this test, it has an explanation that the Destination Image variable does not have a significant effect on Satisfaction, which can be seen in the T-statistics value of 0.842 less than 1.96 and the P value of 0.400 more than 0.05. These results concluded that hypothesis 4 (fourth) is rejected. Images really have an important role to play in determining the level of visitor satisfaction. Seven indicators of city image are used in this study: personality suitability, self-reflection, identification from others, social image, city attractiveness, city fun and consistency with self-image including identification of other people, city attractiveness, and indicators of city fun. the highest role so that images of destination destinations that do not match expectations will greatly influence the views of tourists, this study is in contrast to Mujihestia et al. (2018) and Abdullah and Lui (2018).
Hypothesis 5
H5: Destination Image Affects Revisit Intention.
The results of this test explain that the Destination Image variable has a significant positive effect on Revisit Intention which can be seen in the T-statistics value of 10.618 which is greater than 1.96 and the P value of 0,000 is less than 0.5. These results concluded that hypothesis 5 (fifth) can be accepted. The goal image is defined not only as an attribute of the goal but also the overall impression displayed by the goal. The concept of drawing goals as an expression of all the objective knowledge of the prejudice, imagination and emotional thinking of an individual or group about a location. To define image as the sum of all beliefs, ideas, and impressions that a person is related to a goal, this study is in line with Hussein (2016). Collins (2017). ; Purnama and Wardi (2019).
Hypothesis 6
H6: Satisfaction Affects Revisit Intention.
The results of this test explain that the Satisfaction variable has a significant positive effect on Revisit Intention which can be seen in the T-statistics value of 7.899 which is greater than 1.96 and the P value of 0,000 is less than 0.5. These results concluded that hypothesis 6 (sixth) can be accepted. Tourist satisfaction is a positive perception or feeling that is developed or obtained by tourists by engaging in recreational activities and is expressed as the level of pleasure obtained from the experience. Tourist satisfaction is also important for tourism management because it affects the choice of destination. Seekers agree that satisfied travelers tend to say positive things about their destination to others. In order for a country to remain competitive, organizations in the public and private sectors must try to satisfy their customers by meeting their demands, in line with research Abdullah and Lui (2018) and Permana (2018).
|
Table 6 Indirect Effect Test Results |
|||
|
Variable |
T Statistics |
P Value |
Example |
|
Destination Image -> Satisfaction ->
Revisit Intention |
0.82 |
0.413 |
Not Sig |
|
Experience -> Satisfaction -> Revisit
Intention |
5.319 |
0 |
Sig |
|
Service Quality -> Satisfaction ->
Revisit Intention |
7.82 |
0 |
Sig |
|
Source: Primary Data Processed (2021) |
|||
In this test, it shows that the destination image indirectly has an effect on satisfaction with revisit intention of -0,015, this effect is not significant because the t-statistic value <1.96 and p-value> 0.05, namely 0,820 and 0,413. Experience indirectly affects satisfaction with revisit intention of 0,196, this effect is significant because the t-statistic value <1.96 and p-value> 0.05 is 5,319 and 0,000 and service quality indirectly affects satisfaction with revisit intention by 0,151, this effect is significant because the t-statistic value <1.96 and the p-value> 0.05, namely 7,820 and 0,000. So that variable satisfaction with the greatest influence from destination image to experience and the smallest is service quality.
8. R SQUARE TEST
In this method, it is tested to show the suitability of the relationship model between destination image, experience, satisfaction and service quality on revisit intention which has an R square value of 73,9% or in another sense, Revisit Intention is influenced by these four variables with a value of 73,9% and the rest with a value of 26.1%. influenced by other variables that are not in the model. Meanwhile, there is an effect of satisfaction on revisit intention of 73,5% and the rest of the other percentages are influenced by other variables.
|
Table 7 R Square Adjusted |
|
|
Variable |
R Square Adjusted |
|
Revisit Intention |
0.739 |
|
Satisfaction |
0.735 |
|
Source: Primary Data Processed (2021) |
|
9. QUALITY INDEX TEST
In the GoF test measuring the value of the quality index, good results will show that the application of the model in research can be applied (Latan & Noonan, 2017). By using the formula GoF = √Common x R2, where Common is the average of AVE (communalities) and R2 is the average of R square, then the calculation of the GoF test = √0,560 x 0,7372 gives a result of 0,5515202988105 (> 0.36), so that it is stated that this research model is included in the large results group (GoF Large) Ramli et al. (2019). and. Hair et al. (2019).
10. CONCLUSIONS
The results of the research under study it can be concluded that the relationship between service quality and revisit intention has an influence. The results of the research under study it can be concluded that the relationship between service quality on satisfaction has an influence. The results of the research under study it can be concluded that the relationship between experience and satisfaction has an influence. The results of the research under study concluded that the relationship between the destination image on satisfaction had no effect. The results of the research under study can be concluded that the relationship between destination images on revisit intention has an influence. The results of this study concluded that the relationship between satisfaction with revisit intention has an influence. In this study, it focuses more on the revisit intention of tourists who go on a culinary tour, where revisit intention still has many categories to choose from. Researchers only choose 4 types of factors that can influence revisit intention, namely, service quality, satisfaction, experience and destination image. Researchers did not cover all tourism activities in the city of Batam, researchers only chose cultural, culinary and nature reserves in the study.
The next researcher chooses other tourism categories outside of cultural tourism, culinary, nature reserves and is analyzed in more detail about tourism that affects the revisit intention of tourists to Batam city. The next researcher is recommended to add independent variables outside those used by researchers such as perceived value, word-of-mouth and promotion which are likely to have an influence on the revisit intention of tourists who have a culinary tour in the city of Batam. Perceived value variable has a significant effect on revisit intention. Consumers' perceived value is critical to their purchasing decisions. PV focuses on “the consumer's overall assessment of the utility of a particular product based on a viewpoint of what is received and what is given. The word-of-mouth variable has a significant effect on revisit intention. The relationship between customers and consumers' willingness to engage by word of mouth was stronger when behavior and attitude loyalty were considered than when only behavioral loyalty was considered. Has demonstrated a positive relationship between affective commitment and customer word of mouth behavior. Furthermore, research has stated that WOM (word-of-mouth) is a major role in the process of shaping consumer behavior. The promotion variable has a significant influence on revisit intention. Promotion is recognized by many as an important element in tourism marketing. To truly understand the real efficiency of promotional activities in terms of evaluating tourists on their satisfaction and loyalty to a tourist destination.
REFERENCES
Abdullah, S. I. N. W., & Lui, E. (2018). Satisfaction Drivers and Revisit Intention of International Tourists in Malaysia. Journal of Tourism, Hospitality and Environment Management. Retrieved from https://www.researchgate.net/profile/Nurdiana-Wong/publication/326111044_SATISFACTION_DRIVERS_AND_REVISIT_INTENTION_OF_INTERNATIONAL_TOURISTS_IN_MALAYSIA/links/5b399f6a4585150d23ee0e7f/SATISFACTION-DRIVERS-AND-REVISIT-INTENTION-OF-INTERNATIONAL-TOURISTS-IN-MALAYSIA.pdf
Banerjee, S., & Singhania, S. (2018). Determinants of Customer Satisfaction, Revisit Intentions and Word Of Mouth in the Restaurant Industry-Study Conducted In Selective Outlets of South Kolkata. In International Journal of Business and Management Invention (IJBMI) ISSN.
Chelliah, S., Khan, M. J., Krishnan, T., Kamarulzaman, M. E. B. M., & Goh, N. E. (2019). Factors influencing satisfaction and revisit intention among international exchange students in Malaysia. Journal of International Education in Business. Retrieved from https://doi.org/10.1108/JIEB-07-2018-0026
Collins, R. L. (2017). Sound, Space and Bodies : Building Relations in the Work of Invisible Flock and Atelier Bildraum. M/C Journal. Retrieved from https://doi.org/10.5204/mcj.1222
Gholipour Soleimani, A., & Einolahzadeh, H. (2018). The influence of service quality on revisit intention : The mediating role of WOM and satisfaction (Case study: Guilan travel agencies). Cogent Social Sciences, 4(1), 1-14. Retrieved from https://doi.org/10.1080/23311886.2018.1560651
Hair, J. F., Risher, J. J., Sarstedt, M., & Ringle, C. M. (2019). When to use and how to report the results of PLS-SEM. In European Business Review. Retrieved from https://doi.org/10.1108/EBR-11-2018-0203
Hasan, G., Jasfar, F., & Kristaung, R. (2020). Effect of Develop Strategy, Ethical Climate, on Quality Service to Customer Experience With Local Wisdom as a Moderating Variable. Retrieved from https://doi.org/10.2991/aebmr.k.200915.018
Higgins-Desbiolles, F. (2020). The "war over tourism": challenges to sustainable tourism in the tourism academy after COVID-19. Journal of Sustainable Tourism. Retrieved from https://doi.org/10.1080/09669582.2020.1803334
Hussein, A. S. (2016). How Event Awareness, Event Quality and Event Image Creates Visitor Revisit Intention ? A Lesson from Car free Day Event. Procedia Economics and Finance. Retrieved from https://doi.org/10.1016/S2212-5671(16)00049-6
LAMAI, G. H., THAVORN, J., KLONGTHONG, W., & NGAMKROECKJOTI, C. (2020). Critical Factors Influencing Revisit Intention of Large Restaurant Chains in Myanmar. Journal of Distribution Science. Retrieved from https://doi.org/10.15722/jds.18.12.202012.31
Meng, B., & Han, H. (2018). Working-holiday tourism attributes and satisfaction in forming word-of-mouth and revisit intentions : Impact of quantity and quality of intergroup contact. Journal of Destination Marketing and Management. Retrieved from https://doi.org/10.1016/j.jdmm.2018.03.009
Mujihestia, T. I., Troena, E. A., & Hussein, A. S. (2018). THE ROLE OF CITY IMAGE AND VISITORS' SATISFACTION ON VISITORS' REVISIT INTENTION : A STUDY IN AN ENCLAVE CITY. JURNAL APLIKASI MANAJEMEN. Retrieved from https://doi.org/10.21776/ub.jam.2018.016.02.14
Peranginangin, J. (2019). Antecedents of revisited intention : Evidence from Indonesia zoo tourism. Contaduria y Administracion. Retrieved from https://doi.org/10.22201/fca.24488410e.2018.1518
Permana, D. (2018). Tourist's re-visit intention from perspective of value perception, destination image and satisfaction. European Research Studies Journal. Retrieved from https://doi.org/10.35808/ersj/1058
Purnama, W., & Wardi, Y. (2019). The Influence of Destination Image, Tourists Satisfaction, and Tourists Experience toward Revisit Intention to The Most Beautiful Village in The World (Nagari Tuo Pariangan). Jurnal Kajian Manajemen Dan Wirausaha.
Rahman, R., Suryawardani, I. G. A. O., & Wiranatha, A. S. (2019). The Influence of Services' Quality on Intention to Revisit through Mediation of Satisfaction of Visitors at Sasak Sade Village, Central Lombok, West Nusa Tenggara. E-Journal of Tourism. Retrieved from https://doi.org/10.24922/eot.v6i2.53751
Ramli, N. A., Latan, H., & Solovida, G. T. (2019). Determinants of capital structure and firm financial performance-A PLS-SEM approach: Evidence from Malaysia and Indonesia. Quarterly Review of Economics and Finance. Retrieved from https://doi.org/10.1016/j.qref.2018.07.001
Saragih, M. G., & Taufik, A. (2020). The Effect Of Destination Images On Tourist Loyalty With Satisfaction As Mediation. International Journal of Advanced Science and Technology.
Song, M., Lee, W. S., & Moon, J. (2019). Determinants of satisfaction and revisit intention for fast food restaurant customers. Journal of Tourism and Leisure Research. Retrieved from https://doi.org/10.31336/JTLR.2019.1.31.1.327
Timur, B. (2018). Service Quality, Destination Image and Revisit Intention Relationships at Thermal Tourism Businesses. Journal of Gastronomy Hospitality and Travel (JOGHAT), 1(1), 38-48. Retrieved from https://doi.org/10.33083/joghat.2018.3
 This work is licensed under a: Creative Commons Attribution 4.0 International License
© Granthaalayah 2014-2021. All Rights Reserved.