MORBIDITY PATTERN OF HOSPITALIZATION AND ASSOCIATED OUT OF POCKET EXPENDITURE: EVIDENCE FROM NSSO (2017-2018)Amiya Saha 1 1 Ph.D. Scholar, Department of Family & Generations, International Institute for Population Sciences, Mumbai, Maharashtra, India.2 Assistant Professor, Department of Family & Generations, International Institute for Population Sciences, Mumbai, Maharashtra, India. |
|
||
|
|
|||
|
Received 18 October 2021 Accepted 2 November 2021 Published 30 November 2021 Corresponding Author Amiya
Saha, amiyasaha4444@gmail.com DOI 10.29121/granthaalayah.v9.i11.2021.4401 Funding:
This
research received no specific grant from any funding agency in the public,
commercial, or not-for-profit sectors. Copyright:
© 2021
The Author(s). This is an open access article distributed under the terms of
the Creative Commons Attribution License, which permits unrestricted use, distribution,
and reproduction in any medium, provided the original author and source are
credited.
|
ABSTRACT |
|
|
|
In
2018, according to the National Sample Survey Report, the number of cases of
hospitalization per 1000 persons in 365 days was 29 in India (26 per 1000 in
rural and 34 per 1000 in urban areas). The increase in access to healthcare
has also brought with it a massive spike in costs. India is rapidly
undergoing an epidemiological transition with a sudden change in the disease
profile of its population. This study aimed to analyze hospitalization due to
different factors like age and morbidity and its effect on health care
utilization from nationally representative data from 2018 among the total
population of India. 75th round of
National Sample Survey Organisation (NSSO) conducted in July 2017- June 2018
has been used to examine what are the determinant factors that affect the
hospitalization and mean monthly disease-specific expenditure in the
different age group populations in India. We have used cross-tabulation to
understand the association between morbidity patterns and healthcare
utilization with other socio-demographic variables. A set of logistic
regression analyses was carried out to understand the role of age patterns on
hospitalization. A log-linear regression model was used to understand the
significant predictors of out-of-pocket expenditure (OOPE). The study finds
that there is a highest percentage of hospitalization in case of
non-communicable morbidity than the other morbidity for all age groups. Out
of all the respondents 52.2% male and 50.9% female took admission in public
hospitals to get rid from asthma. In private hospitals 45% male and 46.04%
female took admission for this same reason. A positive coefficient indicates
that as the value of the independent variable increases, the mean of the
dependent variable also tends to increase. A negative coefficient suggests
that as the independent variable increases, the dependent variable tends to
decrease. |
|
||
|
Keywords: Morbidity,
Health Care Utilization, Out of Pocket Expenditure 1. INTRODUCTION The improvement in life
expectancy in India has not been matched by the improvements in levels of
health of the population Hospital care is an important aspect of any health
system, especially regarding the treatment of the more vulnerable morbidity
among the total population. Monitoring change in hospitalization rates is
important to highlight the necessity for health policies to allocate
resources and services to respond to the diverse healthcare needs of
different segments of the population. Studies in India have analyzed
hospitalization, but they are restricted in their approach and lack
comprehensive assessment of rate over time. The purpose of this study was to
analyze the |
|
||
determinant factors that affect the multiple hospitalization and mean monthly disease-specific expenditure in the different age groups from nationally representative data in 2018 of India and for various disease groups. Hospital care is an important aspect of any health system, especially regarding the factors that affect the multiple hospitalizations in India.
Monitoring change in hospitalization rates is important to highlight the necessity for health policies to allocate resources and services to respond to the diverse healthcare needs of different segments of the population. The data on hospitalization can be considered relatively free from biases of underreporting of ailments that do not require hospitalization. In addition, the study explores the pattern of the disease profile of the population.
In this era, healthcare facilities have improved greatly, which has increased the life expectancy of humanity, but all these costs and so the role of economic evaluations of healthcare interventions has become increasingly important, especially in developing countries like India.
In 2018, according to the National Sample Survey Report, the number of cases of hospitalization per 1000 persons in 365 days is 29 in India (26 per 1000 in rural and 34 per 1000 in urban areas). Most of these hospitalizations are for infections, but a significant number also for treatment for cancer and blood-related morbidity. The increase in access to healthcare has also brought with it a massive spike in costs. Between 2004 and 2014, for example, the average medical expenditure per hospitalization for urban patients increased by about 176%, and for rural patients, it jumped by a little over 160%.
The review of literature was conducted through database report and manual searches of published research reports, books and research papers. The key words used were age and disease as the determinant hospitalizations and its association with mean monthly expenditure among the total population of India.
A study was conducted to examine the trends of disease and age pattern of hospitalization and associated costs in India during 1995–2014 for selected morbidity and in four broad categories: communicable morbidity, non-communicable morbidity (NCDs), injuries and others. The authors found that there has been more than twofold increase in hospitalization rates in India during the last two decades, and significantly higher rates were observed among infants and older adults and for these reasons healthcare costs in India is rising. Kastor and Mohanty (2018)
There is also another cross-sectional survey among hospitalized BPL families in the beneficiaries and non-beneficiaries’ groups to compare the proportion incurring OOPE and its extent during hospitalization, pre/post-hospitalization periods in different domains. The authors found that proportion of non-beneficiaries who incurred OOPE was higher than the beneficiaries but it was not statistically significant. They also said that non-beneficiary status was significantly associated with OOPE above median independently and also after adjusting for various covariates. Gupt et al. (2016)
Another study was conducted for investigating the socioeconomic differentials in the impact of out-of-pocket-health-expenditure (OOPHE) on impoverishment in China and India using Multivariate analysis. The authors found that lower wealth status and inpatient, as well as outpatient care, increase the odds of falling below the poverty line significantly (with the extent much higher in the case of inpatient care) due to OOPHE in both China and India. Kumar et al. (2015)
Government of India and National health policy draft. 2014 gives some evidence that suggests that the health care cost in India has become more impoverishing than ever before, and almost all hospitalizations, even in public facilities, lead to catastrophic health expenditures.
Another research was conducted to examine the gender difference in HCE in the short-term and major morbidity in India, and understand the role of factors underlying the difference. Using IHDS data they calculate morbidity prevalence rate and mean HCE by gender, and examine the adjusted effect of gender on major morbidity-related HCE by using a two-part regression model and performed Oaxaca-Blinder decomposition of the gender gap in HCE in major morbidity to understand the contribution of demographic and socioeconomic factors. The authors found that Indians spend less on female health care than on male health care. Most of the gender gap in HCE is not due to differential distribution of factors affecting HCE. Rajaratnam et al. (2010)
A study was done aimed to estimate worldwide mortality in men and women aged 15-59 years. The researchers compiled a database of 3889 measurements of adult mortality for 187 countries from 1970 to 2010 using vital registration data and census and survey data for deaths in the household corrected for completeness, and sibling history data from surveys corrected for survival bias. They used Gaussian process regression to generate yearly estimates of the probability of death between the ages of 15 years and 60 years for men and women for every country with uncertainty intervals that indicate sampling and non-sampling error. After the analysis they found that the prevention of premature adult death is just as important for global health policy as the improvement of child survival. Routine monitoring of adult mortality should be given much greater emphasis. Kastor and Mohanty (2018)
Another research was done based upon data from the HCUP 2003 Nationwide Inpatient Sample (NIS). The researchers found that compared to non-elderly patients, a larger proportion of hospitalizations among the elderly were admitted through the emergency department and the proportion of elderly patients who died during their hospital stay was five times higher than in-hospital deaths among the non-elderly. Russo and Elixhauser (2006)
Evidence suggests that household health spending in India accounts for 71% of total health spending and is catastrophic to a large number of households. Hospitalization accounts for a large share of medical spending, and the pattern of hospitalization varies across different ages. Besides, the growth rate of household health spending is faster than the growth rate of household economic wellbeing.
2. NEED FOR THE STUDY
India is rapidly undergoing an epidemiological transition with a sudden change in the disease profile of its population. The purpose of this study was to analyse hospitalization due to different factors like age and nature ailment from nationally representative data from 2018 among the total population of India. This study is useful in knowing the scanerio of Hospitalization in India for various morbidity. In this study we ave tried to find out what kind of disease affect the hospitalization in the different age group in India. In the country like India, it is akso important the see how the hospitalization due to different morbidity affect the mean monthly expenditure on individual. In the country like India people are more likely to go to the private care due to poor infrastructure and for this the monthly expenditure due to different morbidity go high day by day. The relevance of our study is to understand how the expenditure due to hospitalization increase because it is very hard to manage for the poor people to afford the monthly expenses. So better helath infrastructure in the government hospital will reduce these expenses accordingly.
Objectives: Objectives of the current study are as follows
1) To assess the age and sex pattern of hospitalization due to broad classification of disease with a special focus on selected non-communicable diseases.
2) To assess the out-of-pocket expenditure and its determinants during hospitalization for selected non-communicable diseases.
3. DATA AND METHODOLOGY
75th round of National Sample Survey Organisation (NSSO) conducted in July 2017- June 2018 has been used to examine what are the determinant factors that affect the hospitalization and mean monthly disease-specific expenditure in the different age group populations in India.
The NSSO was set up in 1950 as a permanent survey organized by the Ministry of Statistics and Program Implementation to collect data on various facets of the Indian economy through nationwide sample surveys in order to assist in socioeconomic planning and policy making. Besides gathering information on its core areas, that is, household consumption and expenditure, the NSSO collects detailed information on the hospitalization of the population from the selected households.
These surveys record the utilization of healthcare for inpatient, with hospitalization episodes in 365 days reference period recorded in detail. Individual-level data were collected for a nationally representative sample of 555,115 in NSS 2017- 2018. Samples with missing values for the independent variables were dropped to do a complete case analysis. In the occupied households that could be interviewed, this study utilizes data from 60,924 numbers of total respondents who have reported hospitalization during 365 days. Schedule 25.0 of the 75th round has detailed information on types of ailments, duration of ailment, healthcare utilisation, hospitalization, source of treatment (public/private) and expenditure incurred by each member of the sampled households on treatment of morbidity/hospitalization.
Description of variables
Outcome variables
The dependent variables used in this study are, percentage of persons hospitalized in the age group of 0 to 80 & above years and the mean monthly costs per hospitalization by public and private hospitals for each specified morbidity and the different age group. The following study focuses the different factors that are associated with the hospitalization and the mean monthly expenditure due to hospitalization.
Exposure variable
The independent variables used in the study are age group (0-1, 1-4, 5-9, 10-19, 20-29, 30-39, 40-49, 50-59, 60-69, 70-79, 80 & above) of the total men and women, place of residence, education of the respondents, place of hospitalization, duration of stay, number times of hospitalization, nature of the ailment, MPCE (Monthly Per Capita Expenditure. Literature suggests that these variables seem to be affecting hospitalization.
Analytical approach
For the study, we have classified the morbidity into four broad categories, namely Communicable disease, non-Communicable disease, Injuries and Other morbidity and five specific non-communicable morbidity i.e, Hypertension, Asthma, Diabetes, Heart disease and Cancer. Injuries include all the accidental injury, road traffic accidents, burns and corrosions, poisoning, intentional self-harm and assault. Other non-communicable diseases include anemia, bleeding disorders, malaria, Goiter, and other morbidities of thyroid, headache, weakness in limb muscles, decreased hearing, cataracts, etc. Communicable morbidity includes fever due to diphtheria, rash, tuberculosis jaundice, diarrhea, undernutrition, worm infection, and skin infection etc. A broad classification of morbidity has been given in the annexure. In this analysis respiratory disease has been computed for child age group in the communicable disease and for adult age group respiratory has been computed as non-communicable morbidity (NCD).
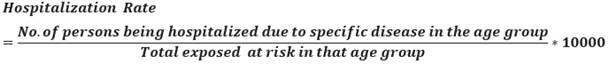
We have taken the hospitalization rate per 10000 people. The hospitalization rate is defined as the number of persons being hospitalized due to a specific disease in the age group among the total exposed population at risk in that age group. Hospitalization rate is expressed per 10000 people.
A set of logistic regression analyses was carried out to understand the role of age pattern on hospitalization. The dependent variables used are hospitalization for specific morbidity with a special focus on selected non-communicable disease and the independent variables used are age group, sex, place of residence (rural-urban), educational attainment and monthly per capita expenditure.
A log linear regression model was used to understand the significant predictors of out-of-pocket expenditure. It is used to assess the effects of dichotomous explanatory variables on a dependent variable. The dependent variable used is log of OOPE and the independent variables are frequently denoted as yes and no. This regression has been used to understand the significant predictors of OOPE. Unstandardized beta (B) coefficient value represents in the anlysis to estimate the effects of predictor variables on dependent variable. This would mean that amount of change in adependent variable due to change of 1 unit of preditor (or independent) variable.
4. RESULTS AND FINDINGS
It is important to study the hospitalization among the total population in terms of age, education, marital status, social groups, wealth quintile, place of residence and different morbidity. The age pattern of hospitalization due to different disease has been shown in the (Table 1). The age ditribution of hospitalization has been estimated from the 75th round of National Sample Survey Organisation data from July 2017 – June 2018.
|
Table 1 Percentage distribution of respondents who were hospitalized during past one year of the survey date by broad classification of morbidity according to age groups |
|||||||||||||||
|
Age
Group |
Total |
Male |
Female |
||||||||||||
|
All
Causes |
Commu- nicable |
NCD |
Injuries |
Other |
All
Causes |
Commu- nicable |
NCD |
Injuries |
Other |
All
Causes |
Commu- nicable |
NCD |
Injuries |
Other |
|
|
0-1 |
5.3 |
62.0 |
13.8 |
1.1 |
23.2 |
6.6 |
62.8 |
12.9 |
1.1 |
23.2 |
3.9 |
64.1 |
13.8 |
1.1 |
21.1 |
|
1-4 |
8.6 |
73.6 |
15.2 |
6.2 |
5.1 |
10.2 |
72.2 |
15.7 |
6.2 |
5.9 |
6.9 |
77.5 |
13.5 |
5.7 |
3.4 |
|
5-9 |
6.8 |
68.0 |
16.2 |
10.4 |
5.4 |
7.9 |
65.9 |
17.1 |
11.8 |
5.2 |
5.5 |
71.9 |
14.4 |
8.2 |
5.5 |
|
10-19 |
8.2 |
57.7 |
20.5 |
15.8 |
6.0 |
9.1 |
56.5 |
18.3 |
20.5 |
4.6 |
7.1 |
60.0 |
23.2 |
8.7 |
8.1 |
|
20-29 |
8.6 |
42.1 |
22.9 |
17.4 |
17.6 |
6.8 |
42.2 |
22.7 |
31.9 |
3.2 |
11.0 |
42.3 |
22.9 |
5.6 |
29.3 |
|
30-39 |
10.0 |
40.3 |
34.3 |
15.4 |
10.0 |
7.4 |
38.3 |
31.5 |
26.6 |
3.6 |
13.7 |
42.3 |
35.8 |
7.0 |
14.9 |
|
40-49 |
16.3 |
36.9 |
44.5 |
12.5 |
6.1 |
15.1 |
33.5 |
42.9 |
19.5 |
4.1 |
17.5 |
40.7 |
44.9 |
6.8 |
7.7 |
|
50-59 |
18.3 |
30.5 |
54.7 |
10.8 |
4.0 |
19.2 |
29.2 |
53.4 |
13.9 |
3.5 |
17.5 |
32.6 |
55.1 |
7.8 |
4.4 |
|
60-69 |
25.7 |
24.4 |
63.4 |
8.1 |
4.1 |
27.2 |
25.0 |
62.7 |
8.9 |
3.4 |
24.0 |
25.3 |
62.5 |
7.7 |
4.5 |
|
70-79 |
33.1 |
23.6 |
65.3 |
7.3 |
3.8 |
36.0 |
25.0 |
63.9 |
7.9 |
3.3 |
29.7 |
23.4 |
64.7 |
7.7 |
4.3 |
|
80+ |
35.5 |
22.3 |
63.1 |
9.6 |
4.9 |
40.6 |
26.0 |
61.7 |
7.7 |
4.6 |
30.6 |
20.8 |
62.0 |
12.8 |
4.4 |
|
All Ages |
12.0 |
40.1 |
40.4 |
11.9 |
7.6 |
11.6 |
40.1 |
38.6 |
16.6 |
4.7 |
12.4 |
41.5 |
40.5 |
7.2 |
10.8 |
|
N |
66,228 |
26,541 |
26,777 |
7,875 |
5,035 |
33,102 |
13,287 |
12,775 |
5,499 |
1,541 |
30,672 |
12,739 |
12,434 |
2,196 |
3,303 |
From the Table 1 it is observed that there is a highest percentage of hospitalization in case of non-communicable morbidity than the other morbidity for all age groups. For the past one-year percentage of communicable and non-communicable morbidity is almost same for all ages. It is seen that highest percentage of children under age five and persons aged 60+ are admitted to the hospital for communicable morbidity and non-communicable morbidity respectively. In case of injuries percentage of infants’ hospitalization is lowest and age group 20 – 29 shows the highest percentage.
|
|
|
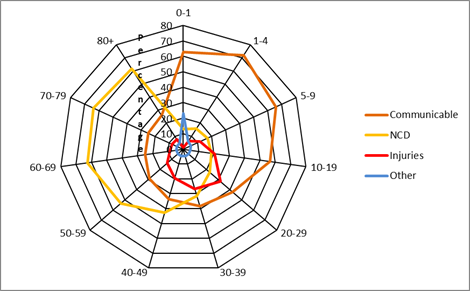
Figure 1 Percentage distribution of male respondents who
were hospitalized due to different morbidity according to age groups |
|
|
|
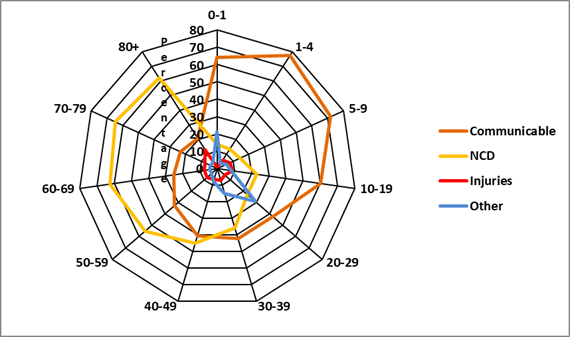
Figure 2 Percentage distribution of
female respondents who were hospitalized due to different morbidity according
to age groups |
Regarding the gender scenario it is quite different as it is seen in the Figure 1 as it shows that in communicable morbidity female percentage is greater than male percentage except 70+ age group due to immunization power. In 50 – 59 age group percentage of hospitalization due to NCD is highest in female than male. Table 1.1 shows that the probability of injury is highest in male than the female irrespective of all age groups.
|
|
|
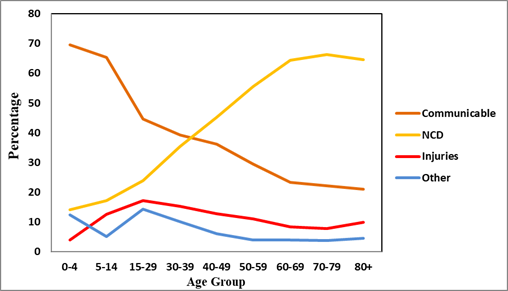
Figure 3 Percentage distribution of
total respondents who were hospitalized due to different morbidity according
to specific age groups |
Figure 3 reveals that there is the highest percentage of hospitalization in case of non-communicable morbidity than the other morbidity for all age groups. In this table we have taken a different age group. The age group has been classified for children and adult popultaion, where for the child age group has been classified into two (0-4 and 5-14) and for adult population we have classified the age group into seven (15-29, 30-39, 40-49, 50-59, 60-69, 70-79 and 80+). For the past one-year percentage of hospitalized patients due to communicable morbidity is in the second position. The highest percentage of children under age five and persons aged 60+ are admitted to the hospital for communicable morbidity and non-communicable morbidity respectively. In case of injuries percentage of infants’ hospitalization is lowest and age group 15 – 29 shows the highest percentage.
|
|
|
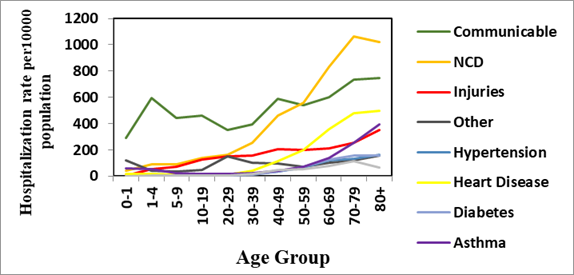
Figure 4 Age pattern of hospitalization
rate in India by different morbidity |
Figure 4 shows that age pattern of hospitalization rate due to communicable morbidity and non-communicable morbidity is highest in 80+ age group and 70 – 79 age group respectively. Due to illness of aged persons hospitalization rate for illness is highest in 80+ age group. Although the patients having hypertension and heart morbidity are mainly shown in 80+ age group. Hospitalization rate due to cancer and diabetes is highest in 70 – 79 age group. Hospitalization due to asthma cases is highest in 80+ age group due to heart related problems and other types of illness.
In Table 2 comparision with gender shows the situation is totally different. In case of communicable morbidity male patients ages 70 and above have highest risk for hospitalization. This scenario is same for injuries and other morbidity. For hypertension, asthma, heart morbidity, diabetes and cancer, hospitalization rate is highest in male patients in 80+ age group. In 0 – 10 age group the hospitalization rate for hypertension, diabetes and cancer is lowest. But in case of asthma the hospitalization rate slightly differs and hospitalization rate is highest in male for this same age group.
|
Table 2 Age pattern of hospitalization rate (per 10000 population) by broad classification of disease, and selected non-communicable morbidity |
||||||||||
|
Age group |
Total |
|||||||||
|
All Causes |
Communicable |
NCD |
Injuries |
Other |
Hypertension |
Heart Disease |
Diabetes |
Asthma |
Cancer |
|
|
0-1 |
534 |
290 |
38 |
6 |
120 |
0 |
17 |
1 |
61 |
1 |
|
1-4 |
855 |
593 |
88 |
52 |
42 |
0 |
18 |
1 |
56 |
5 |
|
5-9 |
675 |
443 |
91 |
70 |
36 |
0 |
8 |
0 |
24 |
2 |
|
10-19 |
815 |
460 |
141 |
129 |
49 |
1 |
10 |
3 |
17 |
5 |
|
20-29 |
860 |
353 |
161 |
150 |
151 |
5 |
13 |
3 |
18 |
7 |
|
30-39 |
1002 |
393 |
254 |
154 |
101 |
14 |
40 |
8 |
24 |
14 |
|
40-49 |
1630 |
589 |
464 |
207 |
98 |
38 |
112 |
33 |
43 |
47 |
|
50-59 |
1833 |
541 |
556 |
201 |
73 |
67 |
198 |
74 |
69 |
55 |
|
60-69 |
2566 |
599 |
830 |
214 |
101 |
122 |
358 |
124 |
139 |
80 |
|
70-79 |
3310 |
734 |
1062 |
257 |
123 |
130 |
478 |
159 |
254 |
113 |
|
80+ |
3551 |
747 |
1021 |
353 |
159 |
161 |
499 |
154 |
393 |
63 |
|
All Ages |
1195 |
465 |
293 |
144 |
91 |
25 |
81 |
25 |
47 |
23 |
|
N |
63,774 |
24,830 |
15,636 |
7,695 |
4,844 |
1,351 |
4,302 |
1,360 |
2,513 |
1,243 |
|
Age group |
Male |
|||||||||
|
All Causes |
Communicable |
NCD |
Injuries |
Other |
Hypertension |
Heart Disease |
Diabetes |
Asthma |
Cancer |
|
|
0-1 |
663 |
349 |
48 |
7 |
154 |
0 |
19 |
1 |
85 |
1 |
|
1-4 |
1017 |
687 |
111 |
63 |
60 |
0 |
19 |
1 |
66 |
10 |
|
5-9 |
785 |
498 |
114 |
92 |
41 |
0 |
9 |
0 |
28 |
2 |
|
10-19 |
907 |
500 |
143 |
186 |
42 |
1 |
9 |
2 |
19 |
5 |
|
20-29 |
676 |
277 |
128 |
216 |
22 |
3 |
11 |
2 |
13 |
4 |
|
30-39 |
735 |
271 |
175 |
196 |
27 |
6 |
29 |
6 |
18 |
8 |
|
40-49 |
1509 |
483 |
403 |
294 |
62 |
29 |
128 |
29 |
46 |
35 |
|
50-59 |
1916 |
537 |
527 |
266 |
67 |
64 |
256 |
76 |
71 |
52 |
|
60-69 |
2723 |
632 |
828 |
242 |
93 |
104 |
452 |
137 |
151 |
82 |
|
70-79 |
3602 |
820 |
1148 |
283 |
119 |
102 |
559 |
167 |
284 |
121 |
|
80+ |
4064 |
929 |
1154 |
313 |
185 |
139 |
646 |
128 |
487 |
82 |
|
All Ages |
1156 |
441 |
266 |
192 |
54 |
20 |
91 |
24 |
49 |
20 |
|
N |
33,102 |
12,616 |
7,608 |
5,499 |
1,541 |
565 |
2,597 |
696 |
1,402 |
578 |
|
Age group/ Sex |
Female |
|||||||||
|
All Causes |
Communicable |
NCD |
Injuries |
Other |
Hypertension |
Heart Disease |
Diabetes |
Asthma |
Cancer |
|
|
0-1 |
393 |
226 |
27 |
4 |
83 |
0 |
15 |
1 |
35 |
1 |
|
1-4 |
688 |
496 |
65 |
39 |
23 |
1 |
17 |
1 |
46 |
1 |
|
5-9 |
552 |
383 |
65 |
45 |
30 |
0 |
6 |
1 |
19 |
3 |
|
10-19 |
707 |
414 |
137 |
61 |
57 |
1 |
12 |
4 |
15 |
5 |
|
20-29 |
1103 |
453 |
205 |
62 |
323 |
7 |
14 |
4 |
26 |
10 |
|
30-39 |
1373 |
562 |
365 |
96 |
204 |
25 |
56 |
10 |
33 |
23 |
|
40-49 |
1753 |
697 |
527 |
119 |
134 |
47 |
95 |
37 |
40 |
59 |
|
50-59 |
1751 |
545 |
584 |
137 |
78 |
70 |
142 |
72 |
66 |
58 |
|
60-69 |
2403 |
565 |
831 |
185 |
109 |
140 |
260 |
110 |
126 |
78 |
|
70-79 |
2972 |
635 |
961 |
228 |
127 |
163 |
385 |
150 |
218 |
105 |
|
80+ |
3056 |
570 |
893 |
392 |
134 |
184 |
357 |
179 |
303 |
45 |
|
All Ages |
1240 |
494 |
325 |
89 |
134 |
32 |
69 |
27 |
45 |
27 |
|
N |
30,672 |
12,214 |
8,028 |
2,196 |
3,303 |
786 |
1,705 |
664 |
1,111 |
665 |
some valuable information has been found from Table 3 on percent distribution of respondents who were admitted to the hospital in one year prior to survey by type of health facilities according to sex. After analyzing we may comment on the private and public hospitals where the respondents admitted for their health problems. It is clearly seen that the maximum persons go to private hospitals than the public hospitals for their treatment just because of huge and extra-ordinary facilities and also for a good environment. Within all the morbidity male persons admitted in private hospitals due to heart morbidity like open heart surgery, valve blockage etc. and female patients admitted in private hospitals due to cancer like breast cancer, skin cancer, throat cancer etc.
|
Table 3 Percent distribution of respondents who were admitted to the hospital in one year prior to survey by type of health facilities according to Sex |
|||||||||
|
All Age Groups |
Total |
Male |
Female |
||||||
|
Public |
Private |
Other |
Public |
Private |
Other |
Public |
Private |
Other |
|
|
All Causes |
46.01 |
51.38 |
2.61 |
44.9 |
52.5 |
2.6 |
47.24 |
50.16 |
2.6 |
|
Communicable |
49.8 |
48.2 |
2.0 |
48.8 |
49.3 |
1.9 |
50.84 |
47.14 |
2.01 |
|
NCD |
41.9 |
54.4 |
3.8 |
41.0 |
55.0 |
4.1 |
42.68 |
53.8 |
3.52 |
|
Injuries |
43.7 |
54.6 |
1.8 |
43.1 |
55.2 |
1.8 |
45.13 |
53.1 |
1.78 |
|
Other |
48.6 |
48.9 |
2.4 |
41.1 |
55.9 |
2.9 |
52.13 |
45.66 |
2.21 |
|
Hypertension |
48.3 |
49.4 |
2.3 |
48.3 |
49.4 |
2.3 |
48.35 |
49.36 |
2.29 |
|
Heart Disease |
39.3 |
57.8 |
2.9 |
38.9 |
58.0 |
3.1 |
39.92 |
57.5 |
2.58 |
|
Diabetes |
42.4 |
54.9 |
2.7 |
43.5 |
54.3 |
2.2 |
41.27 |
55.57 |
3.16 |
|
Asthma |
51.6 |
45.5 |
2.9 |
52.2 |
45.0 |
2.8 |
50.9 |
46.04 |
3.06 |
|
Cancer |
39.6 |
54.6 |
5.8 |
43.4 |
51.0 |
5.5 |
36.24 |
57.74 |
6.02 |
|
N |
29,343 |
32,771 |
1,667 |
14,851 |
17,385 |
869 |
14,492 |
15,386 |
798 |
We are aware of the suicide case in India due to hypertension. Table 3 reveals the information that near about 49.5 percentage of population irrespective of sex admitted in private hospitals to get rid from hypertension. Due to pollution and many other reasons asthma is a common disease now a days. Out of all the respondents 52.2% male and 50.9% female took admission in public hospitals to get rid from asthma. In private hospitals 45% male and 46.04% female took admission for this same reason. So, we may say that peoples also depend on public hospitals because in some of the reputed public hospitals caring facilities of asthma is better than the public hospitals.
Odds of having morbidity have been calculated in the Table 4, we found that people aged 80 and above have higher odds of having hypertension. In case of diabetes there is a 95% probability that the highest odds ratio would be likely to lie in the range 5.27 – 9.23 assuming there is no bias or confounding. 70 – 79 age group has high prevalence of having heart morbidity and cancer than the other age groups. In case of asthma higher odds is found in 80+ aged people and then in infants.
|
Table 4 Results of logistic regression for hospitalization due to broad classification of morbidity, India, 2017-18 |
||||||||
|
Background
Characteristics |
Communicable morbidity |
NCDs |
Injuries |
Others |
||||
|
Odds
Ratio |
CI
(LL-UL) |
Odds
Ratio |
CI
(LL-UL) |
Odds
Ratio |
CI
(LL-UL) |
Odds
Ratio |
CI
(LL-UL) |
|
|
Age group (years) |
|
|
|
|
||||
|
<1 |
1.92*** |
1.71-2.14 |
0.21*** |
0.17-0.25 |
0.05*** |
0.03-0.07 |
3.37*** |
2.89-3.93 |
|
1–4 |
3.58*** |
3.23-3.96 |
0.31*** |
0.27-0.36 |
0.28*** |
0.23-0.33 |
0.55*** |
0.45-0.67 |
|
5–9 |
2.89*** |
2.63-3.16 |
0.48*** |
0.43-0.54 |
0.57*** |
0.50-0.65 |
0.55*** |
0.46-0.66 |
|
10–19 |
2.07*** |
1.93-2.20 |
0.64*** |
0.59-0.68 |
0.89*** |
0.81-0.97 |
0.63*** |
0.55-0.71 |
|
20–29 |
1.09*** |
1.02-1.16 |
0.68*** |
0.63-0.73 |
1.13*** |
1.03-1.23 |
1.98*** |
1.80-2.18 |
|
30–39® |
||||||||
|
40–49 |
0.89*** |
0.83-0.94 |
1.16*** |
1.08-1.24 |
0.77*** |
0.70-0.83 |
0.59*** |
0.53-0.66 |
|
50–59 |
0.66*** |
0.61-0.70 |
1.26*** |
1.17-1.34 |
0.62*** |
0.57-0.68 |
0.40*** |
0.35-0.44 |
|
60–69 |
0.48*** |
0.44-0.51 |
1.37*** |
1.27-1.47 |
0.45*** |
0.40-0.49 |
0.41*** |
0.35-0.46 |
|
70–79 |
0.45*** |
0.41-0.49 |
1.35*** |
1.24-1.47 |
0.41*** |
0.35-0.46 |
0.41*** |
0.34-0.48 |
|
80+ |
0.42*** |
0.36-0.47 |
1.14*** |
1.00-1.29 |
0.55*** |
0.46-0.67 |
0.49*** |
0.37-0.63 |
|
Sex |
||||||||
|
Male® |
||||||||
|
Female |
1.14*** |
1.11-1.18 |
1.14*** |
1.09-1.18 |
0.35*** |
0.33-0.37 |
2.46*** |
2.30-2.63 |
|
Place
of residence |
|
|
|
|
||||
|
Rural® |
||||||||
|
Urban |
1.00 |
0.97-1.04 |
0.94*** |
0.91-0.98 |
0.80*** |
0.76-0.84 |
1.00 |
0.94-1.07 |
|
Education level |
|
|
|
|
||||
|
No
education® |
||||||||
|
Primary |
1.06** |
1.01-1.11 |
0.85*** |
0.80-0.89 |
0.88*** |
0.81-0.94 |
1.12** |
1.01-1.23 |
|
Secondary |
0.96 |
0.91-1.01 |
0.91*** |
0.86-0.95 |
0.97 |
0.90-1.04 |
1.07 |
0.97-1.18 |
|
Higher secondary |
0.97 |
0.91-1.02 |
0.90*** |
0.85-0.96 |
1.03 |
0.94-1.11 |
0.98 |
0.88-1.10 |
|
MPCE |
|
|
|
|
||||
|
Poorest® |
||||||||
|
Poorer |
0.95 |
0.90-1.01 |
0.96 |
0.90-1.02 |
1.03 |
0.95-1.12 |
1.00 |
0.90-1.11 |
|
Middle |
1.01 |
0.95-1.06 |
0.96 |
0.90-1.02 |
0.92 |
0.84-1.00 |
0.95 |
0.86-1.05 |
|
Richer |
0.99 |
0.94-1.05 |
0.98 |
0.92-1.04 |
0.92** |
0.84-0.99 |
0.93 |
0.84-1.03 |
|
Richest |
1.01 |
0.96-1.06 |
0.91*** |
0.86-0.96 |
0.86*** |
0.80-0.93 |
0.94 |
0.85-1.04 |
|
Constant |
0.60*** |
0.56-0.65 |
0.37*** |
0.34-0.40 |
0.37*** |
0.33-0.40 |
0.06** |
0.05-0.07 |
|
® is a reference
category
Significance Level: ≤ .01 = ***, ≤.05 = **, ≤ .1 = * |
||||||||
It is clearly seen in Table 5 that females are at much higher chance of having hypertension. Although the prevalence of heart morbidity (highest odds ratio 1.33) and other morbidity are higher in urban areas. People having primarily education level are having higher odds of having hypertension and asthma whereas people completed higher secondary education level are having higher odds of having diabetes, heart morbidity and cancer. Middle class people are at the higher risk of being hypertension and asthma with CI (0.94, 1.4) and (0.98, 1.31) respectively. Richest people are at high risk in case of diabetes, heart morbidity and cancer.
|
Table 5 Results of logistic regression for hospitalization due to four selected non communicable morbidity, India, 2017-18 |
||||||||||||||||||
|
Background Characteristics |
Hypertension |
Diabetes |
Heart Disease |
Cancer |
Asthama |
|||||||||||||
|
Odds Ratio |
CI (LL-UL) |
Odds Ratio |
CI (LL-UL) |
Odds Ratio |
CI (LL-UL) |
Odds Ratio |
CI (LL-UL) |
Odds Ratio |
CI (LL-UL) |
|||||||||
|
Age group (years) |
||||||||||||||||||
|
<1 |
1 |
0.27** |
0.08-0.85 |
0.89 |
0.66-1.18 |
0.17*** |
0.05-0.54 |
4.00*** |
3.19-5.01 |
|||||||||
|
1–4 |
0.03*** |
0.00-0.22 |
0.19*** |
0.06-0.60 |
0.53*** |
0.39-0.72 |
0.63*** |
0.37-1.08 |
2.32*** |
1.84-2.91 |
||||||||
|
5–9 |
0.05*** |
0.01-0.18 |
0.08*** |
0.02-0.34 |
0.29*** |
0.20-0.40 |
0.22*** |
0.11-0.43 |
1.33*** |
1.03-1.70 |
||||||||
|
10–19 |
0.09*** |
0.04-0.17 |
0.48*** |
0.30-0.76 |
0.28*** |
0.22-0.36 |
0.46*** |
0.32-0.65 |
0.84 |
0.67-1.05 |
||||||||
|
20–29 |
0.38*** |
0.26-0.54 |
0.46*** |
0.30-0.72 |
0.34*** |
0.27-0.42 |
0.47*** |
0.34-0.64 |
0.97 |
0.79-1.20 |
||||||||
|
30–39† |
||||||||||||||||||
|
40–49 |
1.68*** |
1.33-2.11 |
2.72*** |
2.03-3.64 |
1.71*** |
1.49-1.97 |
2.14*** |
1.71-2.68 |
1.08 |
0.89-1.31 |
||||||||
|
50–59 |
2.78*** |
2.24-3.45 |
5.75*** |
4.36-7.56 |
2.87*** |
2.52-3.27 |
2.34*** |
1.87-2.92 |
1.48*** |
1.24-1.77 |
||||||||
|
60–69 |
3.70*** |
2.96-4.61 |
6.98*** |
5.27-9.23 |
3.79*** |
3.32-4.34 |
2.59*** |
2.04-3.28 |
2.14*** |
1.79-2.57 |
||||||||
|
70–79 |
3.08*** |
2.38-3.97 |
6.75*** |
5.00-9.12 |
3.94*** |
3.40-4.57 |
2.75*** |
2.10-3.59 |
3.11*** |
2.56-3.77 |
||||||||
|
80+ |
3.61*** |
2.62-4.97 |
6.22*** |
4.30-8.98 |
3.78*** |
3.11-4.58 |
1.21 |
0.75-1.97 |
4.71*** |
3.75-5.91 |
||||||||
|
Sex |
||||||||||||||||||
|
Male® |
||||||||||||||||||
|
Female |
1.53*** |
1.36-1.71 |
1.10 |
0.98-1.22 |
0.72*** |
0.67-0.77 |
1.32*** |
1.17-1.48 |
0.87*** |
0.80-0.95 |
||||||||
|
Place of residence |
||||||||||||||||||
|
Rural® |
||||||||||||||||||
|
Urban |
1.26*** |
1.11-1.41 |
1.30*** |
1.46-1.15 |
1.33*** |
1.24-1.43 |
0.92 |
0.81-1.04 |
1.19*** |
1.09-1.29 |
||||||||
|
Education level |
||||||||||||||||||
|
No education® |
||||||||||||||||||
|
Primary |
1.11 |
0.96-1.29 |
1.24*** |
1.07-1.44 |
1.13*** |
1.03-1.24 |
1.36*** |
1.15-1.60 |
0.88** |
0.78-0.99 |
||||||||
|
Secondary |
1.09 |
0.98-1.28 |
1.24*** |
1.06-1.45 |
1.21*** |
1.10-1.33 |
1.35*** |
1.13-1.60 |
0.74*** |
0.65-0.83 |
||||||||
|
Higher secondary |
1.04 |
0.86-1.25 |
1.27*** |
1.05-1.53 |
1.20*** |
1.07-1.34 |
1.71*** |
1.40-2.09 |
0.65*** |
0.56-0.76 |
||||||||
|
MPCE |
||||||||||||||||||
|
Poorest® |
||||||||||||||||||
|
Poorer |
1.00 |
0.81-1.23 |
0.98 |
0.79-1.20 |
1.20*** |
1.06-1.36 |
1.40*** |
1.10-1.76 |
1.06 |
0.92-1.22 |
||||||||
|
Middle |
1.15 |
0.94-1.40 |
1.06 |
0.86-1.29 |
1.11 |
0.98-1.25 |
1.43*** |
1.14-1.80 |
1.14* |
0.98-1.31 |
||||||||
|
Richer |
1.13 |
0.92-1.37 |
1.04 |
0.85-1.27 |
1.28*** |
1.14-1.44 |
1.29** |
1.02-1.61 |
1.04 |
0.90-1.19 |
||||||||
|
Richest |
1.12 |
0.92-1.35 |
1.13 |
0.93-1.36 |
1.43*** |
1.27-1.60 |
1.44*** |
1.16-1.78 |
1.12* |
0.98-1.28 |
||||||||
|
Constant |
0.01*** |
0.01-0.01 |
0.01*** |
0.00-0.00 |
0.03*** |
0.03-0.04 |
0.01*** |
0.00-0.01 |
0.03*** |
0.02-0.03 |
||||||||
|
® is a reference
category
Significance Level: ≤ .01 = ***, ≤.05 = **, ≤ .1 = * |
||||||||||||||||||
|
|
|
Figure 5 Mean Out of pocket expenditure
(INR)per hospitalization stay in public and private health care |
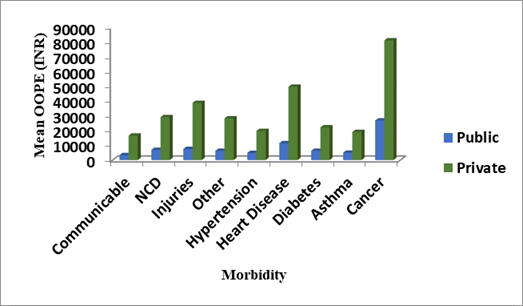
From Table 6 (Figure 5) it is clearly seen that in total cases mean cases of hospitalization is highest in heart morbidity and lowest in communicable morbidity. Reimbursement is highest in Cancer patients and lowest for the patients who are affected by communicable morbidity. Due to chemotherapy or change of blood in the whole body due to blood cancer, out of pocket expenditure is normally high. So, it’s a normal issue. After that heart disease expenditure comes due to some special medicines and extra cares.
|
Table 6 Total expenditure (Mean), Reimbursement and OOPE per Hospitalization stay in public and private health care facilities by classification of morbidity, India, 2017-18 |
||||||||||
|
Total |
Public facilities |
Private facilities |
||||||||
|
Total Expenditure (Mean) |
Reimbursement |
OOPE |
Total Expenditure (Mean) |
Reimbursement |
OOPE |
Total Expenditure (Mean) |
Reimburse ment |
OOPE |
||
|
Communicable |
12593 |
2719 |
9874 |
3940 |
598 |
3342 |
21239 |
4646 |
16594 |
|
|
NCD |
25019 |
5735 |
19284 |
7600 |
669 |
6931 |
38505 |
9396 |
29109 |
|
|
Injuries |
30126 |
5477 |
24649 |
9122 |
1537 |
7585 |
46713 |
7985 |
38728 |
|
|
Other |
21344 |
4149 |
17195 |
7016 |
747 |
6269 |
35435 |
7158 |
28277 |
|
|
Hypertension |
17056 |
4758 |
12298 |
5144 |
264 |
4880 |
28497 |
8758 |
19739 |
|
|
Heart Disease |
49852 |
15838 |
34015 |
13597 |
2158 |
11439 |
74171 |
24472 |
49699 |
|
|
Diabetes |
19163 |
4601 |
14561 |
6321 |
996 |
5325 |
28961 |
6796 |
22164 |
|
|
Asthma |
14480 |
2815 |
11665 |
5517 |
482 |
5035 |
24570 |
5523 |
19047 |
|
|
Cancer |
78417 |
20294 |
58123 |
36486 |
9659 |
26827 |
109927 |
28797 |
81130 |
|
As facilities are good in private hospitals than the public hospitals or nursing homes, so means, reimbursement and OOPE is higher in private hospitals. There are not too much relative changes are shown due to the causes of hospitalization. Everything is dependent on Causes of Hospitalization whatever the sector is private or public.
It is found in Table 7 that the household income or savings is highest in communicable morbidity and lowest in cancer. In case of borrowing cancer has highest percentage and diabetes has lowest percentage. For others communicable morbidity has lowest percentage and cancer and highest percentage.
|
Table 7 Major sources of funding for out-of-pocket spending on hospitalization |
|||
|
Cause
of Hospitalistion |
Household
Income/savings |
Borrowing |
Others |
|
All
Causes |
84.4 |
9.6 |
6.0 |
|
Communicable |
87.2 |
7.9 |
4.9 |
|
NCD |
82.8 |
10.9 |
6.3 |
|
Injuries |
80.7 |
12.8 |
6.5 |
|
Other |
83.8 |
9.4 |
6.9 |
|
Hypertension |
86.0 |
7.9 |
6.1 |
|
Heart
Disease |
82.7 |
9.8 |
7.5 |
|
Diabetes |
86.6 |
6.7 |
6.7 |
|
Asthma |
85.1 |
8.8 |
6.2 |
|
Cancer |
73.3 |
14.2 |
12.6 |
5. RESULTS FROM REGRESSION
In the Table 8 the sign of a regression coefficient tells that whether there is a positive or negative correlation between each independent variable and the dependent variable. A positive coefficient indicates that as the value of the independent variable increases, the mean of the dependent variable also tends to increase. A negative coefficient suggests that as the independent variable increases, the dependent variable tends to decrease.
|
Table 8 A log-linear regression model was used to understand the significant predictors of OOPE |
|||
|
Independent Variables |
Unstandardized
beta coefficients |
95% CI |
|
|
Lower Limit |
Upper Limit |
||
|
Type of Morbidity |
|||
|
Communicable (No®) |
|||
|
Yes |
0.335*** |
0.295 |
0.374 |
|
Other NCDs (No®) |
|||
|
Yes |
-0.060*** |
-0.102 |
-0.018 |
|
Injuries (No®) |
|||
|
Yes |
-0.129*** |
-0.179 |
-0.078 |
|
Heart Morbidity (No®) |
|||
|
Yes |
-0.438*** |
-0.499 |
-0.377 |
|
Cancer (No®) |
|||
|
Yes |
-0.644*** |
-0.744 |
-0.544 |
|
Age (in completed years) |
0.040*** |
0.034 |
0.045 |
|
Sex (Male®) |
|||
|
Female |
-0.065*** |
-0.092 |
-0.039 |
|
Place of residence (Rural®) |
|||
|
Urban |
-0.056*** |
-0.083 |
-0.029 |
|
Education level (Illiterate®) |
|||
|
Literate |
0.088*** |
0.059 |
0.118 |
|
MPCE (1-10) |
0.025*** |
0.016 |
0.035 |
|
Place of Hospitalization Public (No®) |
|||
|
Yes |
1.666*** |
1.639 |
1.693 |
|
Place of Hospitalization Private (No®) |
|||
|
Yes |
0.000 |
||
|
Duration of Stay (continuous variable) |
0.064*** |
0.062 |
0.065 |
|
Number of hospitalizations |
0.008 |
-0.011 |
0.027 |
|
Constant |
8.204*** |
8.015 |
8.394 |
|
® is a reference category Significance Level:
≤ .01 = ***, ≤.05 = **, ≤ .1 = * |
|||
The coefficient value signifies how much the mean of the dependent variable changes given a one-unit shift in the independent variable while holding other variables in the model constant. This property of holding the other variables constant is crucial because it allows us to assess the effect of each variable in isolation from the other. As we see that out-of-pocket expenditure is increasing those who having different dseases. OOPE is much higher among the population those who live in the urban places as compare to the rural area. Those who are suffering from communicable disease the OOPE is high among them than those who are not suffering. As the age increase the out of pocket is also increasing as we cansee from the table. The out-of-pocket expenses is also high among the male as compare to the female population. As we see that there is no significant effect of out-of-pocket expenditure on private hospitalization care. There is positive increase of expenditure as the increase of duration stay in hospital and the number of times people are being hospitalized during one year prior to our survey.
6. DISCUSSION AND CONCLUSIONS
In our study we found that the maximum number of children aged under 14 has been hospitalized due to communicable, perinatal problem and nutritional problems. This is happened in India due to deficiency of required nutrition among children. Older adults are more likely to be hospitalized due to non-communicable morbidity there is also hospitalization among the older adults due to respiratory disease. Older adults have the high risk of having non communicable and respiratory disease in India. It is also found from our study that the hospitalization due accidents are more likely to be high among male in India. Adults are being hospitalized due to injuries in the country like India. We found from our study that the high prevalence in injuries caused hospitalization among adults’ population. Prevalence of cardio vascular disease is also high among the older adults in India. Hospitalization due to diabetes is very much less because people often go to the clinic at regular interval because our study restricted to only inpatient care during 365 days. Those have hospitalized due to cancer during 365 days they often go the clinic more than one time. We have found in our study that mean duration stay in hospital is maximum among the people above aged 60 years. We have found in our study that mean monthly expenditure due to non-communicable disease and cancer is more likely to be high in the older adults and expenditure in the private care is much higher than the government health care. People expense due to disease in the private care and this is why expenditure is likely to be high in India. It is also clear that government hospital cannot provide the proper health facilities to satisfy the patients, due to this lack of infrastructure in the government hospital people prefer to go in the private care though the expense is much high than the government. Increased public spending on health has a direct effect in reducing out-of-pocket health expenditure and could be helpful for many households to overcome the medical poverty trap. The Ministry of Health and Family Welfare, Government of India, launched the National Programme for Prevention and Control of Cancer, Diabetes, Cardiovascular Disease and Stroke (NPCDCS) in 2010. These initiatives may be helpful in averting many households from the medical poverty trap.
7. STRENGTHS AND LIMITATIONS OF THIS STUDY
1) The use of large-scale data from nationwide surveys in India provides the most updated trends for hospitalization.
2) The evidence on the changing hospitalization rate by age groups and the reasons behind the increased hospitalization of the older population is timely for policy formulation given the population ageing and shifting disease burden.
3) It was not possible for us to study the contribution of the supply side factors in the increased hospitalization.
4) Self-reported data and the nature of cross-sectional data may lead to recall and reporting biases, which may have affected the accuracy of the results.
REFERENCES
Baji, P., et al., (2012). Changes in equity in out-of-pocket payments during the period of health care reforms: evidence from Hungary. Int. J. Equity Health 11, 36. Retrieved from https://doi.org/10.1186/1475-9276-11-36
Bock, J.-O., et al., (2014). Inequalities in out-of-pocket payments for health care services among elderly Germans-results of a population-based cross-sectional study. Int. J. Equity Health 13, 3. http://dx.doi.org/10.1186/1475-9276-13-3. Retrieved from https://doi.org/10.1186/1475-9276-13-3
Bose M, Dutta A. (2014) Access to Non-hospitalization Care in West Bengal: A Demand-side Assessment Based on NSS Data. Indian Journal of Human Development: forthcoming. Retrieved from https://doi.org/10.1177/0973703020140105
Gupt, A., et al., (2016). Out of pocket expenditure for hospitalization among below poverty line households in district Solan, Himachal Pradesh, India, 2013.PLoSOne11(2),e0149824. Retrieved from http://dx.doi.org/10.1371/journal.pone.014984
International Institute for Population Sciences [IIPS] and World Health Organisation [WHO], (2006). Health system performance assessment: World Health Survey, 2003, West Bengal. Mumbai: IIPS.
Kastor A, Mohanty SK. (2018) Disease and age pattern of hospitalization and associated costs in India: 1995-2014. BMJ Open;8:e016990. Retrieved from https://doi.org/10.1136/bmjopen-2017-016990
Kumar, K., et al., (2015). Socioeconomic differentials in impoverishment effects of out-ofpocket health expenditure in China and India: evidence from WHO SAGE. PLoS One 10 (8), e0135051. Retrieved from http://dx.doi.org/10.1371/journal.pone.0135051
Mohanty, S.K., et al., (2013). Out-of-pocket expenditure on health care among elderly and non-elderly households in India. Soc. Indicat. Res. 115 (3), 1137-1157. Retrieved from https://doi.org/10.1007/s11205-013-0261-7
Mohanty, S.K., et al., (2016). Pattern, growth and determinant of household health spending in India, 1993–2012. 24, pages 215–229. Retrieved from https://link.springer.com/article/10.1007/s10389-016-0712-0
National Sample Survey Organization (NSSO) [internet]. Retrieved from http://mospi.nic.in/Mospi_New/Admin/ publication.aspx
Rajaratnam JK, Marcus JR, Levin-Rector A, et al. (2010) Worldwide mortality in men and women aged 15-59 years from 1970 to: a systematic analysis. Lancet 2010;375:1704-20. Retrieved from https://doi.org/10.1016/S0140-6736(10)60517-X
Russo, C. A. and Elixhauser, A. (2006) Hospitalizations in the Elderly Population, 2003. Statistical Brief #6. May. Agency for Healthcare Research and Quality, Rockville, Md. Retrieved from http://www.hcup-us.ahrq.gov/reports/ statbriefs/sb6.pdf
Saikia, N., Bora, J.K., (2016). Gender difference in healthcare expenditure: evidence from India human development survey. PLoS One 11 (7), e0158332. http://dx.doi.org/10. 1371/journal.pone.0158332
Shahrawat R, Rao KD. (2012) Insured yet Vulnerable: Out-of-Pocket Payments and India's Poor. Health Policy Plan; 27: 213-21. Retrieved from https://doi.org/10.1093/heapol/czr029
https://www.sciencedirect.com/science/article/pii/S0277953618300315
ANNEXURE
Classification
of Morbidity
· Communicable conditions.
· Non communicable conditions.
· Accidents/injuries/burns/fractures/poisoning.
· Others.
Communicable
conditions
Fever/Pyrexia
of unknown reasons
• Malaria
• Diarrhoea/Dysentery, Gastritis/peptic
ulcer, worm infestation, Amebosis, Hepatitis/Jaundice
• Tetanus
• Filariasis
• Tuberculosis
• Morbidity of Skin
• Gynaecological Disorders
• Sexually transmitted infection/ morbidity
• Respirator (including ear/nose/throat)
ailment for age < years
• Genito/Urinary Tract infection
Non
communicable conditions
Chronic
Conditions
· Heart morbidity/ Problems with heart,
including unexplained pain in chest
· Hypertension (high blood pressure)
· Cancer and Tumors
· Stroke/sudden paralysis of one side of body
· Diabetes
Respiratory
Disease
· Bronchial asthma
· Respiratory ailment for age > 15 years
Bone
Morbidity
· Disorders of Joints and bones (Chronic pain in joints/
arthritis /rheumatism /osteoporosis)
Gastrointestinal
Morbidity
Neurological
disorders and psychological disorders
· Mental retardation, Mental disorder, Headache, Seizures or
known epilepsy, Weakness in limb muscles and difficulty in movements, Others
including memory loss, confusion
Eye
ailments (cataract, glaucoma, vision, others)
Ear
ailment (32, 33)
Injuries
Accidents/injuries/burns/fractures/poisoning
Others
• Other undiagnosed ailments
• Nutrition Malfunction: under nutrition, anaemia,
Others including obesity, Goiter and other disease of thyroid
• Bleeding Disorder
• Maternal and prenatal conditions
• New born
 This work is licensed under a: Creative Commons Attribution 4.0 International License
© Granthaalayah 2014-2021. All Rights Reserved.