THE EFFECT OF LIQUIDITY, CAPITAL INTENSITY, AND INVENTORY INTENSITY ON TAX AVOIDANCESyifa Urrahmah 1 1, 2 Bhayangkara Jakarta Raya
University, Accounting Study Program, Indonesia. |
|
||
|
|
|||
|
Received 5 November2021 Accepted 17 December 2021 Published 31 December 2021 Corresponding Author Aloysius
Harry Mukti, aloysius.harry@dsn.ubharajaya.ac.id DOI 10.29121/granthaalayah.v9.i12.2021.4399 Funding:
This
research received no specific grant from any funding agency in the public,
commercial, or not-for-profit sectors. Copyright:
© 2021
The Author(s). This is an open access article distributed under the terms of
the Creative Commons Attribution License, which permits unrestricted use, distribution,
and reproduction in any medium, provided the original author and source are
credited.
|
ABSTRACT |
|
|
|
This study aims to examine the effect of
liquidity, capital intensity, and inventory intensity on tax avoidance with
leverage and profitability as control variables. Tax avoidance was measured
by Effective Tax Rate (ETR), liquidity was measured by current ratio, capital
intensity was measured by capital intensity ratio, inventory intensity was
measured by inventory intensity ratio, leverage was measured by Debt-to-Equity
Ratio (DER), and profitability was measured by Return on Assets (ROA). The
population in this study are all manufacturing sector companies listed on the
Indonesia Stock Exchange for the period 2017-2019. The sampling technique
used is purposive sampling method and obtained as many as 106 data samples.
The analytical method used is multiple linear regression. |
|
||
|
Keywords: Liquidity,
Capital Intensity, Inventory Intensity, Tax Avoidance 1. INTRODUCTION In addition to
improving the quality of Human Resources (HR), infrastructure development in
Indonesia is also the main focus of the government with the hope that
advanced and adequate infrastructure can increase competitiveness, growth and
equity of the national economy. Seen in the last few years, Indonesia's
infrastructure has continued to improve both in terms of quality and quantity.
Infrastructure
development requires large funds in the operation of its development
activities. The State Revenue and Expenditure Budget (APBN) is one of the
sources of funding for infrastructure development in Indonesia. Therefore,
the budget for running infrastructure projects continues to increase every
year. The APBN itself consists of 3 main components, namely state revenues,
state expenditures, and state financing. State revenues recorded in the APBN
come from tax revenues as the largest contribution, Non-Tax State Revenues
(PNBP), and grants. As the largest contribution, tax according to Law (UU)
No. 28 of 2007 Article 1 Paragraph 1 is a mandatory contribution to the state
owed by an individual or entity that is coercive under the Act |
|
||
|
Table 1 Target and Realization of Tax Revenue |
|||||
|
Year |
2016 |
2017 |
2018 |
2019 |
2020 |
|
Target |
1,355,20 |
1,258.57 |
1,424,00 |
1,577.56 |
1198.82 |
|
Realization |
1105.73 |
1,151.03 |
1,315.51 |
1,332.06 |
1,069.98 |
|
Achievements |
81.59% |
89.67% |
92.24% |
84.44% |
89.25% |
|
Source: Data processed from DGT MALE, 2016-2020 |
|||||
Minister of Finance Sri Mulyani as reported in the Danny Darussalam Tax Center (DDTC News) said that the realization of tax revenues in 2020 only reached Rp. 1,070.0 trillion, or 89.3% of the 2020 State Budget target which was amended through Presidential Regulation (Perpres) 72/2020 worth Rp. 1,198.8 trillion. The realization of the tax experienced a decline of 19.7% compared to 2019. According to him, there were two things that caused the decline in tax revenues in 2020. First, weak economic activity. Second, the government provides a very broad tax incentive. Some of these incentives are in the form of Article 21 Income Tax Deferred by the Government (PPh 21 DTP), discounted PPh Article 25 installments, and reduced corporate income tax rates.
Due to the different views between the government and taxpayers, in which the government wants to continue to increase and maximize state revenues through taxes to finance state administration, while taxpayers, especially companies, will try to get as much profit as possible by managing the tax burden to a minimum. Because the company considers that taxes are a burden and will reduce the company's income or profits that should be distributed to interested parties in the company. The difference in interest causes the non-compliance of corporate taxpayers or the management to make efforts to avoid tax (tax avoidance). Alam and Fidiana (2019). Because basically this tax avoidance is done by taking advantage of the loopholes and weaknesses contained in the tax laws and regulations so that tax avoidance actions are considered legal because they do not violate the applicable tax laws and regulations. Artinasari and Mildawati (2018).
One of the financial conditions that are predicted to be able to influence the occurrence of tax avoidance in companies is liquidity, where liquidity is used as a measure of the company's ability to meet its short-term obligations. Artinasari and Mildawati (2018) states that companies that have a high level of liquidity are able to meet their short-term obligations including paying taxes because the cash flow in the company is running well. Conversely, companies with low levels of liquidity may not be able to meet their short-term obligations and will not comply with their tax obligations because these companies prefer to make savings in order to maintain the company's cash flow. Nur and Subardjo (2020).
Another factor that can influence the occurrence of tax avoidance is capital intensity or capital intensity. Capital intensity is the amount of capital invested by the company in the form of fixed assets Muzakki and Darsono (2015). Investing more in the form of fixed assets is one of the company's strategies in carrying out tax avoidance practices, because almost all fixed assets experience depreciation so that depreciation charges arise which will increase the company's burden. As a deduction from profit in tax calculations, a large company expense will lower the pre-tax profit so that the tax that must be paid by the company will be lower. Thus, the higher the value of capital intensity in a company, the higher the probability that the company will practice tax avoidance.
In addition to liquidity and capital intensity, inventory intensity is also predicted to affect the occurrence of tax avoidance. Inventory intensity is a measurement of how much the company invests in inventory Anindyka et al. (2018). Companies that invest in inventory in the warehouse will incur maintenance costs and inventory storage costs, so that the company's total expenses will increase which is followed by a decrease in company profits and of course tax costs will be lower.
2. HYPOTHESES DEVELOPMENT
Effect of
Liquidity on Tax Avoidance
Liquidity as a measure of the company's ability to meet its short-term obligations. Companies with low levels of liquidity may not be able to meet their short-term obligations and will not comply with their tax obligations because these companies prefer to maintain their cash flows. Meanwhile, a company with a high level of liquidity indicates that the company is in a healthy condition and there are no problems in its cash flow so that it is able to meet expenses such as the tax burden. On this basis it is suspected that liquidity has an influence on tax avoidance. This is in line with research conducted by Budianti and Curry (2018) and Abdullah (2020) which shows that liquidity has a positive effect on tax avoidance, and Artinasari and Mildawati (2018), Sarasati and Asyik (2018), and Nur and Subardjo (2020) which shows that liquidity has a negative effect on tax avoidance. Based on this description related to the relationship between liquidity and tax avoidance, the research hypothesis proposed is as follows.
H1: Liquidity
affects Tax Avoidance
Effect of
Capital Intensity on Tax Avoidance
Capital intensity related to how much the company invests in fixed assets. Almost all fixed assets will experience depreciation every year, giving rise to a depreciation expense in the company's financial statements. Depreciation expense is used as a deduction from pre-tax profit so that later the tax burden paid by the company will be reduced if the company's profit before tax is low. On this basis it is suspected that capital intensity has an influence on tax avoidance. This is in line with research conducted by Dwiyanti and Jati (2019), Artinasari and Mildawati (2018), Dharma and Noviari (2017) which shows that capital intensity has a positive effect on tax avoidance, and Budianti and Curry (2018), Sinaga and Suardikha (2019), Muzakki and Darsono (2015), Rifai and Atiningsih (2019) which shows that capital intensity has a negative effect on tax avoidance. Based on the description related to the relationship between capital intensity and tax avoidance, the research hypothesis proposed is as follows
H2: Capital Intensity affects
Tax Avoidance
Influence
Inventory Intensity to Tax Avoidance
Inventory intensity related to how much the company invests in inventory. The more the company's inventory, the more maintenance costs and storage costs will reduce the company's profits so that the taxes paid by the company will decrease. On this basis it is suspected that inventory intensity has an influence on tax avoidance. This is in line with research conducted by Dwiyanti and Jati (2019), Syamsuddin and Suryarini (2020), and Anggriantari and Purwantini (2020) which shows that inventory intensity has a positive effect on tax avoidane, and Nasution, and Mulyani (2020) which shows that inventory intensity has a negative effect on tax avoidance. Based on the description related to the relationship between inventory intensity and tax avoidance, the research hypothesis proposed is as follows
H3:
Inventory Intensity affects Tax Avoidance
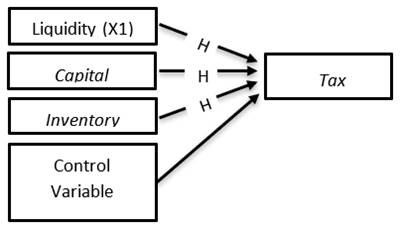
The relationship between variables in this study can be described in the following framework:
|
|
|
Figure 1 Thinking Framework |
3. RESEARCH METHODS
The type of research used in this study used descriptive statistical analysis with a quantitative approach. In this study, secondary data is used in the form of annual reports published successively during 2017-2019 on manufacturing companies listed on the Indonesia Stock Exchange. The population used in this study are all manufacturing companies listed on the Indonesia Stock Exchange (IDX) with annual reports for the 2017-2019 period. The sample selection in this study used a purposive sampling method, later samples that did not meet the criteria were not included in the sample of this study. The criteria categorized in this study are: (1) Listed as a manufacturing company on the Indonesia Stock Exchange during 2017-2019 consecutively. (2) Manufacturing companies that publish their complete and audited financial statements consecutively during 2017-2019. (3) Manufacturing companies that present their financial statements in Rupiah currency so that the currency measurement criteria are the same. (4) Manufacturing companies that do not suffer losses or that show a positive value in profit after tax during the research year that cause distortions in the measurement of tax avoidance. Companies that experience losses are not subject to tax burden. (4) Manufacturing companies that do not experience losses or that show a positive value in after-tax profit during the research year that cause distortions in the measurement of tax avoidance. Companies that experience losses are not subject to tax burden. (4) Manufacturing companies that do not experience losses or that show a positive value in after-tax profit during the research year that cause distortions in the measurement of tax avoidance. Companies that experience losses are not subject to tax burden.
3.1 Variable Operation
Dependent
Variable
1) Tax Avoidance
![]()
Independent
Variable
1) Liquidity
![]()
2) Capital Intensity
![]()
3) Inventory Intensity
![]()
Control Variable
1) Leverage
![]()
2) Profitability
![]()
3.2 Data analysis method
This study uses data analysis methods that include descriptive statistical analysis and classical assumption test to test the feasibility of using the regression model. The classical assumption test used in this study includes the normality test, multicollinearity test, hetesoscedasticity test and autocorrelation test. The analytical tool used in the test is IBM SPSS (Statistical Product and Service Solution) software version 23. Multiple regression analysis in this study is used to examine the effect of independent variables, namely liquidity, capital intensity, and inventory intensity on the dependent variable, namely tax avoidance and additional variables. control leverage and profitability. The multiple linear regression equation model used in this study is formulated as follows
Y= α+ β1X1+ β2X2+β3X3+ β4X4+ β5X5+ε
Information:
Y = Tax Avoidance
️ = Constant
X1 = Liquidity
X2 = Capital Intensity
X3 = Inventory Intensity
X4 = Leverage
X5 = Profitability
1 - 5 = Partial Regression Coefficient
️ = Errors/Other variables not identified in the model
4. RESULTS AND DISCUSSION
Description of
Research Object
By using purposive sampling, the sample used in this study was 83 companies multiplied by 3 years of observation to obtain 249 samples. Due to an adjustment when the researcher conducted data processing (outlier data was found) which caused the data or sample to be unable to continue processing the data, then the outlier data was deleted so that the details of the company sample acquisition were as follows:
|
Table 2 Sampling Details |
||
|
No |
Sample Selection Criteria |
Amount |
|
1 |
Initial population of
manufacturing companies listed on the Indonesia Stock Exchange in 2017-2019 |
197 |
|
2 |
Manufacturing companies
whose financial statements were not published in full during the research
period, namely 2017-2019 |
(52) |
|
3 |
Manufacturing companies
whose financial statements do not use Rupiah currency |
(26) |
|
4 |
Manufacturing companies
that experienced losses during the research period, namely 2017-2019 |
(36) |
|
Number of companies used as sample |
83 |
|
|
Observation year |
3 |
|
|
Number of research samples |
249 |
|
|
Outliers |
(143) |
|
|
Final number of research samples |
106 |
|
|
Source:
Secondary Data processed, 2021 |
||
Descriptive statistics
|
Table 3 Descriptive Statistics |
|||||
|
N |
Minimum |
Maximum |
mean |
Std. Deviation |
|
|
Y_TA |
106 |
,2040 |
,2982 |
,249563 |
,0218157 |
|
X1_LIKUID |
106 |
,7261 |
5.2113 |
2,267,650 |
1.1676084 |
|
X2_CI |
106 |
,0598 |
,7745 |
,386200 |
,1672653 |
|
X3_II |
106 |
,0119 |
,4066 |
,189021 |
,0894037 |
|
X4_LEV |
106 |
,1313 |
2.7392 |
,732773 |
,4724179 |
|
X5_PROFIT |
106 |
,0001 |
,1567 |
,070262 |
0.0367678 |
|
Valid N (listwise) |
106 |
||||
|
Source: Secondary Data processed, 2021 |
|||||
Based on Table 3 above, the Tax Avoidance variable proxied by the Effective Tax Rate (ETR) has the lowest value of 0.2040 and the highest value of 0.29. The average value (mean) is 0.25 with a standard deviation of 0.02. Liquidity variable which is proxied by current ratio has the lowest value of 0.73 and the highest value of 5.21. The average value of the liquidity variable is 2.27 with a standard deviation of 1.17. The Capital Intensity variable which is proxied by the capital intensity ratio (CI) has the lowest value of 0.05 and the highest value of 0.77. The average value of the capital intensity variable is 0.38 with a standard deviation of 0.16. Inventory Intensity variable which is proxied by the ratio of inventory intensity (II) has the lowest value of 0, 01 and the highest value of 0.40. The average value of the inventory intensity variable is 0.18 with a standard deviation of 0.08.
There are two control variables in this study, namely leverage and profitability. Leverage as proxied by debt-to-equity ratio (DER) has the lowest value of 0.13 and the highest value of 2.73. The average value of the leverage control variable is 0.73 with a standard deviation of 0.47. The second control variable, namely profitability as a proxy for return on assets (ROA) has the lowest value of 0.0001 and the highest value of 0.15. The average value of the profitability control variable is 0.07 with a standard deviation of 0.03.
All variables have a standard deviation that is lower than the mean value. This proves that the distribution of data variables is small or there is no big enough gap.
Classic
assumption test
The classical assumption test is useful to see whether the research data used can be analyzed using multiple linear regression equations and the data is unbiased.
Normality test
|
Table 4 Normality Test |
||
|
Unstandardized Residual |
||
|
N |
106 |
|
|
Normal Parameters, b |
mean |
,0000000 |
|
Std. Deviation |
,02008343 |
|
|
Most Extreme Differences |
Absolute |
,066 |
|
Positive |
0.055 |
|
|
negative |
-,066 |
|
|
TesStatistics |
,066 |
|
|
asymp. Sig. (2-tailed) |
,200c,d |
|
|
Source: Secondary Data processed, 2021 |
||
Based on Table 4, it can be concluded that the regression model meets the assumption of normality. It can be seen from the significance value which is greater than 0.05, which is 0.200 so that the data is declared to be normally distributed.
Multicollinearity Test
|
Table 5 Multicollinearity Test |
|||
|
Collinearity Statistics |
|||
|
Model |
Tolerance |
VIF |
|
|
1 |
X1_LIKUID |
,459 |
2,177 |
|
X2_CI |
,664 |
1,506 |
|
|
X3_II |
,770 |
1,299 |
|
|
X4_LEV |
,485 |
2,060 |
|
|
X5_PROFIT |
,696 |
1,436 |
|
|
a Dependent Variable: Y_TA |
|||
|
Source: Secondary Data processed, 2021 |
|||
Based on Table 5, the tolerance value of the Liquidity variable is 0.459, Capital Intensity is 0.664 and Inventory Intensity is 0.770. Each of the variables has shown a tolerance value greater than 0.1. While the VIF value of the Liquidity variable is 2.117, Capital Intensity is 1.506 and Inventory Intensity is 1.299. In addition, there is a tolerance value of the control variables Leverage and Profitability, respectively, namely 0.485 and 0.696. While the VIF values of the control variables Leverage and Profitability are 2,060 and 1.436, respectively. Each of the variables has shown a VIF value that is less than 10. Because the tolerance value of each variable is greater than 0.1 and the VIF value of each variable is less than 10,
Heteroscedasticity
Test
|
Table 6 Heteroscedasticity Test |
||||||
|
Unstandardized Coefficients |
Standardized Coefficients |
t |
Sig. |
|||
|
Model |
B |
Std. Error |
Beta |
|||
|
1 |
(Constant) |
0.014 |
,009 |
1,537 |
,127 |
|
|
X1_LIKUID |
-,002 |
,002 |
-,204 |
-1,444 |
,152 |
|
|
X2_CI |
9.64E-05 |
,009 |
0.001 |
0.011 |
,991 |
|
|
X3_II |
,002 |
0.015 |
0.016 |
,146 |
,884 |
|
|
X4_LEV |
,004 |
,004 |
,152 |
1.103 |
,273 |
|
|
X5_PROFIT |
0.05 |
0.039 |
,148 |
1,292 |
,199 |
|
|
a. Dependent Variable: ABRESID |
||||||
|
Source:
Secondary Data processed, 2021 |
||||||
Based on Table 6, the significant coefficient value of the Liquidity variable is 0.152, Capital Intensity is 0.991, Inventory Intensity is 0.884, and the control variable Leverage is 0.273 and Profitability is 0.199. Each of the independent variables and control variables has shown a significance coefficient value greater than 0.05 so it can be concluded that the regression model in this study does not occur heteroscedasticity.
Autocorrelation
Test
|
Table 7 Autocorrelation Test |
|
|
Model |
Durbin-Watson |
|
1 |
1,892a |
|
a. Predictors: (Constant), X5_PROFIT,
X3_II, X4_LEV, X2_CI, X1_LIKUID |
|
|
b. Dependent Variable: Y_TA |
|
|
Source: Secondary Data processed, 2021 |
|
Based on Table 7, the Durbin-Watson value is 1.892. This DW value will be compared with the table value using a 5% confidence degree (α), the number of samples (n) is 106 samples and the independent variable (k) is 5 variables. The DU value obtained is 1.783 so it can be concluded that the regression model in this study does not occur autocorrelation because DU < DW < 4 – DU (1.783 < 1.892 < 2.217).
Multiple Linear
Regression Analysis
|
Table 8 Multiple Linear Regression Analysis |
||||
|
Unstandardized Coefficients |
Standardized Coefficients |
|||
|
Model |
B |
Std. Error |
Beta |
|
|
1 |
(Constant) |
,187 |
0.015 |
|
|
X1_LIKUID |
,007 |
,003 |
,361 |
|
|
X2_CI |
0.047 |
0.015 |
,363 |
|
|
X3_II |
,037 |
,026 |
,152 |
|
|
X4_LEV |
0.018 |
,006 |
,385 |
|
|
X5_PROFIT |
,123 |
,065 |
,207 |
|
|
a. Dependent Variable: Y_TA |
||||
|
Source: Secondary Data processed, 2021 |
||||
Based on Table 8, the regression equation model developed is as follows:
![]()
Based on the regression equation, several things can be interpreted as follows:
First, the constant value of 0.187 states that if the independent variable is considered constant (the value is fixed), then Tax Avoidance will increase by 0.187. Second, the coefficient value of the Liquidity variable (X1) is positive at 0.007. This implies that if there is an increase of one unit in the Liquidity variable, it will increase the Tax Avoidance value by 0.007 assuming all variables are fixed or constant. Third, the coefficient value of the Capital Intensity (X2) variable is positive at 0.047. This implies that if there is an increase of one unit in the Capital Intensity variable, it will increase the Tax Avoidance value by 0.047 assuming all variables are fixed or constant. Fourth, the coefficient value of the Inventory Intensity (X3) variable is positive at 0.037. This implies that if there is an increase of one unit in the Inventory Intensity variable, it will increase the Tax Avoidance value by 0.037 assuming all variables are fixed or constant. Fifth, the coefficient value of the control variable Leverage (X4) is positive at 0.018. This implies that if there is an increase of one unit in the Leverage variable, it will increase the Tax Avoidance value by 0.018 assuming all variables are fixed or constant. Sixth, the coefficient of Profitability control variable (X5) is positive at 0.123. This implies that if there is an increase of one unit in the Profitability variable, it will increase the Tax Avoidance value by 0.123 assuming all variables are fixed or constant.
Hypothesis
testing
Partial
Coefficient Test (T Test)
|
Table 9 Partial Coefficient Test (T Test) |
||||||
|
Unstandardized Coefficients |
Standardized Coefficients |
|||||
|
Model |
B |
Std. Error |
Beta |
T |
Sig. |
|
|
1 |
(Constant) |
,187 |
0.015 |
12,429 |
,000 |
|
|
X1_LIKUID |
,007 |
,003 |
,361 |
2,657 |
,009 |
|
|
X2_CI |
0.047 |
0.015 |
,363 |
3,214 |
,002 |
|
|
X3_II |
,037 |
,026 |
,152 |
1,450 |
,150 |
|
|
X4_LEV |
0.018 |
,006 |
,385 |
2,917 |
,004 |
|
|
X5_PROFIT |
,123 |
,065 |
,207 |
1,874 |
,064 |
|
|
a. Dependent Variable: Y_TA |
||||||
|
Source: Secondary Data processed, 2021 |
||||||
Based on Table 9, the conclusions that can be drawn are as follows:
First, the Liquidity variable has a t count of 2,657 and a t table of 1,984 so that t count > t table is 2,657 > 1,984. The significance value of the Liquidity variable is 0.009 which is smaller than 0.05. Thus, H1 is accepted, which means that liquidity has a positive effect on tax avoidance. Second, the Capital Intensity variable has a t count of 3.214 and a t table of 1.984 so that t count > t table is 3.214 > 1.984. The significance value of the Capital Intensity variable is 0.002 which is smaller than 0.05. Thus, H2 is accepted, which means that capital intensity has a positive effect on tax avoidance. Third, the Inventory Intensity variable has a t count of 1.450 and a t table of 1.984 so that t count < t table is 1.450 < 1.984. The significance value of the Inventory Intensity variable is 0, 150 is greater than 0.05. Thus, H3 is rejected, which means that inventory intensity has no effect on tax avoidance. Fourth, the Leverage control variable has a t count of 2,917 and a t table of 1,984 so that t count > t table is 2,917 > 1,984. The significance value of the Leverage variable is 0.004 which is smaller than 0.05. Thus, leverage has an effect on tax avoidance. Fifth, the control variable Profitability has a t count of 1.874 and a t table of 1.984 so that t count < t table is 1.874 < 1.984. The significance value of the Profitability variable is 0.064, which is greater than 0.05. Thus, profitability has no effect on tax avoidance. Fourth, the Leverage control variable has a t count of 2,917 and a t table of 1,984 so that t count > t table is 2,917 > 1,984. The significance value of the Leverage variable is 0.004 which is smaller than 0.05. Thus, leverage has an effect on tax avoidance. Fifth, the control variable Profitability has a t count of 1.874 and a t table of 1.984 so that t count < t table is 1.874 < 1.984. The significance value of the Profitability variable is 0.064, which is greater than 0.05. Thus, profitability has no effect on tax avoidance. Fourth, the Leverage control variable has a t count of 2,917 and a t table of 1,984 so that t count > t table is 2,917 > 1,984. The significance value of the Leverage variable is 0.004 which is smaller than 0.05. Thus, leverage has an effect on tax avoidance. Fifth, the control variable Profitability has a t count of 1.874 and a t table of 1.984 so that t count < t table is 1.874 < 1.984. The significance value of the Profitability variable is 0.064, which is greater than 0.05. Thus, profitability has no effect on tax avoidance. Thus, leverage has an effect on tax avoidance. Fifth, the control variable Profitability has a t count of 1.874 and a t table of 1.984 so that t count < t table is 1.874 < 1.984. The significance value of the Profitability variable is 0.064, which is greater than 0.05. Thus, profitability has no effect on tax avoidance. Thus, leverage has an effect on tax avoidance. Fifth, the control variable Profitability has a t count of 1.874 and a t table of 1.984 so that t count < t table is 1.874 < 1.984. The significance value of the Profitability variable is 0.064, which is greater than 0.05. Thus, profitability has no effect on tax avoidance.
Model
Feasibility Test (F Test)
|
Table 10 Model Feasibility Test (F Test) |
||||||
|
Model |
Sum of Squares |
df |
Mean Square |
F |
Sig. |
|
|
1 |
Regression |
,008 |
5 |
,002 |
3,599 |
,005b |
|
Residual |
0.042 |
100 |
,000 |
|||
|
Total |
0.05 |
105 |
||||
|
a Dependent Variable: Y_TA |
||||||
|
b Predictors: (Constant), X5_PROFIT, X3_II,
X4_LEV, X2_CI, X1_LIKUID |
||||||
|
Source: Secondary Data processed, 2021 |
||||||
Based on Table 10, it can be seen that the calculated F value is 3.599, which means the calculated F value > F table because the value obtained from the F table is 2.31 so that it is 3.599 > 2.31. Furthermore, seen from the significance value of 0.005 indicates 0.005 <0.05. So, it can be concluded that the independent variables consisting of Liquidity, Capital Intensity and Inventory Intensity and control variables consisting of Leverage and Profitability are able to affect Tax Avoidance. That is, the variables in this study were declared suitable for use or included in the research model.
Coefficient of
Determination (R2)
|
Table 11 Coefficient of Determination (R2) |
||||
|
Model |
R |
R Square |
Adjusted R Square |
Std. Error of the Estimate |
|
1 |
,391a |
,153 |
,110 |
0.0205794 |
|
a Predictors: (Constant), X5_PROFIT, X3_II, X4_LEV,
X2_CI, X1_LIKUID |
||||
|
b Dependent Variable: Y_TA |
||||
|
Source: Secondary Data processed, 2021 |
||||
Based on Table 11, it can be seen that the value of Adjusted R Square is 0.110 or 11%. This means that the ability of the independent variable consisting of Liquidity, Capital Intensity, and Inventory Intensity can explain the effect on the dependent variable, namely Tax Avoidance of 11%. While the remaining 89% (100% - 11%) was influenced by other independent variables that were not included in this study.
5. DISCUSSION
Effect of
Liquidity on Tax Avoidance
As can be seen in Table 10 that the significant level of the liquidity variable is 0.009 or less than 0.05 with a coefficient value of 0.007 so that the first hypothesis is accepted with the conclusion that liquidity has a positive and significant effect on tax avoidance. Liquidity is a measure of the company's ability to meet its short-term obligations. Liquidity has a positive effect on tax avoidance, meaning that the higher the level of liquidity of a company, the higher the company's conduct of tax avoidance. With large corporate profits, of course, the company gets a large income tax burden, so the company will tend to take tax avoidance actions by doing earnings management. This also happens because the lower level of liquidity of a company indicates that the company's performance has poor cash flow so it is difficult to pay its current debt and will be negligent in paying the tax burden and tend to take tax avoidance actions. The results of this study are in line with research conducted by Abdullah (2020) and Budianti and Curry (2018) who said that liquidity had a positive effect on tax avoidance.
Effect of Capital Intensity on Tax Avoidance
As shown in Table 10, the significant level of the capital intensity variable is 0.002 or less than 0.05 with a coefficient value of 0.047 so that the second hypothesis is accepted with the conclusion that capital intensity has a positive and significant effect on tax avoidance. Capital intensity or capital intensity describes how much the company's assets are invested in fixed assets Artinasari and Mildawati (2018). Capital intensity has a positive effect on tax avoidance, meaning that the higher the value of the capital intensity of a company, the higher the level of tax avoidance by the company. This happens because the company uses fixed assets as a form of capital investment because almost all fixed assets will experience depreciation every year. The company will maximize the number of fixed assets owned by the company to obtain a low tax burden, because companies with large capital intensity have a large depreciation expense as well. Later, the depreciation expense will increase the company's expenses and reduce the amount of profit before tax of the company.
The results of this study are in line with research conducted by Anindyka et al. (2018) which states that capital intensity has a positive effect on tax avoidance. In addition, the results of this study also support research conducted by Dwiyanti and Jati (2019) as well as Artinasari and Mildawati (2018) which says that the higher the level of capita intensity of a company, the higher the tax avoidance taken by a company.
Effect of
Inventory Intensity on Tax Avoidance
As shown in Table 10, the significant level of the inventory intensity variable is 0.150 or more than 0.05 with a coefficient value of 0.037 so that the third hypothesis is rejected with the conclusion that inventory intensity has no effect on tax avoidance. Inventory intensity describes how a company invests its wealth in the form of inventory Syamsuddin and Suryarini (2020). Inventory is one of the most important assets in an entity, whether retail, manufacturing, service, or other entities. Companies with large inventories have more costs for transportation costs, warehouse costs, maintenance costs and storage costs so that the total burden borne by the company will increase. Based on the results of this study, the additional costs incurred on the inventory cannot influence the company to take tax avoidance actions. This can be seen from the average inventory intensity of the sample companies in this study which is quite low, which is 18.9%. Of the 106 samples used, it is known that only 1 company with an inventory intensity ratio value of above 40%, namely PT Trisula Textile Industries Tbk (BELL). Therefore, based on the sample of companies in this study, the additional costs incurred as a result of companies investing in inventory do not really affect the value of the company's income tax burden. And based on the sample data of companies in this study, companies invest more in the form of fixed assets.
The results of this study are in line with research conducted by Indriyanti and Setiawan (2019), which states that the inventory intensity ratio has no effect on tax avoidance. In addition, the results of this study also support research conducted by Artinasari and Mildawati (2018) which says that the greater or less the inventory intensity does not significantly affect tax avoidance. This happens because there is no tax intensive for companies with large inventories in the Taxation Law.
The Effect of
Leverage as a Control Variable on Tax Avoidance
As can be seen in Table 10 that the significant level of the leverage variable is 0.004 or less than 0.05 with a coefficient value of 0.018 so it can be concluded that leverage has a positive effect on tax avoidance. The leverage ratio or also known as the solvency ratio is the ratio used to measure the extent to which the company's assets are financed by debt Cashmere (2012). Positive results indicate that the relationship between leverage and tax avoidance is unidirectional, which means that the higher the debt to finance the company's assets, the higher the company's tax avoidance actions. Companies that use a lot of debt in financing their assets have an increasing interest expense arising from the use of these debts. Interest expense becomes one of the deductions from pre-tax profit, so the greater the company's interest expense, the lower the profit before tax and will have an impact on the lower tax burden paid by the company as well.
The results of this study are in line with research conducted by Abdullah (2020) which states that leverage has a partially significant effect on tax avoidance. In addition, the results of this study also support research conducted by Alam and Fidiana (2019) as well as Sinaga and Suardikha (2019) which says that the greater the level of debt used to finance assets, the greater the level of tax avoidance.
The Effect of
Profitability as a Control Variable on Tax Avoidance
As can be seen in Table 10 that the significant level of the profitability variable is 0.064 or more than 0.05 with a coefficient value of 0.123 so it can be concluded that profitability has no effect on tax avoidance. according to Cashmere (2012), profitability ratio is a ratio to measure the company's ability to seek profit. In this study, the high and low profitability of a company does not affect the company to do or not to take tax avoidance actions. Companies that have a high profitability value indicate the company's ability to earn very good profits and is effective and efficient in utilizing its assets so that the company is able to meet the company's expenses including paying the company's tax burden. This means that companies with high profitability values prefer to pay the tax burden rather than take tax avoidance actions because tax avoidance is an action that has a high risk.
The results of this study are in line with research conducted by Fatimah et al. (2021) which states that profitability has no effect on tax avoidance. In addition, the results of this study also support research conducted by Marlinda et al. (2020), Artinasari and Mildawati (2018), as well as Sarasati and Asyik (2018) which says that the higher the level of profitability of a company, the company will tend to choose to pay its tax burden and avoid tax avoidance because it is a risky activity.
6. CONCLUSION
Based on the results of testing and discussion of the effect of liquidity, capital intensity and inventory intensity on tax avoidance in manufacturing companies listed on the Indonesia Stock Exchange for the 2017-2019 period, the researchers conclude that: (1) The liquidity variable has a positive effect on tax avoidance because it has a significant value. smaller than the value of that has been set, namely 0.009 < 0.05. That is, the higher the level of liquidity of a company, the higher the company's tax avoidance actions. (2) The variable capital intensity has a positive effect on tax avoidance because it has a significance value smaller than the value that has been determined, namely 0.002 < 0.05. It means, the higher the value of the capital intensity of a company due to using fixed assets as a form of capital investment, the higher the level of tax avoidance by the company. (3) The inventory intensity variable has no effect on tax avoidance because it has a significance value greater than the value that has been determined, namely 0.150 > 0.05. This means that tax avoidance measures are not affected by additional costs arising from companies investing in inventories, because they do not really affect the value of the company's income tax burden. (3) The inventory intensity variable has no effect on tax avoidance because it has a significance value greater than the value that has been determined, namely 0.150 > 0.05. This means that tax avoidance measures are not affected by additional costs arising from companies investing in inventories, because they do not really affect the value of the company's income tax burden. (3) The inventory intensity variable has no effect on tax avoidance because it has a significance value greater than the value that has been determined, namely 0.150 > 0.05. This means that tax avoidance measures are not affected by additional costs arising from companies investing in inventories, because they do not really affect the value of the company's income tax burden.
Managerial
Implications
The managerial implications based on the results of research that have been carried out as well as discussions and conclusions obtained are as follows: (1) For companies, especially manufacturing companies listed on the Indonesia Stock Exchange, to be more careful and wiser in making decisions related to tax planning, especially regarding tax actions. avoidance. Companies are expected to continue to fulfill their obligations as corporate taxpayers, because tax avoidance measures have a high risk with tax administration sanctions and in the long term can affect the company's reputation. (2) For the government, especially the Directorate General of Taxes, to further narrow the space for companies to take tax avoidance actions by evaluating the effectiveness of existing tax regulations in order to provide clearer legal certainty and strict sanctions, so that state revenues from taxes can be more optimal. (3) For further researchers, it is recommended to be able to add other independent variables that can affect tax avoidance because in this study it only has an R-Square value of 0.110 or 11%. The remaining 89% is explained by other variables outside the research model such as company size, company age, profit growth, corporate governance and others.
REFERENCES
Abdullah, I. (2020). Effect of Liquidity and Leverage on Tax Avoidance in Food and Beverage Companies. Journal of Accounting and Business Research, 20(1), 16-22.
Alam, MH, & Fidiana. (2019). The Effect of Earnings Management, Liquidity, Leverage and Corporate Governance on Tax Avoidance. Journal of Accounting Science and Research, 8(2), 2460-2585.
Anggriantari, CD, & Purwantini, AH (2020). Effect of Profitability, Capital Intensity, Inventory Intensity, and Leverage on Tax Avoidance. Business and Economics Conference in Utilization of Modern Technology, 137-153.
Anindyka, D., Pratomo, D.,
& Kurnia. (2018). The Effect of Leverage (DAR),
Capital Intensity and Inventory Intensity on Tax Avoidance (Study on Food and
Beverage Companies on the Indonesia Stock Exchange (IDX) 2011-2015).
E-Proceedings of Management, 5(1), 713-719. Retrieved from https://openlibrarypublications.telkomuniversity.ac.id/index.php/management/article/view/6290
Artinasari, N., & Mildawati, T. (2018). The Effect of Profitability, Leverage, Liquidity, Capital Intensity, and Inventory Intensity on Tax Avoidance. Journal of Accounting Science and Research, 5(1), 713-719.
Budianti, S., & Curry, K. (2018). The Effect of Profitability, Liquidity, and Capital Intensity on Tax Avoidance. Proceedings of the 4th National Seminar on Scholars, Jakarta.
Cashmere (2012). Financial Statement Analysis. Press Eagle. Jakarta
Dharma, NBS, & Noviari, N. (2017). The Influence of Corporate Social Responsibility and Capital Intensity on Tax Avoidance. Udayana University Accounting E-Journal, 18(1), 529-556.
Dwiyanti, IAI, & Jati, IK (2019). The Effect of Profitability, Capital Intensity, and Inventory Intensity on Tax Avoidance. Udayana University Accounting E-Journal, 27(3), 2293-2321. Retrieved from https://doi.org/10.24843/EJA.2019.v27.i03.p24
Fatimah, AN, Nurlaela, S., & Siddi, P. (2021). The Effect of Company Size, Profitability, Leverage, Capital Intensity and Liquidity on Tax Avoidance in Food and Beverage Companies Listed on the Stock Exchange en 2015-2019. EKOMBIS REVIEW : Scientific Journal of Economics and Business, 9(1). Retrieved from https://doi.org/10.37676/ekombis.v9i1.1269
Indriyanti, KD, & Setiawan, PE (2019). The Effect of Management Compensation, Inventory Intensity Ratio, and Profitability on Tax Avoidance. Udayana University Accounting E-Journal, 27, 1546. Retrieved from https://doi.org/10.24843/EJA.2019.v27.i02.p27
Kurniati, D. (2021). 2020 Tax Revenue Minus 19.7%. DDTCNews. https://news.ddtc.co.id. Retrieved March 15, 2021.
Marlinda, DE, Titisari, KH, & Masitoh, E. (2020). Effect of GCG, Profitability, Capital Intensity, and Company Size on Tax Avoidance. 4(1), 39-47. Retrieved from https://doi.org/10.33087/ekonomis.v4i1.86
Muzakki, MR, & Darsono. (2015). The Influence of Corporate Social Responsibility and Capital Intensity on Tax Avoidance. Diponegoro Journal of Accounting, 4(3), 1-8.
Nasution, KMP, & Mulyani, SD (2020). The Effect of Fixed Asset Intensity and Inventory Inventory on Tax Avoidance with Sales Growth as Moderating Variable. Proceedings of the National Expert Seminar, 2, 1-7.
Nur, M., & Subardjo, A. (2020). Effect of Good Corporate Governance Mechanism, Profitability, Leverage and Company Size on Tax Avoidance. Journal of Accounting Science and Research, 9(6).
Rifai, A., & Atiningsih, S. (2019). Effect of Leverage, Profitability, Capital Intensity, Earnings Management on Tax Avoidance. ECONBANK : Journal of Economics and Banking, 1(2), 135-142. Retrieved from https://doi.org/10.35829/econbank.v1i2.48
Sarasati, DH, & Asyik, NF (2018). Effect of Good Corporate Governance, Profitability, Liquidity, and Company Size on Tax Avoidance. Journal of Accounting Science and Research, 7(1), 131-138.
Sinaga, CH, & Suardikha, IMS (2019). Effect of Leverage and Capital Intensity on Tax Avoidance with Proportion of Independent Commissioners a Moderating Variable. Udayana University Accounting E-Journal, 27(1), 1-32. Retrieved from https://doi.org/10.24843/EJA.2019.v27.i01.p01
Sugiyono. (2014). Qualitative Quantitative Research Methods and R&D. Alphabet. Bandung.
Syamsuddin, M., & Suryarini, T. (2020). Analysis of the Effect of Capital Intensity, Inventory Intensity, Independent Commissioner and Managerial Ownership on ETR. Journal of Economics and Business Research, 5(1), 52-65 Retrieved from https://doi.org/10.33633/jpeb.v5i1.2707
 This work is licensed under a: Creative Commons Attribution 4.0 International License
© Granthaalayah 2014-2021. All Rights Reserved.