BIOLOGICAL SEXUAL PROFILE BASED ON LINEAR DIMENSIONS OF HUMERI AND FEMURS OF ADULT BRAZILIAN HUMAN SKELETONSEvelyne Pessoa Soriano 1
|
|
||
|
|
|||
|
Received 15 September 2021 Accepted 15 October 2021 Published 31 October 2021 Corresponding Author Evelyne
Pessoa Soriano, evelyne.soriano@upe.br DOI 10.29121/granthaalayah.v9.i10.2021.4346 Funding:
This
research received no specific grant from any funding agency in the public,
commercial, or not-for-profit sectors. Copyright:
© 2021
The Author(s). This is an open access article distributed under the terms of
the Creative Commons Attribution License, which permits unrestricted use, distribution,
and reproduction in any medium, provided the original author and source are
credited.
|
ABSTRACT |
|
|
|
This
research aimed to assess the predictive ability and applicability for sexual
diagnosis of algorithms developed from measurements of humeri and femurs from
skeletons belonging to the CEAF Identified Skeletal Collection of the
University of Pernambuco, Brazil. The sample was composed of 483 humeri and
452 femurs, obtained from 401 skeletons, 208 male and 193 female, with ages
ranging from 15 to 109 years. The variables used were the transverse and
vertical diameters of the humeral and femoral heads and the epicondylar width
of these bones. The data collected were analyzed using R software (version
3.6.1, R Foundation for Statistical Computing). Only the univariate logistic
regressions were considered predictive, making it possible to estimate sex
based on any single variable in this study. The accuracy ranged from 93.8% to
97.5% for the humerus evaluation and from 92.9% to 95.6% for femurs, with the
transverse diameter of the right humeral head being the most dimorphic
measurement. Therefore, it is inferred that the sexual dimorphism presents in
the measurements of the humeri and femurs of our sample is high and enables
the classification of sex reliably and assertively using the algorithms
created. |
|
||
|
Keywords: Human
Identification, Forensic Anthropology, Sexual Dimorphism, Sex Determination
Analysis, Humerus, Femur 1. INTRODUCTION Forensic
anthropological investigations on skeletonized human remains aim to identify
and classify biological patterns through a process known as anthropological
identification Torimitsu et al.
(2016), classically
categorizing human skeletons regarding ancestry, sex, age, and stature, thus
establishing the biological profile Navega et al. (2015). This step makes
it possible to establish identity or direct the identification process Canãdas and Gonzalo
(2021). The pelvis and the skull
are body structures traditionally used for sex estimation, and the other
bones are considered subsidiary for this purpose, especially if the pelvis is
present, complete, and intact Arbenz (1988), Couto (2011), Soni et al. (2013), Torimitsu et al.
(2016), Ogedengbe et al.
(2017), since it has
the highest sexual dimorphism, regardless of the population studied Murail et al. (2005), Quatrehomme
et al. (2016), Brůžek et al.
(2017). However, only
damaged, fragmented, or incomplete bones may be available in forensic
practice due to taphonomic phenomena, such as the action of cadaveric fauna |
|
||
Zapico and Adserias-Garriga (2021). Bones rich in sexual characteristics, such as the pelvis, are fragile and therefore more susceptible to damage due to the thin bone cortices that compose them. Furthermore, these structures may not be present in a sample Thompson and Black (2007), Spradley and Jantz (2011), Chiba et al. (2018).
On the other hand, denser, robust, resistant, and tubular bone elements, such as the long bones, have greater chances of being in a better state of preservation than the pelvis and the skull Spradley and Jantz (2011), Masotti et al. (2013), Carvallo and Retamal (2020). Thus, the anthropological study of bone with a greater expectation of perenniality has increased, and long bones are among the most actively studied for sex assessment Siddiqi and Norrish (2018).
Since the demands and samples in Forensic Anthropology are varied, the consolidation of new methodologies for sexual diagnosis is a necessity, and, therefore, different anatomical sites have been studied for sexual diagnosis in human bones. Thus, the present study evaluates the sexual predictive capacity of algorithms developed through measurements of humeri and femurs of contemporary identified skeletons from the CEAF Identified Skeletal Collection of the University of Pernambuco, Northeast of Brazil.
2. MATERIALS AND METHODS
This research aimed to assess the predictive capacity for sex diagnosis of algorithms based on logistic regression to indicate the true positives in a sample composed of humeri and femurs. A blind diagnostic accuracy study was performed, and it is linked to the research project 'Metric analysis of long bones for sex estimation in the Brazilian population', which the Research Ethics Committee approved under Opinion No. 4.081.061 - CAAE: 28215019.6.0000.5207.
The sample consisted of a total of 483 humeri and 452 femurs, being 363 humeri and 343 left femurs and 120 humeri and 109 right femurs, obtained from 401 skeletons selected among the 427 ones belonging to the Identified Skeletal Collection of the Center for Studies in Forensic Anthropology (CEAF), University of Pernambuco (UPE), Brazil Cunha et al. (2018), Carvalho et al. (2020).
A total of 208 male and 193 female skeletons were used, with ages ranging from 15 to 109 years (mean of approximately 70.2 years for women and 58.3 years for men). Humeri and femurs that presented incomplete epiphyseal consolidation were excluded from the sample (once this is a characteristic of bone growth in progress), or those whose anatomical sites of interest were impaired by taphonomy, trauma, malformations, prostheses, or extensive or severe pathologies.
The set of metric variables in this study is linked to the methodological parameters established by Gonçalves (2014), Buikstra and Ubelaker (1995), and the contributions made by Alunni-Perret Staccini and Quatrehomme (2008). Thus, the vertical and horizontal dimensions of the humeral and femoral heads and their epicondylar width were used as a basis. The definition and representation of these measurements are shown in Table 1 and Figure 1, respectively.
|
Table 1 Quantitative variables used and their corresponding definition |
|||
|
Quantitative variables |
Definition |
Lateralization |
|
|
|
|
Right |
Left |
|
Transverse humeral head diameter (THHD) Gonçalves
(2014) Figure 1A |
Greater
anteroposterior distance of the humeral head. |
RTHHD |
LTHHD |
|
Humeral head
vertical diameter (HHVD) Gonçalves
(2014) Figure 1B |
The largest
dimension of the humeral head, when considered in the same direction as the
long bone axis. |
RHHVD |
LHHVD |
Humeral epicondylar width (HEW)Gonçalves
(2014) Figure 1C |
Distance
from the medial epicondyle to the lateral epicondyle. |
RHEW |
LHEW |
Transverse
femoral head diameter (TFHD).
Gonçalves
(2014) Figure 1D |
The greater
anteroposterior distance of the femoral head. |
RTFHD |
LTFHD |
Vertical femoral head diameter (VFHD)Gonçalves
(2014) Figure 1E |
The largest
dimension of the head, when considered in the same direction as the long bone
axis. |
RVFHD |
LVFHD |
Epichondylar femoral width (EFW)Alunni-Perret Quatrehomme (2008) Figure 1F |
Distance
from the medial epicondyle to the lateral epicondyle. |
REFW |
EFWW |
|
|
|
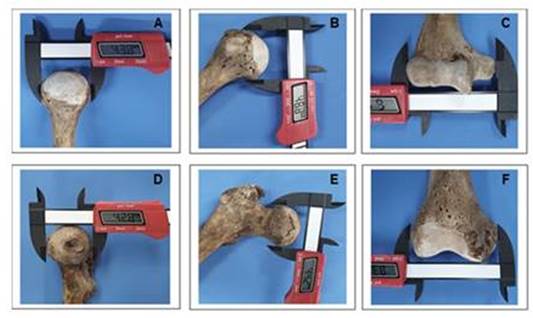
Figure 1 Humeral and femoral variables.
A) Transverse humeral head diameter; B) Humeral head vertical diameter; C)
Humeral epicondylar width; D) Transverse femoral head diameter; E) Vertical
femoral head diameter; F) Epichondylar femoral width. |
As recommended by Martin annd Saller (1957), each variable was measured three times with the aid of a 150 mm universal digital caliper, and the mean of the values obtained was recorded in millimeters, to one decimal place, for statistical analysis. The same examiner performed two examinations at each anatomical site of interest, with a minimum of seven days between the first and second measurements. The agreement could be verified using the intraclass correlation coefficient (ICC), as shown in Table 2.
|
Table 2 Intraobserver agreement analysis to evaluate the reproducibility of humerus and femur measurements |
|||
|
Variables |
|
Intraobserver |
|
|
N |
ICC [95%CI] |
P-value |
|
|
THHD |
10 |
0.999 [0.996-1.000] |
<0.001 |
|
HHVD |
10 |
0.999 [0.994-1.000] |
<0.001 |
|
HEW |
10 |
0.999 [0.992-1.000] |
<0.001 |
|
TFHD |
10 |
0.999 [0.995-1.000] |
<0.001 |
|
VFHD |
10 |
0.997 [0.986-0.999] |
<0.001 |
|
EFW |
10 |
0.999 [0.998-1.000] |
<0.001 |
|
ICC =
intraclass correlation coefficient; CI = confidence interval; P = probability
of significance. N = number of individuals evaluated. |
|||
Data Analysis
The data collected were analyzed using R software (version 3.6.1, R Foundation for Statistical Computing). The parameters of interest of the humerus and femur, on both sides, were compared between sexes by the t-Student test, after the analysis of normality distribution by Shapiro-Wilk and Kolmogorov-Smirnov tests. Sequentially, quantitative variables were evaluated as an individual (unadjusted analyses) and combined (adjusted analyses) sex estimators.
Multivariate (adjusted) analyses were not possible because when statistical checks were performed with more than one variable of interest, they did not result in predictive models (p>0.05) for all analyses. So, only the individual analyses of each variable were completed and evaluated for predictive power by analyzing the area under the ROC curve (Receiver Operating Characteristic Curve).
Univariate logistic regression was used to analyze the parameters as sex estimators, with the reference category being female sex (Female sex = 0; Male sex = 1). The adequacy of these models was assessed using the deviance parameter and the deviance < reference chi-square analysis and the hit rates (PPV = Positive Predictive Value and NPV = Negative Predictive Value). A significance level of 5% (p = 0.05) was adopted for all analyses.
3. RESULTS
The intraclass correlation index (ICC) values obtained based on measurements of a total of 10 humeri and 10 femurs, on both sides and in equal numbers, ranged from 0.997 to 0.999, indicating excellent intraobserver agreement.
It was observed, in all variables, differences in the means of the measurements between male and female sexes (p<0.05), with dimensional prevalence in structures of male subjects compared to females. The results of the t-Student test showed that in both sexes, only the DTCU variable showed average dimensional symmetry between sides (Table 3).
|
Table 3 Distribution of the values obtained for the measurements in each variable and comparison between female and male sexes |
||||||
|
Mean * |
Standard
deviation |
Minimun |
Maximun |
p-value ** |
||
|
RTHHD |
Female |
36.33 A |
2.11 |
32.4 |
41.6 |
<0.001 |
|
|
Male |
42.68 G |
2.19 |
36.9 |
46.4 |
|
|
HHVDD |
Female |
39.60 B |
2.81 |
34.4 |
46.6 |
<0.001 |
|
|
Male |
46.36 H |
2.45 |
39.4 |
53.8 |
|
|
HEWD |
Female |
53.78 C |
4.03 |
43.4 |
65.2 |
<0.001 |
|
|
Male |
62.30
I |
3.56 |
54 |
70.1 |
|
|
RTFHD |
Female |
39.81 D |
2.87 |
33.7 |
45.6 |
<0.001 |
|
|
Male |
45.52 J |
2.6 |
39.7 |
51.5 |
|
|
RVFHD |
Female |
39.80 E |
2.9 |
33.2 |
45.9 |
<0.001 |
|
|
Male |
45.67 K |
2.52 |
41.2 |
53.2 |
|
|
REFW |
Female |
72.68 F |
4.2 |
59.3 |
81.2 |
<0.001 |
|
|
Male |
81.64 L |
4.41 |
70.4 |
92.6 |
|
|
LTHHD |
Female |
36.35 A |
2.05 |
31.7 |
43.8 |
<0.001 |
|
|
Male |
42.56 G |
2.15 |
35.7 |
48 |
|
|
LHHVD |
Female |
39.35 B |
2.33 |
34.4 |
47.3 |
<0.001 |
|
|
Male |
45.94 h |
2.49 |
37.8 |
53.1 |
|
|
HEWE |
Female |
53.27 C |
3.46 |
43.9 |
65.3 |
<0.001 |
|
|
Male |
61.63 i |
3.83 |
49.8 |
72.5 |
|
|
LTFHD |
Female |
39.51 d |
2.33 |
34.3 |
47.7 |
<0.001 |
|
|
Male |
45.48
J |
2.49 |
37.9 |
54.1 |
|
|
LVFHD |
Female |
39.84
e |
2.39 |
34.6 |
47.9 |
<0.001 |
|
|
Male |
45.87 K |
2.49 |
37.8 |
54.1 |
|
|
EFWW |
Female |
72.25 F |
3.89 |
59.8 |
86.3 |
<0.001 |
|
|
Male |
81.54 l |
4.05 |
70.6 |
91.8 |
|
|
*Student's t-test. Equal letters of different sizes indicate a
statistical difference between right and left side measurements within the
same sex. ** Significance level = 5% |
||||||
All individual quantitative variables were predictive of sex, resulting in hits that ranged from 92.9% to 97.5%, and all univariate models were considered adequate for classification from the deviance < reference chi-square check (Table 4). Based on these parameters, cutoff points were determined for the measures of the variables and the probabilities generated by equations of each model (Table 5). Thus, values equal to or above the cutoff point classify the individual as male, and below, they classify the individuals as female.The accuracy ranged from 94.3% (HEWE) to 96.9% (LTHHD) in humerus and from 95.0% (EFWW) to 95.6% (LTFHD) in femur for the left side. For the right side, the respective accuracy rates were 93.8% (HEWD) to 97.5% (RTHHD) in the humerus and 92.9% (RTFHD) to 94.4% (RVFHD) in the femur. The transverse diameter of the right humeral head was the most dimorphic measurement in this population.
|
Table 4 Results for the prediction of sex from the variables of interest |
|||||
|
Variable |
Cutoff
p |
Cutoff
m |
AUC
(IC95%) |
Deviance |
Q-Q
reference |
|
RTHHD |
0.441 |
39.30 |
97,50%
(97,09 – 97,91) |
37.73 |
112.02 |
|
HHVDD
|
0.701 |
44.40 |
95.58%
(95.27 – 95.89) |
51.40 |
125.45 |
|
HEWD |
0.322 |
57.06 |
93.80%
(93.63 – 93.97) |
69.01 |
134.36 |
|
RTFHD |
0.552 |
42.93 |
92.90%
(92.59 – 93.21) |
58.72 |
109.77 |
|
RVFHD |
0.336 |
41.89 |
94.40%
(94.03 – 94.77) |
54.08 |
110.89 |
|
REFW |
0.418 |
76.66 |
93.10%
(92.91 – 93.29) |
61.54 |
118.75 |
|
LTHHD |
0.465 |
38.94 |
96.90%
(96.65 – 97.15) |
110.02 |
303.96 |
|
LHHVD |
0.620 |
42.87 |
96.30%
(96.11 – 96.49) |
142.36 |
345.66 |
|
HEWE |
0.587 |
57.74 |
94.30%
(94.21 – 94.39) |
213.63 |
396.75 |
|
LTFHD |
0.493 |
42.73 |
95.60%
(95.41 – 95.79) |
148.52 |
321.09 |
|
LVFHD |
0.508 |
43.20 |
95.50%
(95.31 – 95.69) |
153.27 |
326.44 |
|
EFWW |
0.581 |
78.06 |
95.00%
(94.89 – 95.11) |
169.41 |
339.26 |
|
Logistic regression. cutoff=cut-off
point of the value of the variable of interest. p = probability. m =
measurement in millimeters. AUC = Area Under Curve. CI95% = Confidence Interval
95%. Deviance = deviance function. Q-Q = Reference Chi-square.
Deviance<Reference chi-square = adequate model for prediction.
Significance level = 5%. |
|||||
|
Table 5 Equations for estimating the probabilities in predicting sex from each of the variables of interest |
|
|
Variable |
Prediction
Equations |
|
RTHHD |
P
(male) = 1/1+ e – (-41.51+1.05*RTHHD) |
|
HHVDD
|
P
(male) = 1/1+ e – (-36.89+0.86*HHVDD) |
|
HEWD |
P
(male) = 1/1+ e – (-30.42+0.52*HEWD) |
|
RTFHD |
P
(male) = 1/1+ e – (-32.85+0.77*RTFHD) |
|
RVFHD |
P
(male) = 1/1+ e – (-37.97+0.89*RVFHD) |
|
REFW |
P
(male) = 1/1+ e – (-39.43+0.51*REFW) |
|
LTHHD |
P
(male) = 1/1+ e – (-41.81+1.07*LTHHD) |
|
LHHVD |
P
(male) = 1/1+ e – (-38.53+0.91*LHHVD) |
|
HEWE |
P
(male) = 1/1+ e – (-33.14+0.58*HEWE) |
|
LTFHD |
P
(male) = 1/1+ e – (-39.77+0.94*LTFHD) |
|
LVFHD |
P
(male) = 1/1+ e – (-39.28+0.91*LVFHD) |
|
EFWW |
P
(male) = 1/1+ e – (-44.17+0.57*EFWW) |
|
e = Euler's constant (2.7182) |
|
The test's discriminant power was evaluated using positive and negative predictive values from the cutoff points' parameters. Thus, for the positive predictive value (PPV), related to sensitivity, males (category 1) were the outcome variable and had the assertiveness varying from 84.89% to 94.87% in the humerus and 81.59% to 98.0% in the femur. On the other hand, the negative predictive value (NPV), related to specificity, has female sex (category 0) as the outcome variable and had an accuracy rate ranging from 83.33% to 93.7% in the humerus and 77.5% to 93.43% in the femur (Table 6).
|
Table 6 Distribution
of subjects' ratings and hit rates from the generated cutoff points and comparison
with the actual ratings |
|||||
|
Variable |
Estimated
Classification |
Actual
Classification |
|
Predictive
values (%) |
|
|
|
|
Female |
Male |
PPV |
NPV |
|
RTHHD |
Female |
38 |
4 |
92.00% |
92.68% |
|
|
Male |
3 |
46 |
|
|
|
HHVDD |
Female |
42 |
10 |
82.75% |
93.33% |
|
|
Male |
3 |
48 |
|
|
|
HEWD |
Female |
40 |
6 |
90.75% |
83.33% |
|
|
Male |
8 |
57 |
|
|
|
RTFHD |
Female |
34 |
9 |
82.00% |
87.17% |
|
|
Male |
5 |
41 |
|
|
|
RVFHD |
Female |
31 |
1 |
98.00% |
77.50% |
|
|
Male |
9 |
49 |
|
|
|
REFW |
Female |
32 |
8 |
86.20% |
82.05% |
|
|
Male |
7 |
50 |
|
|
|
LTHHD |
Female |
102 |
8 |
94.87% |
91.89% |
|
|
Male |
9 |
148 |
|
|
|
LHHVD |
Female |
119 |
15 |
91.62% |
93.70% |
|
|
Male |
8 |
164 |
|
|
|
HEWE |
Female |
146 |
29 |
84.89% |
90.12% |
|
|
Male |
16 |
163 |
|
|
|
LTFHD |
Female |
120 |
17 |
88.81% |
91.60% |
|
|
Male |
11 |
135 |
|
|
|
LVFHD |
Female |
123 |
17 |
88.74% |
89.78% |
|
|
Male |
14 |
134 |
|
|
|
EFWW |
Female |
128 |
30 |
81.59% |
93.43% |
|
|
Male |
9 |
133 |
|
|
|
PPV=positive predictive value.
NPV=negative predictive value |
|||||
4. DISCUSSIONS
The presence of measurable structures of interest in 93.9% of the sample is expected, due to the robustness and consequent tendency to structural preservation of long bones, such as humerus and femur. Moreover, long bones meet the requirement of the practicality of identification methods, both by the ease of sorting these bone structures among the others and by the simplified process of obtaining measurements on the structures of interest Carvallo and Retamal (2020).
As in other studies, the logistic investigation showed that the mean measurements of the males' variables are higher than those of females, which allows us to infer that there is dimensional dimorphism in the anatomical structures investigated. The reasons for this discrepancy are genetic, labor, hormonal, and muscle mass particularities between men and women Steyn and Isçan (1997), Rauch et al. (2004), Frutos (2005), Forriol and Shapiro (2005), Rauch (2005), Alunni-Perret et al. (2008), Kranioti and Michalodimitrakis (2009), Soni et al. (2013), Ogedengbe et al. (2017), Carvallo and Retamal (2020), Chatterjee et al. (2020).
The statistically significant predictive models produced in this research are exclusively univariable. Therefore, it is possible to gather decisions regarding sex from each of the possible individual variables, but gathering more than one of them in a single model does not generate assertive decisions. Thus, the utility of these regressions as sex classifiers is enhanced since even in situations with few viable structures, the presence of only one measurable bone fraction can allow sex estimation. Similarly, Cuzzullin et al. (2020) observed that their best predictive indices were obtained when using isolated variables.
The cutoff points established for the measurements of all variables and the probabilistic results of the algorithms allow the diagnosis of sex with a high possibility of accuracy. The reliability of the models is reinforced by the results achieved for the positive and negative predictive values, which indicate the satisfactory sensitivity and specificity of the logistic regressions produced. In this study, the most dimorphic measure was RTHHD, and the least predictive was RTFHD.
The assertiveness of all logistic regressions in the present study is in accordance with the observations of Spradley and Jantz (2011) regarding the discriminative superiority of models generated from long bones concerning the predictive capacity of models obtained from cranial structures. It is inferred, therefore, that the long bones of this sample have more evident sexual metric particularities than the skull bones whose use in sexual diagnosis was once reputed to be more reliable Soni et al. (2013), so that, in the absence of the pelvis, humerus, and femur are configured as preferable alternatives to the skull.
The statistical investigation of both sides of the humerus and femur showed significant metric asymmetry between the HHVD, HEW, TFHD, VFHD, and EFW dimensions. This dimensional difference may result from a more significant imposition of mechanical forces applied to the bones on one side since most of the population is right-handed Papadatou-Pastou et al. (2019), and these stresses may increase bone growth, mass, and geometry Rauch et al. (2004), Forriol and Shapiro (2005), Rauch (2005), Zymbal et al. (2017).
Duckworth (1919) recommended that only the height of the acromion and greater trochanter concerning the ground be measured bilaterally, and the others, preferably on the left side. Therefore, comparing results with those of other studies will be based only on the indicated side. However, future research could standardize bilateral measurements in even structures for methodological validation in all available bones due to the global prevalence of right-handed individuals Papadatou-Pastou et al. (2019) and the specificity of metric methods Coma (1999), Gonçalves (2014), Siddiqi and Norrish (2018).
Studying the transverse diameter of the humeral head (CTHD) of 82 Portuguese individuals, Gonçalves (2014) obtained an accuracy rate of 85.7%, a result similar to that obtained for the Colombians Moore et al. (2016), which was 86.0%. Zapico and Adserias-Garriga (2021) developed statistical models in the European and Latin American samples with 83.0% and 73.0% accuracy, respectively. However, better metric dimorphisms were obtained in Indians Reddy and Doshi (2017), whose predictions were assertive between 97.0% and 84.0% for males and females, respectively, and by Fowller and Hughes (2018), with accuracy rates of 94.54% in the Guatemalan population.
Based on the humeral head vertical diameter (HHVD), accuracy rates in sex diagnosis of 88.4% and 89.9% were observed for the Portuguese Gonçalves (2014) and Greek Kranioti and Michalodimitrakis (2009), samples, respectively. The white South African population Ogedengbe et al. (2017) had a lower hit rate of 82.5% of European ancestry. The North American sample from the 19th and 2040 centuries generated algorithms with 93.7% and 96% accuracy for females and males, respectively, and the Central American population Frutos (2005) produced a discriminant function with 95.5% accuracy for both sexes.
The epicondylar width of the humerus (HEW) was considered statistically insignificant in the Colombian population Moore et al. (2016), in contrast to the present analysis findings. This variable produced correct sex classification of 85.7% and 85.1% in European populations, respectively for Portuguese Gonçalves (2014) and Cretans (Kranioti and Michalodimitrakis, 2009), and 87% in the samples studied by Zapico and Adserias-Garriga (2021). Boldsen et al. (2015) showed metric sexual dimorphism with an accuracy of 94.0 for females and 93.1% for males. In Latin American Zapico and Adserias-Garriga (2021) and Central American Frutos (2005) populations, the probability of correct diagnosis was 80.0% and 91.1%, respectively.
The metric sexual dimorphism of the transverse femoral head diameter (TFHD) of Portuguese specimens Gonçalves (2014) allowed the development of a discriminant function with an accuracy of 81.6%. Using the same method, the Chinese sample Isçan and Shihai (1995) presented an accuracy rate of 83.1%. The Colombian Moore et al. (2016) and Dutch Colman et al. (2018) populations presented 80.8% and 86.0% assertiveness, respectively.
The vertical femoral head diameter (VFHD), on the other hand, produced in the Indian population Soni et al. (2013) a hit rate of only 72.5% in Male’s femurs and 85% in Females. For this variable, Gonçalves (2014) correctly classified the sex in 82.9% of the cases, and Colman et al. (2018) obtained a 90% assertiveness rate for the same task in the Dutch population.
Although Soni et al. (2013) did not obtain statistically significant results for sex diagnosis based on epicondylar femoral width (EFW), other investigations have been successful in this same mission. In the Nepalese population Singh et al. (2016), only 68% of the bones were correctly classified, making it inadvisable to use this variable alone for sex diagnosis in that sample. Moore et al. (2016) observed that EFW was the most sexually characteristic femoral measurement in their specimens with 82.9%. A higher assertiveness of 94.9% and 95.4% were obtained from Chinese Isçan and Shihai (1995) and French Alunni-Perret et al. (2008) femurs, respectively. A comparison of the assertiveness rates for estimating the sex of each variable in this research with their counterpart measures in the cited studies shows that the highest hit rates were obtained in the algorithms produced based on the present samples of Northeastern Brazilians.
Carvallo and Retamal (2020) stated that the femur has evolutionary advantages in expressing sexual characteristics over the other long bones. For Albanese et al. (2008), this sexual dimorphism results from the relationship between the proximal epiphysis (femoral head) and the pelvis. However, in this study, all femoral variables showed similar probabilistic accuracy, suggesting no sexual dimorphism between the extremities. Moreover, contrary to the cited authors, we observed a higher probability of correct sex classification when made using humeral variables in our sample.
A practical contribution of the metric methods of sex diagnosis for forensic anthropology is establishing cutoff points based on measurements. In this study, the cutoff points were established for each variable in millimeters, from which a bone is classified as a male and below which it is estimated as a female. Despite the practicality of this information, the literature has been scarce for this parameter, usually presenting the cut points of each variable employing statistical functions or relations, whose interpretation and calculation are more complex.
The DTCU of European populations shows values for the section points from 39.3820 to 42.04511 millimeters. In Latin American populations, it ranged from 38.7311 to 42.9537 millimeters. In this study, a section points of 38.94 mm closer to the value found in the Latin American sample Zapico and Adserias-Garriga (2021) was found. The HHVD of the Portuguese population Gonçalves (2014) had a section point of 42.36 mm, which is a smaller dimensional reference than that obtained in this northeastern Brazilian sample, whose value was 42.87 mm. The HEW cutoff point for the Portuguese population Gonçalves (2014) was 56.63 millimeters, and for the Europeans studied by Zapico and Adserias-Garriga (2021), a lower value of 42.19 millimeters. In this investigation, this variable presented the cutoff point at 57.74 millimeters.
This variability in the dimensional values of the cutoff points highlights the population specificity of the metric methods for sex diagnosis since the measurements of bone structures can be influenced due to geographic and temporal aspects, different social and nutritional customs, and degrees of physical demands Coma (1999), Vick (2005), Frutos (2005), Stulp and Barrett (2016), Siddiqi and Norrish (2018), Colman et al. (2018), Maass and Friedling (2018), Musilová et al. (2019). Ancestry can also interfere in sex diagnosis, with metric similarities being registered in populations of the same ancestry Boldsen et al. (2015), an increase in assertiveness with the inclusion of this variable Maass and Friedling (2018), in addition to the relationship of bone length and thickness and robustness with characteristics specific to European and African descendants Spradley and Jantz (2011), Colman et al. (2018). Therefore, standardized formulas and regressions should not be carried from one population to another Alunni-Perret et al. (2008), under penalty of invalidating the results Frutos (2005).
In Brazilian research, Galvão and Vitoria (1996) developed a multivariate predictive model for sex based on the HHVD and VFHD variables, with accuracy rates ranging from 94% to 96.2% for northeastern females and males, respectively. Cuzzullin et al. (2020) studied femurs of contemporary Brazilians from the Southeast and obtained lower accuracy rates, ranging from 81.5% to 84.5%, for variables similar to the present study. In this case, the apparent decrease in dimorphism present cannot be attributed to chronological factors since Galvão and Vitoria (1996) did not characterize their sample in these terms, but only geographically.
All the variables investigated in our sample showed a degree of sexual differentiation higher than a Brazilian sample from the Southeast Cuzzullin et al. (2020). They were similar to the Northeastern sample previously studied Galvão and Vitoria (1996), even considering that the latter used multivariate analysis.
Moreover, the measurement of the section points found in the present analysis for femurs showed a higher value when compared to the results of Cuzzullin et al. (2020). Galvão and Vitoria (1996) reported only the RVFHD cutoff point of 42.8 millimeters, whose result is close to the 43.2 millimeters found in the homologous variable of this study. These findings ratify the linkage of the somatometric sex estimates to the sample studied.
5. CONCLUSIONS
The results obtained in this research allow us to infer a pronounced metric dimorphism in the sample studied, and all algorithms generated for sexual diagnosis presented hit rates similar to the highest hits found in other studies. Furthermore, the assertiveness of the logistic regressions produced on each variable isolated from humerus and femur is higher than that obtained using skulls, establishing these long bones as the structures of the first choice for sex diagnosis in the absence of the pelvis. However, considering the specificity of the methodologies of metric sex diagnosis and their accuracy linked to the populations studied and, in addition, the influence of factors such as ancestry and the recognized Brazilian miscegenation, nutrition, historical period, geography, and culture, it is suggested that the assertiveness of the algorithms produced in this study be checked in homologous measurements of other specimens available in Brazil.
6. CONFLICT OF INTEREST
The authors declare that there are no conflicts of interest.
REFERENCES
Albanese J, Eklics G, Tuck A. (2008) A metric method for sex determination using the proximal femur and fragmentary hipbone. J Forensic Sci;53:1283-8. Retrieved from https://doi.org/10.1111/j.1556-4029.2008.00855.x
Alunni-Perret V, Staccini P, Quatrehomme G. (2008) Sex determination from the distal part of the femur in a French contemporary population. Forensic Sci Int;175:113-7. Retrieved from https://doi.org/10.1016/j.forsciint.2007.05.018
Arbenz GO. (1988) Legal Medicine and Forensic Anthropology, São Paulo: Livraria Atheneu, , 562p.
Boldsen JL, Milner GR, Boldsen SK. (2015) Sex estimation from modern American humeri and femora, accounting for sample variance structure. Am J Phys Anthropol;158:745-50. Retrieved from https://doi.org/10.1002/ajpa.22812
Brůžek J, Santos F, Dutailly B, Murail P, Cunha E. (2017) Validation and reliability of the sex estimation of the human os coxae using freely available DSP2 software for bioarchaeology and forensic anthropology. Am J Phys Anthropol;164:440-9. Retrieved from https://doi.org/10.1002/ajpa.23282
Buikstra JE, Ubelaker DH. (1995) Standards for data collection from human skeletal remains, Edited by Jane E. Buikstra and Douglas H. Ubelaker, 272 pp. Fayetteville: Arkansas Archeological Survey Research Series No. 44, 1994. Am J Human Biol;7:672-672. Retrieved from https://doi.org/10.1002/ajhb.1310070519
Canãdas EV, Gonzalo JC. (2021) Identificación en el sujeto vivo. In: Calabuig, G. Medicina Legal y
Carvalho MVD, Lira VF, Nascimento EA, Kobayashi SBT, Araújo LF, Almeida AC, Petraki GGP, Cunha E, Soriano EP. (2020) New acquisitions of a contemporary Brazilian Identified Skeletal Collection. Forensic Sci Int: Reports;2:100050. Retrieved from https://doi.org/10.1016/j.fsir.2019.100050
Carvallo D, Retamal R. (2020) Sex estimation using the proximal end of the femur on a modern Chilean sample. Forensic Sci Int Reports ;2 :100077. Retrieved from https://doi.org/10.1016/j.fsir.2020.100077
Chatterjee PM, Krishan K, Singh RK, Kanchan Tanuj. (2020) Sex estimation from the femur using discriminant function analysis in a Central Indian population. Med Sci Law ;60 :112-21. Retrieved from https://doi.org/10.1177/0025802419900576
Chiba F, Makino Y, Torimitsu S, Motomura A, Inokuchi G, Ishii N, Hoshioka Y, Abe H, Yamaguchi R, Sakuma A, Nagasawa S, Saito H, Yajima D, Fukui Y, Iwase H. (2018) Sex estimation based on femoral measurements using multidetector computed tomography in cadavers in modern Japan. Forensic Sci Int;292:262.e1-262.e6. Retrieved from https://doi.org/10.1016/j.forsciint.2018.09.027
Colman K, Janssen MCL, Stull KE, van Rijn RR, Oostra RJ, de Boer HH, van der Merwe AE. (2018) Dutch population specific sex estimation formulae using the proximal femur. Forensic Sci Int;286:268.e1-268.e8. Retrieved from https://doi.org/10.1016/j.forsciint.2017.12.029
Coma JMR. (1999) Antropología Forense, 1, Ministério de Justiça, Centro de publicaciones,.
Couto RC. (2011) Medical Expertise & Forensic Odontology, Rio de Janeiro: Medbook.
Cunha E, Lopez-Capp TT, Inojosa R, Marques SR, Moraes LOC, Liberti E, Machado CEP, Paiva LAS, Francesquini Júnior L, Daruge Junior E, Almeida Junior E, Soriano E. (2018) The Brazilian identified human osteological collections. Forensic Sci Int;289:449.e1-449.e6. Retrieved from https://doi.org/10.1016/j.forsciint.2018.05.040
Cuzzullin MC, Curate F, Freire AR, Costa ST, Prado FB, Daruge Junior E, Cunha E, Rossi AC. (2020) Validation of anthropological measures of the human femur for sex estimation in Brazilians. Australian J Forensic Sci;1-14. Retrieved from https://doi.org/10.1080/00450618.2020.1729411
Duckworth WLH. (1919) The international agreement for the Unification of Anthropometric measurements to be made on the living subject. Report Of the commission appointed by the XIVth International Congress of prehistoric anthropology and archaeology at Geneva, to supplement the work commenced by the XIIIth Congress in the session at Monaco (1906). English translation of the official version. Am J Phys Anthropol 1919;2:61-7. Retrieved from https://doi.org/10.1002/ajpa.1330020114
Forriol F, Shapiro F. (2005) Bone development: interaction of molecular components and biophysical forces. Clin Orthop Relat Res;432:14-33. Retrieved from https://doi.org/10.1097/01.blo.0000156001.78631.e9
Fowler G, Hughes C. (2018) Development and Assessment of Postcranial Sex Estimation Methods for a Guatemalan Population. J Forensic Sci;63:490-6. Retrieved from https://doi.org/10.1111/1556-4029.13570
Frutos LR. (2005) Metric determination of sex from the humerus in a Guatemalan forensic sample. Forensic Sci Int;147:153-7. Retrieved from https://doi.org/10.1016/j.forsciint.2004.09.077
Galvão LCC, Vitoria EM. (1996) Determinação do sexo através do diâmetro vertical da cabeça do úmero e fêmur. Saúde, Ética & Justiça ;1:67-75. Retrieved from https://doi.org/10.11606/issn.2317-2770.v1i1p67-75
Gonçalves D. (2014) Evaluation of the effect of secular changes in the reliability of osteometric methods for the sex estimation of Portuguese individuals. Cad. GEEvH ;3:53-65.
Isçan MY, Shihai D. (1995) Sexual dimorphism in the Chinese femur. Forensic Sci Int ;74:79-87. Retrieved from https://doi.org/10.1016/0379-0738(95)01691-B
Kranioti EF, Michalodimitrakis M. (2009) Sexual dimorphism of the humerus in contemporary Cretans--a population-specific study and a review of the literature. J Forensic Sci;54:996-1000. Retrieved from https://doi.org/10.1111/j.1556-4029.2009.01103.x
Maass P, Friedling J. (2018) Morphometric analysis of the humerus in an adult South African cadaveric sample. Forensic Sci Int;289:451.e1-451.e9. Retrieved from https://doi.org/10.1016/j.forsciint.2018.04.037
Martin R, Saller K, (1957) Lehrbuch der anthropologie, Stuttgart, Gustav Fisher Verlag,.
Masotti S, Succi-Leonelli E, Gualdi-Russo E. (2013) Cremated human remains: is measurement of the lateral angle of the meatus acusticus internus a reliable method of sex determination? Int J Legal Med;127:1039-44. Retrieved from https://doi.org/10.1007/s00414-013-0822-y
Moore M, DiGangi EA, Ruíz FPN, Davila OJH, Medina CS. (2016) Metric Sex Estimation from the Postcranial Skeleton for the Colombian Population. Forensic Sci Int;262:286.e1-8. Retrieved from https://doi.org/10.1016/j.forsciint.2016.02.018
Murail P, Brůžek J, Houët F, Cunha E. DSP, (2005) A tool for probabilistic sex diagnosis using worldwide variability in hip-bone measurements. Bulletins et Mémoires de la Société d'Anthropologie de Paris;17:167-76. Retrieved from https://doi.org/10.4000/bmsap.1157
Musilová B, Dupej J, Brůžek J, Bejdová Š, Velemínská J. (2019) Sex and ancestry related differences between two Central European populations determined using exocranial meshes. Forensic Sci Int;297:364-369. Retrieved from https://doi.org/10.1016/j.forsciint.2019.02.034
Navega D, Vicente R, Vieira DN, Ross A, Cunha E. (2015) Sex estimation from the tarsal bones in a Portuguese sample: a machine learning approach. Int J Legal Med;129:651-59. Retrieved from https://doi.org/10.1007/s00414-014-1070-5
Ogedengbe OO, Ajayi SA, Komolafe OA, Zaw AK, Naidu ECS, Azu OO. (2017) Sex determination using humeral dimensions in a sample from KwaZulu-Natal: an osteometric study. Anat Cell Biol;50:180-86. Retrieved from https://doi.org/10.5115/acb.2017.50.3.180
Papadatou-Pastou M, Martin M, Munafò MR, Ntolka E, Ocklenburg S, Paracchini S. (2019) The prevalence of left-handedness: Five meta-analyses of 200 studies totaling 2,396,170 individuals. PsyArxiv. Apr 23. Retrieved from https://doi.org/10.1037/bul0000229
Quatrehomme G, Radomana I, Nogueira L, du Jardin P, Alunni V. (2016) Sex determination using the DSP (probabilistic sex diagnosis) method on the coxal Bone: Efficiency of method according to number of available variables. Forensic Sci Int;272:190-3. Retrieved from https://doi.org/10.1016/j.forsciint.2016.10.020
Rauch F, Bailey DA, Baxter-Jones A, Mirwald R, Faulkner R. (2004) The 'muscle-bone unit' during the pubertal growth spurt. Bone;34:771-5. Retrieved from https://doi.org/10.1016/j.bone.2004.01.022
Rauch F. (2005) Bone Growth in Length and Width: The Yin and Yang of Bone Stability. J Musculoskelet Neuronal Interact;5:194-201.
Reddy BB, Doshi MA. (2017) Sex determination from adult human humerus by discriminant function analysis. Int J Res Med Sci;5:3891-7. Retrieved from https://doi.org/10.18203/2320-6012.ijrms20173702
Siddiqi N, Norrish M. (2018) Sexual Dimorphism from Femoral Bone Dimensions Parameters among African Tribes and South Africans of European Descent. Int J Forensic Sci;3:000135. Retrieved from https://doi.org/10.23880/IJFSC-16000135
Singh PK, Karki RK, Palikh AK, Menezes RG. (2016) Sex Determination From the Bicondylar Width of the Femur: A Nepalese Study Using Digital X-ray Images. Kathmandu Univ Med J (KUMJ);14:198-201.
Soni G, Dhall U, Chhabra S. (2013) Determination of sex from humerus: discriminant analysis. Australian J Forensic Sci;45:147-52. Retrieved from https://doi.org/10.1080/00450618.2012.697917
Spradley MK, Jantz RL. (2011) Sex estimation in forensic anthropology: skull versus postcranial elements. J Forensic Sci;56:289-96. Retrieved from https://doi.org/10.1111/j.1556-4029.2010.01635.x
Steyn M, Isçan MY. (1997) Sex determination from the femur and tibia in South African whites. Forensic Sci Int;90:111-9. Retrieved from https://doi.org/10.1016/S0379-0738(97)00156-4
Stulp G, Barrett L. (2016) Evolutionary perspectives on human height variation. Biol Rev Camb Philos Soc;91:206-34. Retrieved from https://doi.org/10.1111/brv.12165
Thompson T, Black SM. (2007) Forensic human identification: an introduction, Boca Raton,; p. 544. Retrieved from https://doi.org/10.1201/9781420005714
Torimitsu S, Makino Y, Saitoh H, Sakuma A, Ishii N, Yajima D, Inokuchi G, Motomura A, Chiba F, Yamaguchi R, Hashimoto M, Hoshioka Y, Iwase H. (2016) Sex estimation based on scapula analysis in a Japanese population using multidetector computed tomography. Forensic Sci Int; 262:285.e1-285.e5. Retrieved from https://doi.org/10.1016/j.forsciint.2016.02.023
Toxicología, Barcelona, Masson, (2004).
Vick A. (2005) Sexual dimorphism and the transition to agriculture [electronic resource]: A meta-analysis, [Thesis], Master's of Arts, University of Florida, 58p.
Zapico SC, Adserias-Garriga J. (2021) Estimation of sex based on postcranial elements in European American and Latin American populations. J Forensic Legal Med;77:102098. Retrieved from https://doi.org/10.1016/j.jflm.2020.102098
Zymbal V, Janz KF, Baptista F. (2017) Sexual dimorphism in bone-muscle relationship in young adults. J Sports Sci;35:2433-38. Retrieved from https://doi.org/10.1080/02640414.2016.1273535
 This work is licensed under a: Creative Commons Attribution 4.0 International License
© Granthaalayah 2014-2021. All Rights Reserved.