CHANGING PATTERN OF INTER-STATES IN-MIGRATION TO WEST BENGAL: CENSUS 2001-2011Jadab Munda 1 1 M. Phil Scholar, International Institute for Population Sciences, Mumbai, India.2 Professor & Head of the Department of Public Health & Mortality Studies, India. |
|
||
|
|
|||
|
Received 14 September 2021 Accepted 14 October 2021 Published 31 October 2021 Corresponding Author Jadab
Munda, jadabmunda1996@gmail.com DOI 10.29121/granthaalayah.v9.i10.2021.4326 Funding:
This
research received no specific grant from any funding agency in the public,
commercial, or not-for-profit sectors. Copyright:
© 2021
The Author(s). This is an open access article distributed under the terms of
the Creative Commons Attribution License, which permits unrestricted use, distribution,
and reproduction in any medium, provided the original author and source are
credited.
|
ABSTRACT |
|
|
|
This
paper attempts to understand the pattern of the change of in-migration to
West Bengal from different states of India. Inter-state migration flow to West
Bengal is an old and essential phenomenon from the times of pre-independence
periods. The total population of West Bengal in 2001 was about 80 million,
and in 2011 the population increased to 91million persons. During the same
period, it is observed that total in-migrants declined slightly from 2.45
million persons in 2001 to 2.38 million persons. The Study's objective is to
examine the pattern of inter-state in-migration to West Bengal during
2001-2011 censuses and analyze the reasons and duration of stay of
in-migration by the age-sex groups. The primary source of the Study is the
census of India 2001 and 2011 (D2 & D5 Tables) based on place of last
residence (POLR). The analysis includes computation of rate, ratio, and the
result are shown by graphs and maps using ArchMap10.3.1 software. Significant
findings include changing the pattern of inter-state in-migration by POLR
between North 24 Parganas and Kolkata, indicating a flow decline pattern. The
top ten major states in India send enormous numbers of migrants (94.33% in
2001 and 94.30% in 2011), the working-age groups have quite diminished as
in-migrants in the past ten years. Bihar and Jharkhand sent the most
prominent migrants to West Bengal. The Study feels that to attract the
migrants again back, West Bengal would require a new regional developmental
strategy to regain its old status as one important destination for
in-migrants. |
|
||
|
Keywords: In-Migration,
Rural-Rural Migration, Selective Female Migrants, Declining Attraction as A Destination,
West Bengal 1. INTRODUCTION Migration is a third
important component of demography after fertility and mortality. It is a
historical and dynamic process in which people are mobile from place to place
or one place to another place with some motives in respect of temporary or
permanents, as well as for the short and long-distance. According to Gosal (1961), migration is
referred to as the continuously changing space-content and space relationship
of an area rather than shifting of people from to place of residence to
another, while Lee (1969) described the
mobility of people without any restriction as 'a permanent or semi-permanent
change of residence. Bhende and Kanitkar
(2000) also stated that
migration refers to changing the geographical or spatial unit between two
places, from origin to destination. Migration
occurs due to push-pull factors and has both positive and negative impacts at
the place of origin and destination. Therefore, an area or population can
significantly benefit from migration as it can boost development. But all |
|
||
migrations occur for different reasons, other than for economic it may be due to political or social factors.
In view of the importance of migration, this study analyses the changing pattern of In-migration to West Bengal from the different States of India based on census data of 2001 and 2011. In West Bengal, there are certain in-migration areas where people are likely to choose better opportunities for jobs, life safety, and cultural attraction. The Millennium Development Goals (MDGs, 2000-2015) added that internal migration is responsible for eradicating poverty and contributing to economic growth in developing countries. It is essential to analyze how the In-migration trends are changing over the two consecutive censuses of India from 2001 to 2011 in West Bengal. The Study will reveal fundamental reasons and patterns (such as reasons, a favorite destination within the state, areas/places, etc.) of in-migration to the state and its regions (districts).
According to the census reports, the West Bengal population has been growing steadily since 1901, except for a minor decline in 1921, from about 17 million to 91 million by 2011 (Table 1). The decadal growth pattern has indicated that the population had the highest jump in the 1941 (22.9%) from the previous census (8.14%). In 1951 the state experienced a lower growth rate of 13.2 percent, but in the subsequent year (1961), it felt the highest rate with 32.8 percent, and the annual rate remained below 2 percent in 2001. The state has experienced a fluctuating growth rate over the years, and in 2011, the rate was a much lower annual growth rate of 1.4 percent.
|
Table 1 Trend of Population Growth, West Bengal, 1901-2011 |
||
|
Year |
Population (million) |
Population Growth Rate (in percentage) |
|
1901 |
16.94 |
- |
|
1911 |
17.99 |
6.25 |
|
1921 |
17.47 |
-2.91 |
|
1931 |
18.89 |
8.14 |
|
1941 |
23.22 |
22.93 |
|
1951 |
26.29 |
13.22 |
|
1961 |
34.92 |
32.8 |
|
1971 |
44.31 |
26.87 |
|
1981 |
54.58 |
23.17 |
|
1991 |
68.07 |
24.73 |
|
2001 |
80.17 |
17.77 |
|
2011 |
91.27 |
13.84 |
|
Source: Census of India, 1901-2011. |
||
Literature Review
The literature review gives information about the research gap and the research background of the previous related work in the state and in-migration. There cannot be any universal theory of population and migration; it depends on the production system, so it will not be correct to call it a theory. For the review of in-migration-related literature, there has been some important work done by earlier scholars. Bose (1967) discussed the pattern of internal migration in India in terms of origin, streams, and distance, and direction based on the 1961 census, where the author identified that two types of migration are dominated within India as a female, they migrate for marriage purpose and male migrate for economical purpose. Premi (1980), working on secondary data of census 1971 on aspects of female migration in India, identified that there were more women migrants than men over the whole of India, which accounts for more than 70 percent of the total migrants inside the country. The main reasons were due to 'marriage' and 'association, particularly from rural-to-rural areas. Singh (1984) described the relationship between the rural to urban migration in India concerning the distance travel or covered by the migrants with the short and long-distance pattern concerning the sex-selective, where authors give more importance to the opportunity-based destination. Singh (1986) had compared the rural and urban migration concerning the migration selectivity, based on three states of India, namely Kerala, West Bengal, and Bihar. The author explained how demographic, economic, and regional disparities differ with the migration selectivity pattern of the three states of India studied.
Bhagat (2005) stated that migration could lead to overpopulation or depopulate an area based on economic development and other related development like urbanization and social change, which is mainly responsible for the push and pull factor of an area. Lusome and Bhagat (2006) explained the trends and patterns of internal migration in India based on the 1971-2001 census. They identified that internal migration is an essential factor in influencing the development of socio-economic factors in developing countries. Bhagat (2009) also worked on the census, and NSSO data in which he described that the states with higher per capita income and enormous dominance of non-agricultural sector did not show all-time high level of in-migration but also out-migration and identified the socially disadvantaged groups like SC/ST do not show higher mobility compared to other population categories. Sarkar (2017) described with the help of the 1991-2001 census recent changing patterns of migration and spatial patterns of urbanization in West Bengal, as with increase and decrease of tempo urbanization the pattern of in and out-migration are becoming changing in West Bengal, he finds the patterns of in-migration in West Bengal are increased from 1991-2001 census. Banu (2016) describes the trends and patterns of internal migration in West Bengal concerning census 1991-2001, where he shows that the changing trends of in-migration in West Bengal are primary reasons for the transformation of socio-economic factors in West Bengal and gender difference also an essential migratory distance have been considered under his discussion.
The need for the Study
The inter-state migration flow into West Bengal is an essential phenomenon from old times to present-day periods. There are some fundamental reasons behind studying issues related to in-migration in West Bengal, considering the last two censuses. West Bengal is the 4th largest state in population and the 2nd most densely populated state in India (Census of India, 2011) . The state has the 3rd most mobile population when considering the last residence. Over the years, the proportion of migrants in West Bengal has increased from 27 percent in the 1991 census to 30 percent in 2001. It would be interesting from all aspects to understand the different streams and reasons of in-migration in the state, and analysis attempted to examine the changes over time from the perspectives of the inter-state flow of migrants, streams of migration, reasons, and Duration for migration.
The objective of the Study
The Study’s main objective is to analyze the dynamics of in-migration in West Bengal over the 2001 and 2011 periods, and the other specific objectives are:
1) To examine the pattern of inter-state in-migration to West Bengal during 2001-2011;
2) To study the streams of in-migration observed in West Bengal and its regions/districts during the same period; and
3) To analyze the reasons and duration of stay of in-migrants to West Bengal.
2. DATA AND METHODOLOGY
The Study is based on secondary data, the (Migration Reports, 2001 and 2011). According to the census, the migrants are classified as a place of birth and place of residence. The systematic collection of migration data by the Registrar-General of India (RGI), under the Ministry of Home Affairs, GoI, has been available since the first regular census in 1872, which is based on place of birth (POB) and the place of the last residence (POLR) collected since 1971. In the 1981 census, the migration data collected included the reasons for migration. According to the study's objectives, the analysis is based on migrants’ reported place of last residence (POLR). The D2 Table contains data related to the trend of inter-states in-migration to West Bengal and streams of in-migration (Census of India, 2001 and 2011) . On the other hand, the D5 Tables examine the trends for reasons and the Duration of in-migration to West Bengal (Census of India, 2001 and 2011) .
The complete analysis is done using simple statistical techniques to derive ratios, rates (percentage), and the results are presented through graphs and maps using ArcMap10.3.1 software.
· Percentage of in-migration = number of individuals (or in a district) in-migration by the total in-migration of that specific field or district*100.
3. RESULTS AND DISCUSSION
3.1. Inter-state in-migration by place of last residence
Inter-state migration refers to the person with the last residence in India but beyond the state of enumeration (Bhagat, 2006). The total population of West Bengal in 2001 was about 80 million (males 41,465,985 and female 38,710,212) and in 2011 the population increased to 91 million (male 46,809,027 and female 44,467,088) respectively. During the same periods, it is observed that total in-migrants declined slightly from 2,457,162 persons (males 1,330,989 and female 1,126,173) in 2001 to 2,381,045 persons (males 1,092,592 and female 1,288,453).
Table 2 and Figure 1 present the shares and change over two censuses of in-migration by their destinations across West Bengal from different states of India. The censuses of 2001 and 2011 showed that the highest proportion of in-migrants to West Bengal have been in two districts, namely Kolkata and Bhardhaman districts, and the least in Dakshin Dinajpur district. In 2001, the distribution of districts by their share of in-migrants was Kolkata (19.14%), followed by Barddhaman (15.73%). The share for other districts stated that Darjeeling (4.03), Haora (9.12), Hugli (8.41), Jalpaiguri (5.66), Murshidabad (4.85), Medinipur (13.43), and Purulia (4.19). All these nine districts together received 84.26 percent of in-migrants in 2001 and the same districts in the subsequent census of 2011 showing a pretty changing trend of in-migration.
In the case of the 2011 census, the nine districts of Barddhaman (15.8%), Darjeeling (4.8%), Haora (8.5%), Hugli (7.99%), Jalpaiguri (5.98%), Kolkata (16.5%), Murshidabad (1.48%), Medinipur (4.3%), and Purulia (5.27%), together represent 70.7 percent of in-migrants. This indicates a decreasing trend of in-migrants to West Bengal by 13.5 percentage points between two consecutive censuses. The districts like Bankura, Bardhhaman, Birbhum, Darjeeling, Jalpaiguri, Koch Bihar, Maldah, Nadia, 24 PGS(N), Purulia, 24 PGS(S), and Uttar Dinajpur are recognized as migrant-gaining districts from 2001 to 2011 censuses. In 2011, there were ten districts with less than 5 percent of in-migrants in their districts. On the other hand, Haora, Hugli, Kolkata, Murshidabad, Medinipur are recognized as migrant-losing districts but affect changing trends of in-migration vigorously. Such a pattern reflects the extent and decreasing trend of in-migration to West Bengal between two censuses of 2001-2011.
|
|
|
Figure 1 Percentage of In-migration by
District, West Bengal, 2001 and 2011 |
|
Table 2 Percent of Inter-state in-migrants by place of the last residence in West Bengal, 2001 and 2011 |
||
|
District |
2001 |
2011 |
|
Dakshin
Dinajpur |
0.32 |
0.30 |
|
Bankura |
0.74 |
0.77 |
|
Nadia |
1.21 |
1.58 |
|
24 Parganas
North |
1.57 |
12.70 |
|
Koch Bihar |
1.71 |
1.90 |
|
Maldah |
2.18 |
2.72 |
|
Birbhum |
2.36 |
2.76 |
|
24 Parganas
South |
2.62 |
3.11 |
|
Uttar
Dinajpur |
2.74 |
3.44 |
|
Darjiling |
4.03 |
4.79 |
|
Puruliya |
4.19 |
5.27 |
|
Murshidabad |
4.85 |
1.48 |
|
Jalpaiguri |
5.66 |
5.98 |
|
Hugli |
8.41 |
7.99 |
|
Haora |
9.12 |
8.50 |
|
Medinipur |
13.43 |
4.34 |
|
Barddhaman |
15.73 |
15.84 |
|
Kolkata |
19.14 |
16.54 |
|
ALL TOTAL |
100.00 |
100.00 |
|
(2457162) |
(2381045) |
|
|
Source: Census of India 2001-2011(D2 Series) |
||
As indicated in Figure 1, despite the decline in the percentage of in-migrants between the two censuses, in the state, it is seen that the share or proportion for each district has not changed visibly, except in two districts. The only exception or drastic change was reported from 24 Pargana North (share increase by 11 percentage points) and Medinipur district (decline by nine percentage points).
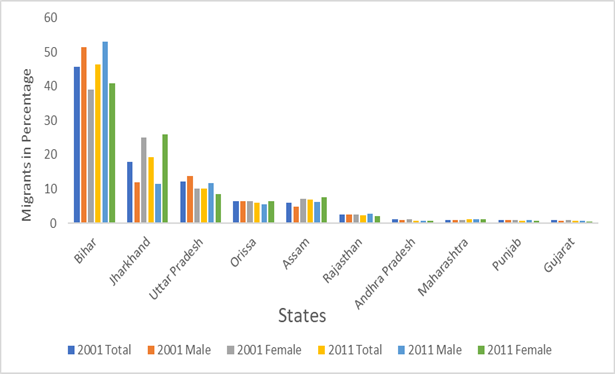
3.2. The In-Migrant Sending States of India to West Bengal in 2001 and 2011
There is an inverse inter-relationship between distance and migration. Migrants moving to a given distance or place is directly proportional to the number of opportunities nearby and inversely proportional to the number of intervening options (Stouffer 1940). As indicated by Table 3 and Figure 1, the nearest states are contributing more in sending migrants to West Bengal. The fact is that the number of present opportunities and nearness is directly related to the number of migrants at the place of the last residence to the destination (Singh 1984). Ten states sent migrants to West Bengal in 2001, accounting for 94 percent of total in-migrants. In 2011, these ten states remained the main contributors of in-migrants, but their share declined marginally to 94.30 percent.
|
Table 3 Top Ten States in India sending migrants to West Bengal, 2001 and 2011 |
|||||||
|
Sl.no. |
Place of the Last Residence |
2001 |
2011 |
||||
|
Total |
Male |
Female |
Total |
Male |
Female |
||
|
1 |
Bihar |
45.733 |
51.48 |
38.941 |
46.35 |
52.944 |
40.769 |
|
2 |
Jharkhand |
17.95 |
11.946 |
25.046 |
19.29 |
11.549 |
25.864 |
|
3 |
Uttar Pradesh |
12.142 |
13.829 |
10.149 |
10.03 |
11.733 |
8.586 |
|
4 |
Orissa |
6.45 |
6.405 |
6.503 |
5.97 |
5.531 |
6.344 |
|
5 |
Assam |
5.911 |
4.946 |
7.051 |
6.98 |
6.306 |
7.567 |
|
6 |
Rajasthan |
2.481 |
2.527 |
2.427 |
2.42 |
2.735 |
2.156 |
|
7 |
Andhra Pradesh |
1.059 |
0.945 |
1.194 |
0.7 |
0.697 |
0.706 |
|
8 |
Maharashtra |
0.888 |
0.826 |
0.962 |
1.16 |
1.193 |
1.134 |
|
9 |
Punjab |
0.894 |
0.902 |
0.884 |
0.76 |
0.846 |
0.692 |
|
10 |
Gujarat |
0.825 |
0.794 |
0.861 |
0.61 |
0.645 |
0.583 |
|
Sub-Total |
94.33 |
94.6 |
94.02 |
94.3 |
94.18 |
94.4 |
|
|
All Total |
100 |
100 |
100 |
100 |
100 |
100 |
|
|
-2457162 |
-1330989 |
-1126173 |
-2381045 |
-1092592 |
-1288453 |
||
|
Source: Census of India 2001-2011(D2
Series) |
|||||||
In the case of migration by sex to West Bengal, there has been not much variation between the two censuses. There has been a very marginal decline (- 0.42%) but a slight increase seen among females by 0.38 percent.
The states-wise analysis shows that over the years, more migrants have come to West Bengal mainly from three states, namely, Bihar, Jharkhand, and Uttar Pradesh (UP). These three states account for over 60 percent of the in-migrants in West Bengal for both Censuses. In 2001, Bihar contributed nearly half of all in-migrants (45.73%), followed by Jharkhand (17.95%) and Uttar Pradesh (12.14%). Then trends and patterns remain unchanged in the 2011 Census, but each state's share has changed. In 2011, two of these leading states, namely Bihar and Jharkhand, saw an increase. For instance, Bihar’s share increased to 46.25 percent, and Jharkhand to 19.29 percent. But UP’s share has declined a little (10.03%).
The male in-migration shows a decrease from the states like Jharkhand (-0.4%), UP (-2.09%), Orissa (-0.87%), Andhra Pradesh (-0.25%), Punjab (-0.06%), and Gujarat (-0.15%), whereas in case of female in-migration also a decreasing in percentage seen from states like UP (-1.56%), Orissa (-0.16%), Rajasthan (-0.27%), Andhra Pradesh (-0.49%), Punjab (-0.19%) and Gujrat (-0.28%). Uttar Pradesh shows more decrease in the share of in-migration to West Bengal for both sexes for the two consecutive censuses 2001 and 2011. The increasing flow of in-migration has been seen for males in states such as Bihar (+1.46%), Assam (+1.36%), Maharashtra (+0.34%), and for the female from states like Bihar (+1.82%), Jharkhand (+0.81%), Assam (+0.51%), Maharashtra (+0.17%) for the two consecutive censuses of 2001 and 2011. The analysis highlights those two states, namely Bihar and Assam, are the main sending states of migrants between two censuses. The declining trends of in-migrants among the states show the preference by people for the next best alternative or a better opportunity than West Bengal.
|
|
|
Figure 2 Top Ten States sending migrants
to West Bengal during 2001 and 2011 |
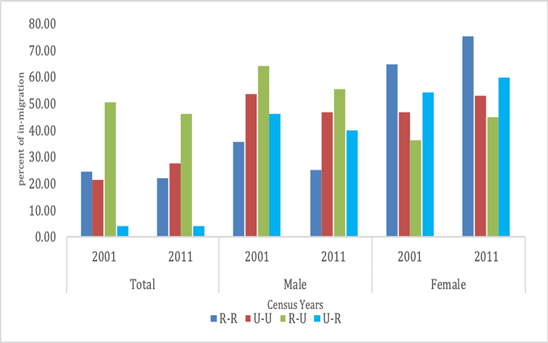
3.3. Pattern of in-migrants by Streams of migration by sex in West Bengal, 2001 and 2011
The data presented in Table 4 and Figure 2 clearly illustrate the parallelism between the two consecutive censuses 2001 and 2011 of the different streams of in-migration by sex to West Bengal from other states of India.
In the case of Rural-Rural migration, the total migrants indicate a decreasing trend, from 24.66 percent in 2001 to 22.25 percent in the 2011 census. Similarly, the percentage of male in-migration also decreased during the same period, in 2001 at 35.37% to 25% in 2011. But in the case of female in-migration, it shows an increasing pattern from 64.63 percent in 2001 to 75.00 percent in the 2011 census.
For the Urban-Urban stream of in-migration, the total migrants show an increasing trend in the 2001 census from 21.21 percent to 27.59 percent in the 2011 census. These have been increased up to 6.38 percentage where the male migrants are decreased (-6.38) percentage from 2001-2011 census, and female migrants increased (+6.38) percentage from 2001-2011 census.
The Rural-Urban in-migration has decreased for both the total migrants (-4.16%) and male migrants (-8.66%) during 2001 and 2011. But the contrary scenario is seen in the case of female migrants, an increasing trend (+8.66%). The movement of migrants from Rural to Urban areas can be interpreted as due to job opportunities between two separate places, and for this motive, migrants are forced to migrate from rural to urban areas (Mukherjee, 2001).
In the case of Urban-Rural in-migration to West Bengal, both total migrants (+0.21%) and female migrants (+6.08%) indicate an increasing trend, whereas the male migrants show a negative trend (-6.08%) during 2001-2011.
|
Table 4 Percentage distribution of in-migrants by streams of migration, West Bengal, 2001 – 2011 |
||||||
|
Streams of Migration |
Total |
Male |
Female |
|||
|
2001 |
2011 |
2001 |
2011 |
2001 |
2011 |
|
|
R-R |
24.66 |
22.25 |
35.37 |
25 |
64.63 |
75 |
|
U-U |
21.21 |
27.59 |
53.3 |
46.92 |
46.7 |
53.08 |
|
R-U |
50.28 |
46.12 |
63.93 |
55.27 |
36.07 |
44.73 |
|
U-R |
3.84 |
4.05 |
46.02 |
39.94 |
53.98 |
60.06 |
|
Source: Census of India 2001-2011(D2 Series). |
||||||
Overall, the pattern seen in the case of streams of in-migration to West Bengal can be concluded as the dominancy of female in-migration in all streams of migration. But in the case of men, in-migration has been decreasing from 2001 to 2011 in all types of streams of migration or opposites to that of female in-migration from different states of India to West Bengal.
|
|
|
Figure 3 Streams
of In-Migration by sex to West Bengal in 2001 and 2011 |
3.4. Duration of Residence and Reasons for In-Migration by sex during 2001-2011
There has been a contradictory argument why people move from one region to another, leaving their present residence to find a new residence. The reasons for the migration are mainly between two main concepts known as the "push" and "pull" factors (Lee 1969), in which the push factors relate to causes and pull aspects relate to the results/outcomes. The data on reasons for migration are helpful to understand the motivational factors associated with the mobility of the people (Bhagat, 2006). Data on reasons for migration based on the last residence has been collected by the Census (RGI) since 1981.
Table 5 presents the results of the changing scenario of Duration and reasons for in-migration to West Bengal between two censuses, 2001 and 2011. The all Duration (lifetime) of migration indicates that marriage in-migration is mostly the dominant one than other reasons. The changing trend observed for reasons of in-migration between 2001 and 2011 censuses have been due to work/employment (-1.95%), moved with household (-2.6%), business (-0.12%), and education (-0.2%). But the increase is seen due to marriage (+0.12%), moved after birth (+2.60%), and others (+2.22%).
As indicated, reasons such as marriage, moved after birth, and other categories represent an increasing in-migration trend. The above reasons explained essential issues related to the Duration and reasons of in-migration to West Bengal from other states in India.
|
Table 5 Inter-state in-migration by Duration and reasons of migration, West Bengal, 2001 and 2011 (in percentage) |
||
|
Reasons |
All durations of residence |
|
|
2001 |
2011 |
|
|
Work/Employment |
6.9 |
4.95 |
|
Business |
1.2 |
1.08 |
|
Education |
0.7 |
0.5 |
|
Marriage |
49.4 |
49.5 |
|
Moved after birth |
4.6 |
7.2 |
|
Moved with household |
16 |
13.4 |
|
Others |
21.2 |
23.4 |
|
Total |
100 |
100 |
|
-25069017 |
-33421030 |
|
|
Source: Census of India 2001-2011(D5
Series) |
||
Table 6 presents the changes observed in the sex-wise Duration and reasons for in-migration to West Bengal between two consecutive censuses 2001-2011. In which the causes and duration of the last residence are separately analyzed for Males and Females. The All Duration (lifetime) the main reasons reported for in-migration (both showing a positive and negative increase over the two censuses) are education (male -10.13% and for female +10.13%), followed by business (male -4.09% and female +4.09%), and moved with household (male +3.83% and female -3.83%).
|
Table 6 Duration and Reasons for in-migration to West Bengal, 2001 and 2011, Sex-wise pattern (in percentage) |
|||||
|
Reasons |
All durations of residence |
||||
|
Sex |
2001 |
2001 |
2011 |
2011 |
|
|
Work/Employment |
male |
1512080 |
87.85 |
86.26 |
1427059 |
|
female |
209210 |
12.15 |
13.74 |
227379 |
|
|
Business |
male |
268136 |
88.98 |
84.89 |
305637 |
|
female |
33216 |
11.02 |
15.11 |
54384 |
|
|
Education |
male |
136884 |
79.06 |
68.93 |
112694 |
|
female |
36257 |
20.94 |
31.07 |
50804 |
|
|
Marriage |
male |
172718 |
1.39 |
2.07 |
342677 |
|
female |
12212783 |
98.61 |
97.93 |
16211684 |
|
|
Moved after birth |
male |
676932 |
58.93 |
58.5 |
1406110 |
|
female |
471780 |
41.07 |
41.5 |
997316 |
|
|
Moved with household |
male |
1909318 |
47.37 |
51.2 |
2289063 |
|
female |
2121500 |
52.63 |
48.8 |
2289063 |
|
|
Others |
male |
2946564 |
55.51 |
55.62 |
4346447 |
|
female |
2361639 |
44.49 |
44.38 |
4346447 |
|
|
Source: Census of India 2001-2011(D5
series) |
|||||
The analysis of sex-wise Duration and reasons for in-migration to West Bengal from different states of India reflects positive change for men in most issues but the females a decline (negative) in the case of marriage purposes between the two consecutives between the two consecutive censuses, 2001 and 2011.
3.5. Duration of Residence of In-Migration by age and sex, West Bengal, 2001 and 2011
Internal migration is recognized as one of the important factors that influenced the socio-economic development of an area, basically identified with the developing countries of the world (Bhagat, 2006). According to the Indian Constitution, Article 19(1)(d) envisages that every person can move freely without any restriction within the territory of India (Laxmikanth, 2017).
Table 7 and Table 8 present the duration of residence of in-migrants in West Bengal by age-groups and sex-wise for both 2001 and 2011 censuses. Table 5 is presented changing scenario of the Duration of in-migration concerning age groups. The All duration (lifetime) period the percentages vary widely across age groups. For instance, while most age groups indicated an increase or positive change, the middle age groups declined. Those age groups with growth or positive change are the children age 0-14 (+2.47%) and 60+ (+0.05%), where the age groups of education gain students and the working-class migrants are showing the consecutive decreasing percent’s of in-migration in west Bengal 15-29 (-0.89%) and 30-59 (-1.63%).
|
Table 7 Age group-wise pattern of Duration of in-migration in West Bengal, 2001 and 2011 (in percentage). |
||
|
Persons And Age-Groups |
||
|
All Duration of Residence |
||
|
Age-Groups |
2001 |
2011 |
|
0-14 |
10.03 |
12.50 |
|
15-29 |
28.74 |
27.85 |
|
30-59 |
48.99 |
47.36 |
|
60+ |
12.24 |
12.29 |
|
100.00 |
100.00 |
|
|
Total |
(25069017) |
(33421030) |
|
Source: Census of India 2001-2011 |
||
The results portray that the age groups most dominant for decreasing or negative trends of in-migrants are the active working classes. This could be because these age groups adhered to the concepts of development. On the other hand, lack of decentralized development within the state could be the reason for migrants to shift to other states leading to out-migration from West Bengal. The dependent younger population are positively moving with their parents as with the students who move for education, both leading to increasing out-migration, but a case of return migration among the older population for the increasing trend.
Table 8 presents other dimensions related to the Duration of in-migrants in West Bengal by age and sex of migrants for 2001 and 2011. Interestingly, both age and sex show a different pattern of change in in-migration from other states. The All duration (lifetime), the age-groups and sexes showing increase positively are 0-14 (male +3.74% female +1.87%), 15-29 (male +1.24%), and 60+ (male +0.14% female +0.01%), where the age-group of 15-29 (female -1.80%) and 30-59 (male -5.11% female -0.09%) are consecutively showing the decreasing percentage of in-migrants to West Bengal.
|
Table 8 Age-Sex pattern of Duration of in-migration in West Bengal, 2001-2011 (in percentage) |
||||
|
Age-Sex |
||||
|
All Duration of Residence |
||||
|
2001 |
2011 |
|||
|
Age-Groups |
Male |
Female |
Male |
Female |
|
0-14 |
17.08 |
6.95 |
20.82 |
8.82 |
|
15-29 |
22.12 |
31.63 |
23.36 |
29.83 |
|
30-59 |
47.99 |
49.43 |
42.88 |
49.34 |
|
60+ |
12.81 |
11.99 |
12.95 |
12.00 |
|
Total |
100.00 |
100.00 |
100.00 |
100.00 |
|
(7622632) |
(17446385) |
(10229687) |
(23191343) |
|
|
Source: Census of India 2001-2011(D5 series) |
||||
From the above analysis, it is indicated that in West Bengal, based on the Duration of migration of both age-sex groups, a decreasing trend coupled with diversion dominated mainly by the working-class is clearly indicated, and a visible pattern of return-migration as depicted increasingly by older age groups of both sexes. The scenario suggests declining in-migration to West Bengal, plausibly due to better alternatives in other states of India.
4. CONCLUSIONS, FINDINGS, AND POLICY IMPLICATIONS
West Bengal has some actual and adequate policies and laws from the post-independence period for in-migrants and immigrants, as given, which are included below.
· The West Bengal Land Development and Planning Act (1948): the purpose of these laws meant for immigrants, and in-migrants from different areas can settle in West Bengal with the establishment of the town, model village, agricultural colonies, and fisheries, etc.
· According to the Nehru-Liaquat pact (1950), the Indian government realized that those migrants were entering from the former East Bengal (Bangladesh) after the independence allowed them to stay in West Bengal (Kolkata) as Refugees.
· The West Bengal Administration of the Evacuee Property Act (1951): the government's attempt to safeguard the interests of the Muslims in West Bengal.
· The Thika Tenancy Act (1981): introduced for the poor-income urban settled migrants – these are related to the landlord and migrants who settled temporarily for a permanent way in legal bustees and illegal squatter colonies.
The study focuses on the changing characteristics and trends of in-migration from different states of India to West Bengal. One important finding is that Kolkata district shows decreasing in-migration, while 24 Parganas North leads in percentage of in-migration over the two consecutive Censuses (2001-11). A plausible reason of this changing role is due to the development pattern of these two areas or districts. Over the years, 24 Parganas North has become more developed and attracted workers increasingly in comparison to the Kolkata, in which it also played an essential role as sub-urban area of Kolkata, as a residential area.
REFERENCES
Banu, N. (2016). Trend and pattern of internal migration and socio-economic transformation in West Bengal, Ph.D. Thesis. Aligarh (202002): Department of Geography, Aligarh Muslim University (India). https://core.ac.uk/download/pdf/144527443.pdf
Bhagat, R.B. (2005). "Conceptual Issues in Measurement of Internal Migration in India," France: IUSSP XXVth International Conference, Contributed Papers, July, pp. 18-23.
Bhagat, R.B. (2008). Assessing the Measurement of Internal Migration in India. Asian and Pacific Migration Journal (APMJ), Vol. 17, No. 1, pp. 91-102. Retrieved from https://doi.org/10.1177/011719680801700105
Bhagat, R.B. (2009). Internal Migration in India: Are the Underclass More Mobile? 26th IUSSP General Population Conference held in Marrakech, Morocco, 27 September-2, pp. 2-17.
Bhagat, R.B. (2015). World Migration Report, Urban Migration Challenges and Opportunities in India, International Organization for Migration (IOM), pp. 5-14.
Bhende, A.A. & Kanitkar, T. (2000). Principle of Population Studies, Bombay: Himalaya Publishing House.
Bose, A. (1967). Migration Streams in India. Population Review, Vol. 2(2), pp. 39-45.
Census of India, Migration Reports, (2001) and 2011, D-2: Migrants classified by place of the last residence, sex and Duration of residence in place of enumeration - 2011(India/State/U.T./District)(Total, SC/ST), D-5: Migrants by place of the last residence, age, sex, the reason for migration and Duration of residence - 2011(India/State/U.T./District).
Census of India, various Reports, (1901-2011).
Dutta, S. & Chakrabarti, S. (2015). Rural-Urban Linkages, Labour Migration & Rural Industrialization in West Bengal, Shri Ram Centre for Industrial Relations and Human Resource, Indian Journal of Industrial Relations, Vol. 50, No. 3, pp. 397-411.
Gosal, G.S. (1961). Internal Migration in India-A Regional Analysis, Indian Geographical Journal, Vol. 36, pp. 106-121.
Jayaraj, D. (2013). Family Migration in India; 'Push' or 'Pull' or Both or What? Economic and Political Weekly, Vol. 48, No. 42, pp. 44-52.
Kaur, R. (2012). Marriage and Migration: Citizenship and marital Experience in Cross-border Marriages Between Uttar Pradesh, West Bengal, And Bangladesh, Economic, and Political Weekly. Vol, 47, No. 43, pp.78-89.
Lee, L.S (1969). A Theory of Migration, In Jackson, J.D. (Ed.) Migration: Sociological Studies-2. London: Cambridge University Press, pp. 282-97.
Lusome, R. And Bhagat, R.B. (2006). Trends and Patterns of Internal Migration in India, 1971-2001, Annual Conference of India Association for the Study of Population (IASP), Contributed paper, Thiruvananthapuram, June 7-9, pp. 2-14.
Premi, M.K. (1980). Aspects of Female Migration in India, Economic and Political Weekly, Apr Vol. 15, No. 15, pp. 714-720.
Sarkar, R. (2017). Recent changing patterns of migration and spatial patterns of urbanization in West Bengal: a demographic analysis, South-Asian Journal of Multidisciplinary Studies (SAJMS) ISSN:2349-7858: SJIF:2.246: Vol. 4, Issue 1, pp. 46-53.
Sengupta, K.M. Mirta, I.K. and Bagchi, D. (2015). Cities, Rural Migration and the Urban Poor-I Migration and the Urban Question in Kolkata, Kolkata: Mahanirban Calcutta Research Group, ISSN 2348 0297, pp. 2-13.
Singh, J.P. (1984). Distance patterns of rural to urban migration in india, Universitaˋ degli Studi di Roam "La Sapienza", Vol. 40, No. 1/2. pp. 119-129.
Singh, J.P. (1986). Patterns of Rural-Urban Migration in India, New Delhi: Inter-India Publications.
Stouffer, S.S. (1940). Intervening Opportunities: A Theory Relating to Mobility and Distance, American Sociological Review, Vol. 5 (6), pp. 845-64. Retrieved from https://doi.org/10.2307/2084520
 This work is licensed under a: Creative Commons Attribution 4.0 International License
© Granthaalayah 2014-2021. All Rights Reserved.