MODELING OPEN AIR AND SHADE DRYING OF CORYMBIA CITRIODORA LEAVES FOR THE ESSENTIAL OIL PRODUCTIONHubert Makomo 1 1 T2A, Phd Program, Faculty of Sciences and Techniques, B.P., 69 University Marien Ngouabi, Brazzaville-Congo.2 T2A, Phd Program, Faculty of Sciences and Techniques, B.P.,69, University Marien Ngouabi, Brazzaville-Congo/CR2IE, Higher School of Technology, Brazzaville-Congo. |
|
||
|
|
|||
|
Received 15 October 2021 Accepted 15 November 2021 Published 30 November 2021 Corresponding Author Thomas
Silou, thsilou@yahoo.fr DOI 10.29121/granthaalayah.v9.i11.2021.4322 Funding:
This
research received no specific grant from any funding agency in the public,
commercial, or not-for-profit sectors. Copyright:
© 2021
The Author(s). This is an open access article distributed under the terms of
the Creative Commons Attribution License, which permits unrestricted use, distribution,
and reproduction in any medium, provided the original author and source are
credited.
|
ABSTRACT |
|
|
|
In the
literature, the drying mechanism were generally analyzed in terms of
effective diffusivity through the pseudo first order diffusion model. This
process was revisited through the modified Peleg model, assuming the drying
as a moisture desorption versus drying time. The leaves of Corymbia
citriodora acclimatized in the Congo Brazzaville “Plateau des Cataractes”
were dried in open air and under shade thanks to a domestic scale of
essential oil production. One obtains following model parameters: kinetic constant
k1: 0.8555 - 2.1355 d.(g/g)-1, extraction capacity constant K2: 1.5255 -
1.8733 (g/g)-1; end equilibrium moisture X∞ = 0.53 - 0.66 g/g. and
first order drying kinetic constant k = K2/k1: 1.71 - 1.78 d-1. Pseudo first
order diffusion model fits experimental data with k = 0.368 - 0.587 d-1 and
t1/2 = 1,18 - 1,88 d. These results needed for the optimization of proccess
and sizing equipments came from a fast graphic data processing, with low
computer inputs. |
|
||
|
Keywords: Shade
Drying, Kinetics, Corymbia citriodora, Congo-Brazzaville 1. INTRODUCTION Corymbia citriodora
(Hook.) K.D.Hill & L.A.S.Johnson, (ex Eucalyptus citriodora Hook.)
Hill and Johnson
(1995), species with
the highest essential oil content of the genus gathered a special attention
for the development of the essential oil sector in the Congo Brazzaville Corymbia
Silou et al. (2009). Acclimatization
of this species from a dozen of sites located in Australia and Madagascar
made it possible to select individual trees with a high biomass production, a
high essential oil content (2-8 %) and very rich in citronellal (60-90 %) Silou et al. (2009), Silou (2019). A project
entitled "Development of marketing channels for essential oils of
Eucalyptus citriodora, a non-timber forest product with high added value, by
village communities in Congo", funded by Congo and ITTO was implemented
for an experimental plantation of 300 ha of Corymbia citriodora Anonymous (2010). Our team
supported this project for training in culture and distillation and provided
technical support for process optimization. We have thus worked on the
evaluation of biomass production Silou et al. (2013), the impact of
drying on the quality of the extracted oil Silou et al. (2002), on the
optimization of the extraction yields Silou et al. (2009). According the
importance of technology (drying and extraction) in addition to the quantity
and quality of the plant material, we undertook a study on the |
|
||
modeling of drying and distillation, dealing to optimizing the quantity and the quality of essential oil recovered from the dried leaves. The results obtained on the modeling of drying in the open air and under shade, which is the drying method selected for the "Congo/OIBT essential oils" project, were presented here.
2. MATERIALS AND METHODS
2.1. Shade drying
Samples of Corymbia citriodora fresh leaves, harvested from 3 different trees (CC1, CC2 and CC3), were dried at room temperature (25-30°C). They were weighed twice a day at 9 a.m. and 3 p.m. for 8 days.
2.2. Determination of the dry matter content
A sample (m1 g) of fresh material from Corymbia citriodora leaves was placed in an oven at 105°C for 24 h. Let m2 be the mass of dry matter obtained, the dry matter content (%) is given by:
(m2/m1) 100, dried matter basis –db-
2.3. Moisture meaning
Moisture (X) represents the water content in the sample calculated on dry matter basis (db).
Xt (spl)= mw/mspl (db)
With mw: mass of water; mspl: dried mass of sample; Xt, X0, Xe: moisture in the sample at any time t, moisture at t = 0, moisture at equilibrium (t∞).
Nguyen et al. (2019)define the moisture ratio (Xr) as the following ratio:
(Residual moisture in the sample)/ (total moisture in the sample):
MR (spl) = Xr (spl) = (Xt-Xe)/(X0-Xe)
If Xe << X0, Xt,
Xr (spl) = Xt/Xe
In this study, extracted moisture ration Xr(ext) was the extracted moisture at time t (Xt(ext)) versus extracted moisture at t∞, the end of the process (Xe (ext)).
Xr(ext)
= Xt(ext)/X∞
2.4. Modeling of drying
Different models were proposed in the literature to simulate the drying of plant matrices.
2.4.1. The Fick diffusion model
This diffusion model was based on Fick's diffusion second law. According Crank (1975) and for a long drying time, the solution of the Fick’s equation fits the experimental data of water extraction:
qt/q∞ = 1- Aexp(-k1t)
with qt and q∞, the amount of the water extracted at time t and time t∞ and k the kinetic constant.
The extraction runs to a pseudo first order kinetic with the following linear form:
ln(1/(1-y)) = kt
2.4.2. Peleg model Peleg (1988)
This model was proposed to explain the behavior of the recovery of several natural metabolites from plant matrices. One assumes that the phenomenon runs as following type law:
qt = q0 ± t/ (k1 + K2t)
with: ±: sorption, adsorption (+) and desorption, (-); qt: extracted metabolite quantity at time t (mt); q∞: extracted metabolite quantity at t∞; q0 = 0: extracted metabolite quantity at t = 0; k1: first order kinetic extraction constant, K2: constant extraction capacity linked to equilibrium at the end of the process Shafaeï et al. (2016).
The linear form of this equation was used to fit Peleg's model:
t/qt = k1 + K2t
The validation criteria generally retained was:
· the minimization of Mean Root Standard Error
· or t/qt = f (t): slope of straight line = K2: Peleg extraction capacity constant (q-1) and ordinate at the origin = k1: Peleg kinetic constant (order 2, t.q-1 unit).
One deduced:
· the kinetic desorption constant (first order) at the start of the process:
k = K2/k1, (t-1 unit)
· extracted metabolite quantity at equilibrium at the end of the process:
q∞ = 1/K2 (q-1 unit)
Peleg model could be used to model drying as desorption of moisture (Xt)
3. RESULTS AND DISCUSSION
3.1. Mass variation with the drying time
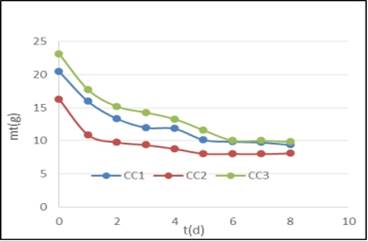
The results on the 3 trees studied were given in Table 1 and Figure 1.
|
Table 1 Variation of the leaves mass of 3 Corymbia citriodora trees (CC) by drying in the open air and in the shade for 8 days |
||||||||||
|
t (d) |
0 |
1 |
2 |
3 |
4 |
5 |
6 |
7 |
8 |
∞ (DM) |
|
CC1* |
20,46** |
15,93 |
13,33 |
11,98 |
11,81 |
10,11 |
9,84 |
9,72 |
9,36 |
9,00*** |
|
CC2* |
16,26** |
10,87 |
9,74 |
9,34 |
8,76 |
8,03 |
8,00 |
7,98 |
8,09 |
7,69*** |
|
CC3* |
23,15** |
17, 71 |
15,18 |
14,27 |
13,27 |
11,58 |
10,02 |
10,00 |
9,82 |
9,50 *** |
|
* Tree 1:
CC1, Tree 2: CC2, Tree 3: CC3; **MF: fresh matter: m0; *** dried
matter |
||||||||||
|
|
|
Figure 1 Variation of leaves mass of 3 trees of Corymbia citriodora (CC) by drying in the open air
and in the shade for 8 days |
3.2. Testing the models
Table 2 gathered all the data needed for fitting the studied models
|
Table 2 Data required for testing the models |
||||||||||
|
Tree 1: m∞= 9,00 g |
||||||||||
|
t(d) |
0 |
1 |
2 |
3 |
4 |
5 |
6 |
7 |
8 |
|
|
mt [g] |
20,46 |
15,93 |
13,33 |
11,98 |
11,81 |
10,11 |
9,84 |
9,72 |
9,36 |
|
|
mw(ext) [g]* |
0 |
4,53 |
7,13 |
8,48 |
8,65 |
10,35 |
10,62 |
10,74 |
11,10 |
|
|
Xt(ext) [g/g] * |
0 |
0,221 |
0,348 |
0,414 |
0,422 |
0,506 |
0,519 |
0,524 |
0,542 |
|
|
t/Xt(ext)* |
0 |
4,524 |
5,75 |
7,25 |
9,48 |
9,88 |
11,56 |
13,36 |
|
|
|
mW(spl)** |
11,10 |
6,57 |
3,93 |
2,62 |
2,45 |
0,75 |
0,38 |
0,36 |
0,00 |
|
|
Xs (spl) [g/g]** |
0,542 |
0,321 |
0,192 |
0,128 |
0,120 |
0,037 |
0,02 |
0,02 |
0,00 |
|
|
Xt(spl)=Xt/X0** |
1.00 |
0.592 |
0.354 |
0.236 |
0.221 |
0.068 |
0.037 |
0.037 |
0.00 |
|
|
lnXt(spl)** |
0,00 |
-0,52 |
-1,04 |
-1,44 |
-1,51 |
-2,69 |
-3,30 |
-3,30 |
|
|
|
Tree 2: m∞= 7,69 g |
||||||||||
|
t(j) |
0 |
1 |
2 |
3 |
4 |
5 |
6 |
7 |
8 |
|
|
mt [g] |
16,26 |
10,87 |
9,74 |
9,34 |
8,76 |
8,03 |
8,00 |
7,98 |
8,09 |
|
|
mw(ext) [g]* |
0 |
5,39 |
6,52 |
6,92 |
7,5 |
8,23 |
8,26 |
8,28 |
8,17 |
|
|
Xt(ext) [g/g] * |
0 |
0,331 |
0,4 |
0,425 |
0,461 |
0,506 |
0,507 |
0,509 |
0,502 |
|
|
t/Xt(ext)* |
0 |
3,021 |
5 |
7,05 |
8,676 |
9,881 |
11,83 |
13,75 |
15,93 |
|
|
mw(spl)** |
8,17 |
2,78 |
1,65 |
1,25 |
0,67 |
- |
- |
- |
- |
|
|
Xt (spl) [g/g]** |
0,502 |
0,17 |
0,101 |
0,076 |
0,041 |
- |
- |
- |
- |
|
|
Xt(spl)=Xt/X0** |
1 |
0.34 |
0.20 |
0.15 |
0.08 |
- |
- |
- |
- |
|
|
lnXt(spl)** |
-0,00 |
-1,08 |
-1,61 |
-1,89 |
-2,53 |
- |
- |
- |
- |
|
|
Tree 3 m∞= 9,50g |
||||||||||
|
t(j) |
0 |
1 |
2 |
3 |
4 |
5 |
6 |
7 |
8 |
|
|
mt [g] |
23,15 |
17,71 |
15,18 |
14,27 |
13,27 |
11,58 |
10,02 |
10 |
9,82 |
|
|
mw(ext) [g]* |
0 |
5,44 |
7,97 |
8,88 |
9,88 |
11,57 |
13,13 |
13,15 |
13,33 |
|
|
Xt(ext) [g/g] * |
0 |
0,234 |
0,344 |
0,383 |
0,426 |
0,499 |
0,567 |
0,568 |
0,575 |
|
|
t/Xt(ext)* |
0 |
4,273 |
5,813 |
7,832 |
9,38 |
10,02 |
10,582 |
12,323 |
13,913 |
|
|
mw(spl) ** |
13,33 |
7,89 |
5,36 |
4,45 |
3,45 |
1,76 |
0,2 |
0,18 |
0 |
|
|
Xt (spl) [g/g] ** |
0,575 |
0,340 |
0,231 |
0,192 |
0,149 |
0,076 |
0,008 |
0,007 |
0 |
|
|
Xt(spl)=Xt/X0** |
1.00 |
0.59 |
0.41 |
0.33 |
0.26 |
0.13 |
0.01 |
0.01 |
0.00 |
|
|
lnXt(spl)** |
0 |
-0,53 |
-0,89 |
-1,11 |
-1,35 |
-2,04 |
-4,61 |
- |
- |
|
Mass of extracted water:
mw (ext): m0-mt; Mass of residual water in the
sample mw(spl): me -mt; Extracted moisture: Xext
= (m0-mt)/m0; Residual moisture in the sample: mw
(spl)/mspl- db-); Moisture ratio: Xt/X(t=0);
*test of Peleg model (pseudo second order kinetics); ** Test of Fick diffusion
mode (pseudo first order kinetics)
3.2.1. Moisture curves as a fonction of drying time
|
|
|
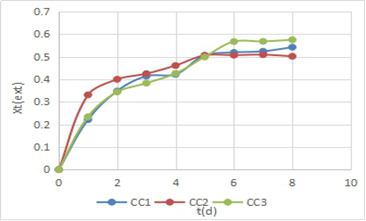
Figure 2 Variation of extracted moisture
Xt(ext) during drying process |
The curves X = f (t) shows the curve shape of the metabolite desorption from a plant matrix characterized by a first period of fast increase rate of metabolite extraction followed by a second period of more slow desorption before an asymptotic ending (Figure 2). The Peleg model simulating moisture sorption of flour could be used to study the drying considered as a moisture desorption. Moreover, the diffusion model could complete usefully the understanding of this process.
3.2.2. Peleg model
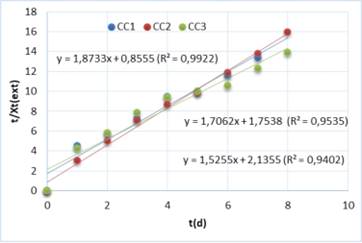
The curves t/Xt(ext) = f (t), plotted from the data in Table 2 lead to straight lines and therefore fit Peleg's model with coefficients of determination R2> 0.94 for the 3 samples studied (Figure 3).
|
|
|
Figure 3 Straight lines for validation of Peleg's model |
The equations of the validation straight lines (Figure 3) lead to k1 = 0.8555 - 2.1355 d. (g/g) -1, Peleg's kinetic constant, and to K2 = 1.5255 - 1.8733 g/g-1, Peleg's extraction capacity constant. These two constants lead to the first order kinetic constant of drying at the beginning of the drying: k = K2/k1 = 1.71 - 1.78 d-1. According to: K2 = 1/X∞, X∞ = 1/K2 = 0.53 - 0.66 g/g.
These values agree that of the extracted moisture after 8 days, which range from 0.50 to 0.58 g/g for the 3 studied samples. Knowing the drying rate and moisture at the end of the process one could predict the drying behavior throughout the process.
3.2.3. Fick Diffusion model
The pseudo first order diffusion model was fitted experimental data by the equation:
Xr = Aexp(-kt),
leading to the following linearized form:
lnXr = lnA - kt
with k the first order kinetic constant of leaves drying, which related to the diffusion coefficient De, after solving the Fick's second law equation.
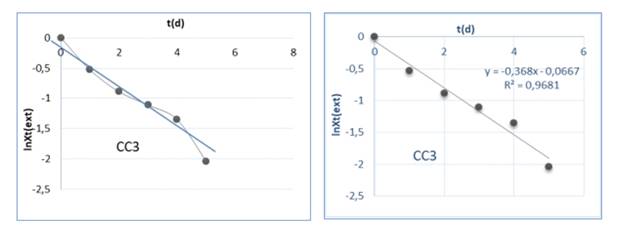
Figure 4 (sample 3) represents a drying which follows the diffusion model on a part of the
process (1-5 h).
|
|
|
Figure 4 Fitting of Fick diffusion model with experimental
data on Corymbia citriodora leaves drying |
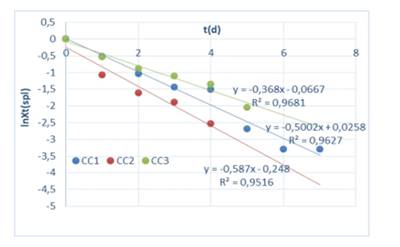
Figure 5 which gathered the curves lnXr = f (t) of the 3 samples indicates that the drying of CC1 takes place according to the diffusion model over the all-drying period (1- 7 h) while the drying. Fitting of CC2 and CC3 follows this pattern only for 1 - 4h and 1- 5h, respectively, out of the 8h of drying.
One deduced the kinetic constant of a part of the process according to a diffusional model:
k = 0.368 - 0.587 d-1
and the half time process:
t1/2 = 0,693/k = 1,18 - 1,88 d
|
|
|
Figure 5 Diffusion model for drying of Corymbia citriodora leaves in open air and under
shade. Validation straight lines |
The drying was generally simulated by the diffusion model according Fick’s second law and fitted with experimental data as pseudo first order kinetics equation lnXr(spl) = lnA – kt, allowing a discussion of the drying process in terms of effective diffusivity, and using k as a simple computational tool Nguyen et al. (2019). The use of Peleg's model modified by Bucic-Kojic et al. (2007) on desorption of polyphenols from grapes deeped the understanding of the process by giving a relevant physical meaning to the two model parameters: k1 and K2. The process was formally a second order kinetic with: (i) a kinetic constant k1 = 0.8555 - 2.1355 d. (g/g)-1, (ii) a drying rate k = K2/k1 = 1.71 - 1.78 d-1, (iii) and an extraction capacity constant K2 = 1.5255 - 1.8733 (g/g)-1, related to the moisture at the end process equilibrium (X∞ = 1/K2= 0,5338 -0.6555g/g).
4. CONCLUSIONS
In the literature, the modeling of the drying is generally considered as a diffusion phenomenon according to a pseudo first order kinetics when one assumes the rapid step of extraction of the free water negligible compared to that of the intra-particle diffusion. The first order kinetic constant is complex and includes the diffusivity of moisture, thermal conductivity, heat at the interface, and mass coefficients… An additional hypothesis on the geometry of the plant matrix particles, leads to value of De, which is the central parameter for understanding the diffusional mechanism of drying. Another simpler and faster reading based on the graphical processing of the Peleg model, built around the kinetic constant k1 and the extraction capacity constant K2 is possible, without sophisticated numerical iteration programs. The validation straight line of the Peleg model t/Xt(ext)= k1 + K2t formally translates a pseudo-order 2 kinetics k1 and K2 represents the inverse of the equilibrium moisture at the end of drying. These two constants lead the pseudo first order drying kinetic constant k = k1/K2 which makes it possible to evaluate the desirable duration of the drying through the time of the half process (t1/2). Such approach is sufficient for drying optimization and material sizing, for a domestic scale unit.
ACKNOWLEDGMENTS
Authors thank the Higher School of Technology “Les Cataractes” (EPrES) and the Faculty of Sciences and Techniques (UMNG) for the scientific and logistic support.
REFERENCES
Anonymous, (2010) Développement des filières de commercialisation d'huiles essentielles d'Eucalyptus citriodora, produit forestier non ligneux à forte valeur ajoutée, par les communautés villageoises du Congo, projet OIBT PD364/05 rév.4(1). Ministère de l'Economie Forestière.
Bucic-Kojic A., Mirela P., Srecko T., Mate B., and Darko V. (2007) Study of Solid-Liquid Extraction Kinetics of Total Polyphenols from Grape Seeds, Journal of Food Engineering, 81. 236-242. Retrieved from https://doi.org/10.1016/j.jfoodeng.2006.10.027
Crank J. (1975) The Mathematics of Diffusion. Oxford University Press, Oxford.
Hill K.D. & Johnson LAS. (1995) Espèces du Genre Corymbia, Telopea 6(2-3), 214. Retrieved from https://doi.org/10.7751/telopea19953017
Nguyen T.V.L., Nguyen M.D., Nguyen D.C., Bach L.G. and Lam T.D. (2019) Model for Thin Layer Drying of Lemongrass (Cymbopogon citratus) by Hot Air, Processes, 7, 21. Retrieved from https://doi.org/10.3390/pr7010021
Peleg M. (1988) An Empirical Model For Description Of Moisture Sorption Curves. Journal of Food Science, 53 (4), 1216- 1219. Retrieved from https://doi.org/10.1111/j.1365-2621.1988.tb13565.x
Shafaeï S.M., Masoumi A.A., Roshan H. (2016) Analysis of Water Adsorption of Bean Etchickpea During Soaking Using Peleg Model, Journal of the Saudi Society of Agriculture Sciences, 15, 135 - 144. Retrieved from https://doi.org/10.1016/j.jssas.2014.08.003
Silou T. (2019) Corymbia citriodora acclimatée au Congo : source de citronellal (90%) Editions Universitaires Européennes, Saarbrünken, Allemagne .
Silou T., Mapola G., Makany R.A., Loumouamou A.N., Malanda M. and Chalchat J.C. (2009) Model of Steam and Water Extraction of Essential Oil of Eucalyptus Citriodora Using a Complete 2n Factorial Plan, International Journal of Food Engineering, 5(4), Article 9. Retrieved from https://doi.org/10.2202/1556-3758.1442
Silou T., Loufouandi A.P., Kama Niamayoua R., Mapola G., Matondo R., Figuérédo G., Chalard P. (2013) Adaptation in Congo Brazzaville of Eucalyptus Citriodora from Australia. Tree-to-tree Yield and Composition VariabilitY, African Journal of Agricultural Research, 8(25), 3259-3267, Retrieved from DOI : 10.5897/AJAR09.518.
Silou T., Loumouamou A.N., Loukakou E., Chalchat J.C. and Figuérédo G. (2009) Intra And Interspecific Variations Of Yield And Chemical Composition Of Essential Oils From Five Eucalyptus Species Growing In The Congo- Brazzaville. Corymbia Subgenus J. Essent. Oil Res., 21, 1-9. Retrieved from https://doi.org/10.1080/10412905.2009.9700149
Silou T., Taty-Loumbou F., Chalchat J.C. (2002) Etude de l'Effet du Séchage Solaire sur le Rendement et la Composition des Huiles Essentielles des Feuilles de Eucalyptus Citriodora Annales d'Expertises Chimiques et Toxicologiques, 95 (960), 287 -3001. Retrieved from https://pascal-francis.inist.fr/vibad/index.php?action=getRecordDetail&idt=14875330
 This work is licensed under a: Creative Commons Attribution 4.0 International License
© Granthaalayah 2014-2021. All Rights Reserved.