THE INFLUENCE OF COMPANY SIZE, MANAGERIAL OWNERSHIP, PROFITABILITY, AND INFORMATION ASYMMETRY ON EARNINGS MANAGEMENT IN LEADING MANUFACTURING COMPANIES IN INDONESIAReschiwati 1 1 Accounting Department, Sekolah Tinggi Ilmu Ekonomi Y.A.I. Jl. Salemba Raya 7-9A, Jakarta, Indonesia. |
|
||
|
|
|||
|
Received 21 September 2021 Accepted 19 October2021 Published 31 October2021 Corresponding Author Reschiwati,
rr.reschiwati@stie-yai.ac.id DOI 10.29121/granthaalayah.v9.i10.2021.4295 Funding:
This
research received no specific grant from any funding agency in the public,
commercial, or not-for-profit sectors. Copyright:
© 2021
The Author(s). This is an open access article distributed under the terms of
the Creative Commons Attribution License, which permits unrestricted use, distribution,
and reproduction in any medium, provided the original author and source are
credited.
|
ABSTRACT |
|
|
|
This
study aims to empirically test whether Company Size, Managerial Ownership,
Profitability and Information Asymmetry have an effect on Earnings Management
(Empirical Study on Manufacturing Companies listed in LQ 45 Period
2016-2020). Sampling using purposive sampling technique. From a population of
45 companies, based on the criteria, 10 companies were selected as samples.
Data processing using panel data regression method. Based on the selection of
the model, the Random effect was chosen as the analysis model to be used.
Data analyzed using EViews 9.0 programs. The results of this study indicate
that the variables of company size, managerial ownership, and information
asymmetry have a significant effect on earnings management, and profitability
has no significant effect on earnings management. |
|
||
|
Keywords: Earnings
Management, Company Size, Managerial Ownership, Profitability and Information
Asymmetry 1. INTRODUCTION The means of
communication used for financial reporting is crucial because it is a way to
describe what managers do. One of the many essential parameters in financial
statements that is a benchmark for management performance is profit. In
addition, profit is also an essential parameter for stakeholders in investing
in the company. From the creditor's point of view, profit information is also
a tool to provide a company's credit. From the government side, profit
information can be used as a parameter to determine the tax imposed on a
company. Managers must have an obligation to maximize the welfare of
stakeholders, but on the other hand, managers are interested in their
welfare. The interests of these parties combined with agency problems are
caused by the separation between stakeholders and company management.
Sometimes management does not always act in the interests of stakeholders but
instead tends to act in the interests of management itself. In Indonesia, phenomena
occurred at PT Garuda Indonesia, where the company’s net profit is US$
809,850 in 2018 and losses of US$ 216.5 million in 2017. The reason is that
the management of Garuda Indonesia ensured Mahata's revenue of US$ 239.4
million, the details of which are: worth US$28 million. Part of Sriwijaya
Air's revenue share. Garuda Indonesia's Revenue is still in the form of
receivables or bills Www.Cnnindonesia.Com. (25 April 2019), (Editor) (2019) The case of PLN
achieved a net profit of Rp 11.57 trillion throughout 2018. This profit
increased from a profit of Rp 4.41 trillion in 2017. In fact, in the second |
|
||
quarter of 2019, PLN lost Rp 18,480 billion due to a foreign exchange loss of Rp 17,320 billion. The first thing that affects earnings management is the item of remuneration income, where this income does not appear in the 2017 balance sheet but is recorded in the remuneration income account of Rp 23.17 trillion. The other two net revenues increased from IDR 3.40 trillion in 2017 to IDR 15.66 trillion in 2018. The increase in other net income came from government revenue Dwi Ayuningtyas (2019), (Editor) (2019). The case of Bank Bukopin, where its net profit was revised in 2016 from Rp 1.08 trillion to Rp 183.56 billion. The primary decrease was related to the allowance for income and commissions, namely credit card income and additional impairment losses on assets. As a result, the allowance for impairment of financial assets was revised from Rp 649.05 billion to Rp 797.65 billion. As a result, the company's expenses increased by Rp. 66.6 billion Donald Banjarnahor (2018).
The data above illustrates cases of earnings management in Indonesia that often undermine the level of external trust related to the quality of the financial statements presented (Febriani, 2014). The technique of applying earnings management that is much different from time to time requires that earnings management must be observed to prevent or minimize cases of earnings management in Indonesia Mutiarasari (2016).
According to research from Purwanti et al. (2021) and Giovani (2017) company size has no significant effect on earnings management. According to Agustia and Suryani (2018) and Taco and Ilat (2016) company size significantly influences earnings management practices.
Earnings management arises among managers determined by motivation; different motivations will undoubtedly bring about different earnings management practices—for example, shareholder managers with managers who do not hold shares. Ownership will affect decision-making and policies regarding the accounting method used. Earnings management practices will automatically affect because the policies on accounting methods applied in the company are also determined by managers Ujiyantho and Agus Pramuka (2007). Managers who have share ownership are a strategy to reduce agency in the company. Managerial ownership of shares is expected to harmonize the interests of owners and managers, which will have a direct impact on earnings management practices.
According to research from Purwanti et al. (2021) explaining earnings management is negatively affected by managerial ownership; these results are in line with research conducted Giovani (2017), Aljana and Purwanto (2017), Mahadewi and Krisnadewi (2017), Widyaningsih (2017) and Ni & Maria (2016). While research conducted by Arlita et al. (2019) earnings management is positively influenced by managerial ownership.
Another aspect that correlates with earnings management practices is profitability which describes the profits of a company. Profitability encourages managers to manage earnings management because if a company's profitability is low, a manager will practice income management to keep their results positive in the owner's sight Gunawan (2015). Earnings management is positively influenced by profitability, under the research conducted Aljana and Purwanto (2017), Agustia and Suryani (2018) and Giovani (2017).
In addition to the above factors, the information asymmetry factor also affects the occurrence of manipulative activities. Information asymmetry is the action of a manager having more access to company data that is not known to others. That way, the more data management has about stakeholders, the more opportunities the company controls to practice earnings management.
The cause of earnings management errors may be due to information asymmetry. When an information asymmetry is at a high level, and managers do not have enough incentives, resources, or access to reliable data to monitor managers' actions, this can provide an opportunity for managers to manipulate earnings management Desmiyawati & Y. F. (2009). According to Ni & Maria (2016) information asymmetry has a positive effect on earnings management.
LQ 45 is an index on the Indonesia Stock Exchange (IDX) calculated based on the liquidity criteria of well-performing companies. This index consists of 45 issuers. This research focuses on manufacturing companies listed in LQ 45. Although there are many studies on earnings management, the research results are different. It is what underlies why researchers want to examine what aspects affect earnings management practices. There are differences in research in the form of the year to be studied and the software used, namely Eviews 9.
Based on the description above, the researcher will examine "The Influence of Company Size, Managerial Ownership, Profitability, and Information Asymmetry on Earnings Management in Manufacturing Companies listed on the LQ 45 2016-2020".
2. LITERATURE REVIEW
Agency Theory
Agency theory aims to understand comprehensively and solve problems that arise when the information situation is incomplete when making a contract (engagement). Agency theory describes the relationship between shareholders and agents, namely management. As a shareholder-appointed entity, management works for the benefit of the company and shareholders. Because they are elected, management is required to benefit shareholders Jensen & Meckling (1976) in Reschiwati and Hasudungan (2020).
Agency Cost
Agency theory explicitly considers the costs and benefits that will result from solving an existing agency problem. There are two aspects of costs that can be found in the agency relationship. The first is pre-cost, where a fee is incurred by managers and shareholders entering into a contract. The second is ex-post costs, which are costs incurred when shareholders delegate shareholders and managers in business supervision. Agency-related research generally focuses on ex-post costs because these costs impact the theory of business life Harjito (2011).
Earnings Management
According to Scout (2015) in Sucipto and Zulfa (2021) earnings management is opening policies by managers to increase company value by misleading stakeholders. Financial earnings management can manage from a financial report based on management deliberately manipulating the report to better not describe the company's actual state. Financial statement users may make wrong decisions due to earnings management practices Arlita et al. (2019).
Company Size
Company size shows how big a company is calculated from the Ln of its total assets. According to (Febriyani, 2013) in Giovani (2017) assets are all company resources due to past events. From these assets, the entity expects future profits. Company size is an assessment to describe the company's condition in terms of sales and total assets. The greater the assets and sales mean that the company is classified as a large company Sucipto and Zulfa (2021).
Managerial Ownership
Managerial ownership is a requirement for managers to own shares in the company. This managerial share ownership is also stated in the report on the percentage ownership of the management company's shares. Managerial share ownership can balance managers' and shareholders' interests because managers also benefit from their decisions. However, managers also face the risk of loss as a result of bad decision-making. In a company, the higher the share ownership portion of management, the better the company's performance will be and can also unite the interests of managers and shareholders Sutojo and Aldridge (2005). Managerial ownership refers to the shares owned by the subsidiaries of the company in question and its affiliates. Management ownership of the company can equalize the positions of managers and shareholders, thereby reducing conflicts between managers and shareholders Jensen and Meckling (1976).
Profitability
Profitability is an indicator from the management side of managing company assets in terms of the profits earned Sudarmadji and Sularto (2007). Profitability is the company's net profit from its operating activities Gunawan (2015). Profitability is a measure of operating income in a certain period Kieso (2011). The profitability ratio is a number to determine the company's ability to seek profit. The ratio describes a measure of the effectiveness of the company's management. It is evidenced by the profit from sales and investment income (Kasmir, 2013) in Agustia and Suryani (2018).
Information Assymetry
Information asymmetry occurs because the principal does not have adequate data about the agent's performance. The principal cannot choose the agent's business contribution to the actual company (Supriyono, 2000) in Wiryadi and Sebrina (2013). Information asymmetry will affect managers' earnings management practices in Richardson's (1998) research in Ni & Maria (2016). When information asymmetry is high, stakeholders do not have sufficient resources for reliable information to monitor manager behavior, leading to earnings management practices. The impact of information asymmetry can motivate managers to present irrelevant information related to the manager's performance measurement.
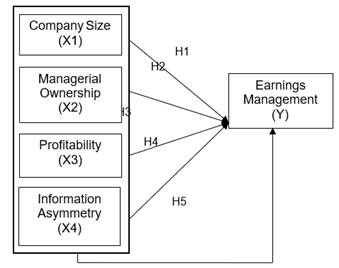
Research Design
|
|
|
Figure 1 Research
Design |
Hypothesis
H1: Company Size has an effect on Earnings Management.
H2: Managerial Ownership has an effect on Earnings Management.
H3: Profitability has an effect on Earnings Management.
H4: Information asymmetry has an effect earnings management
H5: Company Size, Managerial Ownership, Profitability and Information Asymmetry has an effect earnings management.
3. RESEARCH METHODS
Variable Operations
Earnings Management
To measure earnings management practices, discretionary accrual proxies can use the Modified Jones Model (Gupta & Suartana, 2018) in Reschiwati and Hasudungan (2020). The calculation model is as follows:
![]()
Then calculate the estimated total accrual value (TAC) using the following regression equation:
![]()
By using the regression coefficient, the nondiscretionary accrual (NDTA) value can be obtained using the formula:
![]()
Discretionary accruals (DTA) are residuals that can be obtained from the estimated total accruals obtained as follows:
![]()
Information:
DTAit = Discretionary accrual of company i in period t
NDTAit = Non-Discretionary Accruals of company i in period t
Niit = Net profit of company i in period t
Tait = Total accruals of company i in period t
CFOit = operating cash flow of company i in period t
TAit-1 = Total assets of company i in period t-1
REVit = revenue of company i in period t
PPEit = total fixed assets of the company in period t
Firm Size
![]()
Managerial Ownership
![]()
Profitability
![]()
Information Assymetry
![]()
Information:
SPREAD: The difference between the ask price and the bid for the company's shares
aski,t : the highest ask price of the company's stock
bid i,t : the lowest bid price of the company's shares
Population and Sample
The population describes an area generalized to include subjects or objects with specific characteristics determined and concluded by the researcher Sugiyono (2013). Manufacturing companies listed on the LQ 45 index from 2016-2020 are the population in this study. This data was obtained through the website www.idx.co.id with 45 companies. The sample is part of the whole and the characteristics that the population has. The purposive sampling method used in this study is: (1). Companies listed on LQ 45 for the 2016-2020 period. (2). Manufacturing companies that are not listed consecutively in LQ 45 during the 2016-2020 period. (3). Manufacturing companies that do not present their financial statements in Rupiah for the 2016-2020 period.
Classic assumption test
Normality Test
The normality test is intended to determine whether the data is normally distributed or not and show whether the sample being tested represents a normally distributed population. Usually, the values are assumed to be distributed if the values are standardized and the mean values are close. The normality test is carried out by paying attention to the level of spread of the data on the diagonal axis of the graph or by paying attention to the histogram residual.
Multicollinearity Test
According to Ghozali and Ratmono (2013) a multicollinearity test is used to test the high and low correlation between independent variables in a regression model. This research uses an alternative multicollinearity detector that can be executed by observing the correlation value between two independent variables, with a note that 0.80 is the maximum limit of the correlation value.
Heteroscedasticity Test
The heteroscedasticity test is used to test whether there is an imbalance between residuals or observations with other observations. If the residual variance is from one observation to another observation, then it is called homoscedasticity, and if it is different, it is called heteroscedasticity. The statistical test used in this study is the white test.
Autocorrelation Test
The purpose of the autocorrelation test is to test the residual correlation error (interference) from the linear regression model in period t against errors in the previous period (t-1). A good regression model is a model that does not occur. To test the presence or absence of autocorrelation, symptoms can be detected by the Durbin-Waston test (DW Test).
Hypothesis test
Coefficient of Determination (R2)
The coefficient of determination (adjusted R2) was used to measure and explain the influence of the independent variable on the dependent variable. The value of the determinant coefficient in broad ranges between 0 and 1. A value close to 1 (adjusted R2) indicates that the independent variable will present almost all the information needed to explain the dependent variable. On the other hand, if the coefficient value is far from 1, the independent variable only provides limited information.
Partial Hypothesis Testing (t-Test)
The t-test model is used to measure and see the magnitude of the influence of the independent variable on the dependent variable individually. Testing the regression results was carried out using the t-test with the following provisions: H0: if the value of tcount > ttable (0.05), then H0 is rejected. H1: if the value of tcount < ttable (0.05), then H1 is accepted
Simultaneous Significance Test (Statistical Test f)
According to Ghozali and Ratmono (2013) the f test model can show how much influence the independent variables included in the f test model have on the dependent variable. With the provisions, among others: (1). If the probability (significance) > 0.05, it can be said that the independent variable simultaneously does not affect the dependent variable. (2). If the probability (significance) <0.05, it can be said that the independent variable simultaneously influences the dependent variable.
4. FINDING AND DISCUSSION
Research result
Descriptive statistics
|
Table 1 Descriptive Statistics Test Result |
||||||
|
|
Da |
Size |
Mown |
Roa |
Spread |
|
|
Mean |
0.154575 |
32.15674 |
0.416314 |
0.139146 |
8.758743 |
|
|
Median |
0.140305 |
31.54872 |
0.510035 |
0.112420 |
7.862040 |
|
|
Maximum |
0.331660 |
37.65515 |
0.925000 |
0.466600 |
20.47898 |
|
|
Minimum |
0.050180 |
29.10553 |
9.00E-05 |
0.029710 |
1.952880 |
|
|
Std. Dev. |
0.072333 |
1.982278 |
0.367298 |
0.105362 |
4.883782 |
|
|
Observations |
50 |
50 |
50 |
50 |
50 |
|
|
Notes; DA = Earnings Management; SIZE = Company Size; MOWN
= Managerial Ownership; ROA = Profitability; SPREAD = Information Assymetry. |
||||||
|
Source: Data processed
with eviews 9, 2021 |
|
|||||
Based on Table 1, the following results are obtained: The highest earnings management (DA) in manufacturing companies was 0.331660 occurred at PT Unilever Indonesia Tbk in 2017, and the lowest was 0.050180 occurred at PT Gudang Garam Tbk in 2018. The mean and median values of earnings management were 0.154575 and 0.140305. The standard deviation of earnings management is 0.072333. The highest company size (SIZE) in manufacturing companies was 37,65515, which occurred at PT Kalbe Farma Tbk in 2020, and the lowest was 29,10553 in PT Semen Indonesia (Persero) Tbk in 2016. The mean and median values of company size were 32,15674 and 31,54872. The standard deviation of company size is 1.982278. The highest managerial ownership (MOWN) in a manufacturing company is 0.925000, which occurs at PT Hanjaya Mandala Sampoerna Tbk in 2016-2020, and the lowest is 0.00009 occurs at PT Kalbe Farma Tbk in 2016-2020. The mean and median managerial ownership values are 0.416314 and 0.510035. The standard deviation of managerial ownership is 0.367298. The mean and median managerial ownership values are 0.416314 and 0.510035. The standard deviation of managerial ownership is 0.367298. The highest profitability (ROA) in manufacturing companies was 0.466600, which occurred at PT Unilever Indonesia Tbk in 2018, and the lowest was 0.029710 occurred at PT Semen Indonesia (Persero) Tbk in 2019. The mean and median profitability values were 0.139146 and 0.112420. The standard deviation profitability is 0.105362. The highest Information Asymmetry (SPREAD) in manufacturing companies was 20,47898 at PT Indofood CBP Sukses Makmur Tbk in 2016, and the lowest was 1.952880 PT Gudang Garam Tbk in 2017. The mean and median values of information asymmetry were 8.758743 and 7.862040. The standard deviation of information asymmetry is 4.883782.
Results of the Panel Data Regression Model Selection
|
Table 2 Chow test |
|||
|
Redundant
Fixed Effects Tests |
|
|
|
|
Equation:
Untitled |
|
|
|
|
Test cross-section
fixed effects |
|
||
|
Effects Test |
Statistic |
d.f. |
Prob. |
|
Cross-section
F |
33.780347 |
(9,36) |
0.0000 |
|
Cross-section
Chi-square |
112.274734 |
9 |
0.0000 |
|
Source:
Data processed with eviews 9, 2021 |
|||
Based on Table 2 the probability of a chi square cross-section of 0.0000 is smaller than alpha (0.05) so that Ha is accepted. So, the best estimation method to perform regression test is the Fixed Effect Model.
|
Table 3 Hausman test |
|
||
|
Correlated
Random Effects - Hausman Test |
|
||
|
Equation:
Untitled |
|
|
|
|
Test
cross-section random effects |
|
||
|
Test Summary |
Chi-Sq. Statistic |
Chi-Sq. d.f. |
Prob. |
|
Cross-section
random |
5.004631 |
4 |
0.2868 |
|
Source: Data
processed with eviews 9, 2021 |
|||
Based on Table 3 shows that the probability of a random cross-section of 0.2868 is greater than alpha (0.05) so that Ho is accepted. Then the regression model used is the Random Effect Model.
|
Table 4 Lagrange Multiplier Test |
|||
|
Lagrange
Multiplier Tests for Random Effects |
|||
|
Null
hypotheses: No effects |
|
||
|
Alternative
hypotheses: Two-sided (Breusch-Pagan) and one-sided |
|||
|
(All
others) alternatives |
|
||
|
|
Test Hypothesis |
||
|
|
Cross-section |
Time |
Both |
|
Breusch-Pagan |
61.01553 |
1.516748 |
62.53228 |
|
|
(0.0000) |
(0.2181) |
(0.0000) |
|
Source: Data
processed with eviews 9, 2021 |
|||
Based on Table 4 obtained the value of Prob. Breusch-pagan, showed a result smaller than 0.05, which is 0.0000. So, it shows that the regression model used is the Random Effect Model.
Panel Data Regression Model Selection Results
The Chow, Hausman, and Lagarnge test results of the multiplier show that the best model in this study is the Random Effect Model. The results of the model selection are presented in the following table:
|
Table 5 Model Selection Results |
||
|
Test |
Hypothesis |
Final decision |
|
Chow test |
Common
Effect vs Fixed Effect |
Fixed
Effect |
|
Hausman test |
Random
Effect vs Fixed Effect |
Random
Effect |
|
LM test |
Common
Effect vs Random Effect |
Random
Effect |
|
Source: Data processed with eviews 9, 2021 |
||
Classic assumption test
Multicollinearity Test
|
Table 6 Multicollinearity Test Results |
||||
|
|
Size |
Mown |
Roa |
Spread |
|
Size |
1 |
-0.61168 |
-0.20273 |
-0.19007 |
|
Mown |
-0.61168 |
1 |
0.58088 |
0.25412 |
|
Roa |
-0.20273 |
0.58088 |
1 |
-0.01981 |
|
Spread |
-0.19007 |
0.25412 |
-0.01981 |
1 |
|
Source: Data processed with eviews 9, 2021 |
||||
The coefficient value from Table 6, each multicollinearity test result shows no correlation coefficient between independent variables less than (<) 0.80. it can be said the regression model and the four independent variables do not experience multicollinearity problems.
Heteroscedasticity Test
|
Table 7 Heteroscedasticity Test Results |
||||
|
Variable |
Coefficient |
Std. Error |
t-Statistic |
Prob. |
|
C |
0.128611 |
0.413282 |
0.311195 |
0.7571 |
|
Size |
0.000399 |
0.012241 |
0.032601 |
0.9741 |
|
Mown |
-0.042732 |
0.088444 |
-0.483153 |
0.6313 |
|
Roa |
0.039718 |
0.195529 |
0.203134 |
0.8399 |
|
Spread |
0.000136 |
0.001663 |
0.082016 |
0.9350 |
|
Source:
Data processed with eviews 9, 2021 |
||||
Based on the results of the heteroscedasticity test, Table 7 shows that the Prob between the independent variables has a value > alpha 0.05. So, the regression model used does not experience heteroscedasticity problems.
Autocorrelation Test
|
Table 8 Autocorrelation Test Results |
|
|
Durbin-Watson stat |
DU |
|
1.7902 |
1.7214 |
|
a = 5 % |
N
= 50, K = 4 |
|
Source: Data processed with
eviews 9, 2021 |
|
Based on Table 8, it is known that the DW value is 1.7902, and the DU value in the Durbin Watson table is 1.7214, so that a comparison of 1.7214 < 1.7902 < 2.2786 (4 – 1.7214) means that the data in the study does not experience autocorrelation problems.
Panel Data Multiple Regression Analysis
Multiple regression analysis was conducted to determine the relationship between Profitability, Managerial Ownership, Company Size, and Information Asymmetry on earnings management in manufacturing companies listed on LQ 45 in 2016-2020. The estimation results after going through the Chow test, Hausman test, and Lagrange multiplier test the model used in this study is a random effect model with the following estimation results:
|
Table 9 Random Effect Models |
|
|
Variable |
Coefficient |
|
C |
-2.636643 |
|
Size |
0.048435 |
|
Mown |
0.344963 |
|
Roa |
0.121139 |
|
Spread |
0.006849 |
|
Source: Data
processed with eviews 9, 2021 |
|
Based on Table 9, the equation model using the random effect method can be formulated as follows:
DA = -2.6366 + 0.0484 SIZE + 0.3449 MOWN + 0.1211 ROA + 0.0068 SPREAD + e
Hypothesis test
Coefficient of Determination (R2)
|
Table 10 Coefficient of Determination (R2) |
|
|
R-squared |
0.314726 |
|
Adjusted R-squared |
0.253812 |
|
S.E. of
regression |
0.059456 |
|
F-statistic |
5.166783 |
|
Prob(F-statistic) |
0.001638 |
|
Source:
Data processed with eviews 9, 2021 |
|
The coefficient determination results in Table 10 above show that r square is 0.2538, which means that the proportion of the influence of company size, managerial ownership, profitability, and information asymmetry on earnings management in manufacturing companies listed in LQ 45 for the 2016-2020 period is 25.38 percent while the rest is 25.38 percent. 74.62 percent (100 – 25.38 percent) is influenced by other variables not examined in the study.
T-Test
|
Table 11 T Test Result |
||||
|
Variable |
Coefficient |
Std. Error |
t-Statistic |
Prob. |
|
C |
-2.636643 |
0.654103 |
-4.030932 |
0.0002 |
|
SIZE |
0.048435 |
0.019247 |
2.516428 |
0.0155 |
|
MOWN |
0.344963 |
0.167856 |
2.055111 |
0.0457 |
|
ROA |
0.121139 |
0.293119 |
0.413275 |
0.6814 |
|
SPREAD |
0.006849 |
0.002194 |
3.122310 |
0.0031 |
|
Source: Data processed with eviews 9, 2021 |
||||
Based on Table 11, the research hypotheses are:
1) Hypothesis 1: There is an effect of company size on earnings management
The probability value of company size (SIZE) < alpha 0.05 is 0.0155 < 0.05 and t count > t table is 2.5164 > 2.0141, this shows that company size has an effect on earnings management. The regression coefficient of 0.0484 indicates a positive direction. It means that company size has a positive effect on earnings management in manufacturing companies listed in LQ 45 for the 2016-2020 period. The conclusion of the study is to accept the first hypothesis.
2) Hypothesis 2: There is an effect of managerial ownership on earnings management
The probability value of managerial ownership (MOWN) < alpha 0.05 is 0.0457 < 0.05 and t count > t table is 2.0551 > 2.0141, this shows that managerial ownership has an effect on earnings management. The regression coefficient of 0.3449 indicates a positive direction. It means that managerial ownership positively affects earnings management in manufacturing companies listed in LQ 45 for the 2016-2020 period. The conclusion of the study is to accept the second hypothesis.
3) Hypothesis 3: There is an effect of profitability on earnings management
The probability value of profitability (ROA) > alpha 0.05 is 0.6814 > 0.05, and the t-count < t table is 0.4132 < 2.0141, this shows that profitability has no effect on earnings management in manufacturing companies listed in LQ 45 for the 2016-2020 period. The conclusion of the study is to reject the third hypothesis.
4) Hypothesis 4: Information asymmetry affects earnings management
The probability value of information asymmetry (SPREAD) < alpha 0.05 is 0.0031 < 0.05 and t count > t table is 3.1223 > 2.0141, this aspect shows that information asymmetry affects earnings management. The regression coefficient of 0.0068 indicates a positive direction. It means that information asymmetry positively affects earnings management in manufacturing companies listed in LQ 45 for the 2016-2020 period. The conclusion of the study is to accept the fourth hypothesis.
Simultaneous F test
|
Table 12 F Statistics Test Results |
|
|
R-squared |
0.314726 |
|
Adjusted
R-squared |
0.253812 |
|
S.E. of
regression |
0.059456 |
|
F-statistic |
5.166783 |
|
Prob(F-statistic) |
0.001638 |
|
Source: Data processed with eviews 9, 2021 |
|
Based on Table 12, the probability value of F-statistic is smaller than alpha (0.05) which is 0.0016 < 0.05, and f count > f table is 5.17 > 2.58; this shows that Profitability, Managerial Ownership, Company Size, and Asymmetry Information simultaneously affects earnings management in manufacturing companies listed in LQ 45 for the 2016-2020 period. The study's conclusion is to accept the fifth hypothesis, namely that there is an effect of Profitability, Managerial Ownership, Company Size, and Information Asymmetry on earnings management.
5. DISCUSSION
Company Size to Earnings Management
From the results of this study, it can be concluded that the company's size affects earnings management, which means that large companies have more complex operational activities than small companies, making them more likely to carry out earnings management. This study is in line with the research results from Agustia and Suryani (2018); this research is inversely proportional to research results from Purwanti et al. (2021) which states that company size does not affect earnings management.
Managerial Ownership to Earnings Management
From the results of this study, it can be concluded that managerial ownership has a positive effect, which means that the higher the managerial ownership, the higher the level of earnings management, and the lower the managerial ownership, the lower the level of earnings management. This study aligns with research results by Arlita et al. (2019).
Profitability to Earnings Management
From the results of this study, profitability does not affect earnings management because it affects management performance and the high level of profitability. The results of this study are in line with Gunawan (2015). However, the results of this study are not in line with research conducted by Giovani (2017) which states that profitability has a significant effect on earnings management.
Information Assymetry to Earnings Management
Information asymmetry is a factor that affects earnings management actions. It can be concluded from this study that information asymmetry affects earnings management. Furthermore, these results align with research conducted by Ni & Maria (2016) and Mahawyahrti and Budiasih (2016) which state that information asymmetry significantly affects earnings management. It shows that the higher the level of information asymmetry, the earnings management will increase, as happened to PT Indofood CBP Sukses Makmur Tbk (ICBP).
6. CONCLUSION IMPLICATION AND SUGGESTION
Conclusion
Based on the analysis and discussion in the research results conducted by the author is the following conclusions are as follows: (1) Company size partially has a significant positive effect with a coefficient of 0.049 and has a significance value of 0.015; (2) Managerial ownership partially has a significant positive effect with a coefficient of 0.345 and has a significance value of 0.046; (3) Profitability partially has no significant effect on earnings management with a coefficient of 0.121 and has a significance value of 0.681; (4) Partial information asymmetry has a significant positive effect with a coefficient of 0.007 and has a significance value of 0.003; (5) Company size, managerial ownership, profitability, and information asymmetry simultaneously significantly affect earnings management with an F-statistic value of 5.167 and an F-statistical profitability value of 0.001638.
Implication
In this study, managerial ownership affects earnings management. Therefore, investors must have concerned about the managerial ownership share. In addition, investors must also look at the company's performance not only from the company's ability to generate profits. For example, investors can see the company's performance from the company's internal controls.
Suggestion
Based on the results of this study, the authors provide suggestions that are expected to be helpful input for interested parties to conduct further research on the phenomenon of earnings management; the suggestions are as follows: (1) For further research, the authors hope to expand the sample—for example, industrial sector, banking sector, non-financial, and others; (2) For management, to pay more attention to aspects related to preparing the company's financial statements, making it easier for investors or interested parties to assess the company's condition; (3) The author hopes that the variables used need further attention to obtain relatively good findings.
REFERENCES
Agustia, Y. P., & Suryani, E. (2018). Pengaruh Ukuran Perusahaan, Umur Perusahaan, Leverage, Dan Profitabilitas Terhadap Manajemen Laba (Studi Pada Perusahaan Pertambangan Yang Terdaftar Di Bursa Efek Indonesia Periode 2014-2016). JURNAL ASET (AKUNTANSI RISET), 10, 63-74. Retrieved from Https://Ejournal.Upi.Edu/Index.Php/Aset/Article/View/12571
Aljana, B. T., & Purwanto, A. (2017). Pengaruh Profitabilitas, Struktur Kepemilikan Dan Kualitas Audit Terhadapmanajemen Laba (Studi Pada Perusahaan Manufaktur Yang Terdaftar Di Bursa Efek Indonesia Tahun 2013-2015). DIPONEGORO JOURNAL OF ACCOUNTING, 6(3), 1-15. Retrieved from Https://Ejournal3.Undip.Ac.Id/Index.Php/Accounting/Article/View/19239
Arlita, R., Bone, H., & Kesuma, A. I. (2019). Pengaruh Good Corporate Governance Dan Leverage Terhadap Praktik Manajemen. AKUNTABEL, 238-248. Retrieved from Http://Journal.Feb.Unmul.Ac.Id/Index.Php/AKUNTABEL/Article/View/6113/612
Desmiyawati, Nasrizal, & Y. F. (2009). Pengaruh Asimetri Informasi Dan Ukuran Perusahaan Terhadap Praktik Manajemen Laba Pada Perusahaan Manufaktur Yang Terdaftar Di Bursa Efek Indonesia. Pekbis Jurnal, 180-189. Retrieved from Https://Media.Neliti.Com/Media/Publications/8942-ID-Pengaruh-Asimetri-Informasi-Dan-Ukuran-Perusahaan-Terhadap-Praktik-Manajemen-Lab.Pdf
Donald Banjarnahor (2018) (Editor). (April 27). Drama Bank Bukopin: Kartu Kredit Modifikasi Dan Rights Issue. Www.Cnbcindonesia.Com: Retrieved From Https://Www.Cnbcindonesia.Com/Market/20180427144303-17-12810/Drama-Bank-Bukopin-Kartu-Kredit-Modifikasi-Dan-Rights-Issue
Dwi Ayuningtyas (2019) (Editor). ( May 29). Kalau Tak Ada Ini, PLN Rugi Hingga Rp 10 T Di 2018. Www.Cnbcindonesia.Com: Retrieved From Https://Www.Cnbcindonesia.Com/Market/20190529162012-17-75832/Kalau-Tak-Ada-Ini-Pln-Rugi-Hingga-Rp-10-T-Di-2018
(Editor), C. (2019) (April 30). Kronologi Kisruh Laporan Keuangan Garuda Indonesia. Www. Cnnindonesia. Com : Retrieved from Https://Www.Cnnindonesia.Com/Ekonomi/20190430174733-92-390927/Kronologi-Kisruh-Laporan-Keuangan-Garuda-Indonesia
G. I. (2015). Pengaruh Ukuran Perusahaan, Profitabilitas, Dan Leverage Terhadap Manajemen Laba Pada Perusahaan Manufaktur Yang Terdaftar Di Bursa Efek Indonesia. E-Journal Akuntansi Universitas Pendidikan Ganesha, 03, 1. Retrieved From Https://Ejournal.Undiksha.Ac.Id/
G. I., & R. D. (2013). Analisis Multivariat Dan Ekonometrika Teori, Konsep, Dan Aplikasi Dengan Eviews 8. Semarang: Badan Penerbit Universitas Diponegoro.
Giovani, M. (2017). PENGARUH STRUKTUR KEPEMILIKAN, TATA KELOLA PERUSAHAAN, DAN KARAKTERISTIK PERUSAHAAN TERHADAP MANAJEMEN LABA. Jurnal Akuntansi Bisnis. Retrieved From https://doi.org/10.24167/jab.v16i1.1367
H. D. (2011). Dasar-Dasar Teori Keuangan. Yogyakarta: Ekonisia.
J. M., & M. W. (1976). Theory Of The Firm: Managerial Behavior, Agency Cost And Ownership Structure. Journal Of Financial Economics, 3, 305-360. Retrieved From https://doi.org/10.1016/0304-405X(76)90026-X
K. W. (2011). Finanacial Accounting IFRS Edition. John Wiley & Sons, Inc.
Mahadewi, A. A., & Krisnadewi, K. A. (2017). PENGARUH KEPEMILIKAN MANAJERIAL, INSTITUSIONAL DAN PROPORSI DEWAN KOMISARIS INDEPENDEN PADA MANAJEMEN LABA. E-Jurnal Akuntansi Universitas Udayana. Retrieved From Https://Ojs.Unud.Ac.Id/Index.Php/Akuntansi/Article/View/24299
Mahawyahrti, P. T., & Budiasih, I. G. (2016). ASIMETRI INFORMASI, LEVERAGE, DAN UKURAN PERUSAHAAN PADA MANAJEMEN LABA. Jurnal Ilmiah Akuntansi Dan Bisnis. Retrieved from https://doi.org/10.24843/JIAB.2016.v11.i02.p05
Mutiarasari, R. (2016). Pengaruh Good Corporate Governance Dan Ukuran Perusahaan Terhadap Manajemen Laba. Universutas Psundan. Retrieved From Http://Repository.Unpas.Ac.Id/11731/
N. P., & M. M. (2016). PENGARUH ASIMETRI INFORMASI, LEVERAGE, KEPEMILIKAN MANAJERIAL DAN KEPEMILIKAN INSTITUSIONAL PADA MANAJEMEN LABA. E-Jurnal Akuntansi Universitas Udayana, Vol.15.3. Juni (2016): 1886-1914. Retrieved From Https://Ojs.Unud.Ac.Id/Index.Php/Akuntansi/Article/View/16390
Purwanti, P. I., Kepramareni, P., & Pradnyawati, S. O. (2021). PENGARUH CORPORATE GOVERNANCE, UKURAN PERUSAHAAN DAN LEVERAGE TERHADAP MANAJEMEN LABA PADA PERUSAHAAN MANUFAKTUR YANG TERDAFTAR DI BURSA EFEK INDONESIA PERIODE 2017-2019. JURNAL KHARISMA, 3. Retrieved From Https://E-Journal.Unmas.Ac.Id/Index.Php/Kharisma/Article/View/1693
Reschiwati, & Hasudungan, H. (2020) (September). FINANCIAL DISTRESS AND TAX MOTIVATION: THE EFFECT ON EARNINGS MANAGEMENT. DINASTI INTERNATIONAL JOURNAL OF ECONOMIC, FINANCE & ACCOUNTING, 1(4), 682-695. Retrieved From https://doi.org/10.38035/dijefa.v1i4.545
Sucipto, H., & Zulfa, U. (2021) (Februari). Pengaruh Good Corporate Governance, Financial Distress Dan Ukuran Perusahaan Terhadap Manajemen Laba. JAD: Jurnal Riset Akuntansi Dan Keuangan Dewantara, 4 (1). Retrieved From https://doi.org/10.26533/Jad.V4i1.737
Sudarmadji, A., & Sularto, L. (2007). Pengaruh Ukuran Perusahaan Profitabilitas, Leverage, Dan Tipe Kepemilikan Perusahaan Terhadap Luas Voluntary Disclousure Laporan Keuangan Tahunan. Proceeding PESAT, 2, 53-61. Retrieved From Http://Repository.Gunadarma.Ac.Id/Id/Eprint/1540
Sugiyono. (2013). Metode Penelitian Pendidikan Pendekatan Kuantitatif, Kualitatif, Dan R&D. Bandung: Alfabeta.
Suheriadi (2019) (Editor). ( July 29). Turun 23%, Laba Maybank Indonesia Hanya Rp757 Miliar. Infobanknews.Com: Retrieved From Https://Infobanknews.Com/Topnews/Turun-23-Laba-Maybank-Indonesia-Hanya-Rp757-Miliar/
Sutojo, S., & Aldridge, J. (2005). Good Corporate Governance. Jakarta: PT. Damar Mulia Pustaka.
Taco, C., & Ilat, V. (2016) ( Desember). Pengaruh Earning Power, Komisaris Independen, Dewan Direksi, Komite Audit Dan Ukuran Perusahaan Terhadap Manajemen Laba Pada Perusahaan Manufaktur Yang Terdaftar Di Bursa Efek Indonesia. Jurnal Emba, 4, 873-884. Retrieved From Https://Ejournal.Unsrat.Ac.Id/Index.Php/Emba/Article/View/14514
Ujiyantho, M., & Agus Pramuka, B. (2007). Mekanisme Corporate Governance, Manajemen Laba Dan Kinerja Keuangan. Simposiaun Nasional Akuntansi X, 1-26. Retrieved From Https://D1wqtxts1xzle7.Cloudfront.Net/54823498/Akpm-01-With-Cover-Page-V2.Pdf?Expires=1624894904&Signature=Hkijy9fmiokox17e3ofss4he8nmm2u77qs2qynq2aq6rwm2dujmlxqzrrepaan3gtabtwpfu7jooykfzismrugg4wn6a9vyjsmqxpac9hsh0ylp-3wpd~Zpowzvwdw-Pnqfcreedpsd06eja5f-B
Wahyu T.Rahmawati (2018) (Editor). (May 19). OJK Bekukan Izin Usaha SNP Finance. Keuangan.Kontan.Co.Id: Retrieved From Https://Keuangan.Kontan.Co.Id/News/Ojk-Bekukan-Izin-Usaha-Snp-Finance
Widyaningsih, H. (2017). PENGARUH CORPORATE GOVERNANCE TERHADAP MANAJEMEN LABA. STIEBBANK Yogyakarta. Retrieved From Https://Journal.Uny.Ac.Id/Index.Php/Nominal/Article/Viewfile/16652/9896
Wiryadi, A., & Sebrina, N. (2013) (Oktober). Pengaruh Asimetri Informasi, Kualitas Audit,Dan Struktur Kepemilikan Terhadap Manajemen Laba. WRA, 1 No.2, 155-180. Retrieved From Http://Ejournal.Unp.Ac.Id/Index.Php/Wra/Article/View/2577/2178
Www.Cnnindonesia.Com. (25 April 2019). Diambil Kembali Dari Www. Cnnindonesia.Com
 This work is licensed under a: Creative Commons Attribution 4.0 International License
© Granthaalayah 2014-2021. All Rights Reserved.