DETERMINANTS OF WORKING CAPITAL IN INDIAN REALTY SECTORDr. Shivakumar 1 1, 2 Department of Management Studies, Visvesvaraya Technological University, Mysuru, India. |
|
||
|
|
|||
|
Received 1 September 2021 Accepted 15 September2021 Published 30 September2021 Corresponding Author Dr.
Shivakumar, hulsoor.shiv06@gmail.com DOI 10.29121/granthaalayah.v9.i9.2021.4259 Funding:
This
research received no specific grant from any funding agency in the public,
commercial, or not-for-profit sectors. Copyright:
© 2021
The Author(s). This is an open access article distributed under the terms of
the Creative Commons Attribution License, which permits unrestricted use, distribution,
and reproduction in any medium, provided the original author and source are
credited.
|
ABSTRACT |
|
|
|
Working
capital is an important aspect which ensures the sufficient fund to maintain
the firm’s day-to-day operations and creates maximum value to the firm. As
working capital may have a major impact on profitability, understanding the
firm-specific determinants of working capital is important. This study has
been conducted on the firm-specific determinants of working capital in the
Indian Realty Sector. The independent
variables employed in the study includes firm size, asset tangibility,
leverage, profitability, sales growth, and fixed assets growth, while the
dependent variables employed in the study are inventory, receivables,
payables, and cash conversation days. The study is based on the sample of
thirteen companies of Indian Realty Sector, of which five were large-cap,
five were mid-cap, and three are small-cap companies. The study was conducted
for the period of 2011-20. The study employed fixed-effects panel regression
to analyse the significance of the firm-specific determinants of working
capital in the Indian Realty Sector. |
|
||
|
Keywords: Working
Capital, Leverage, Profitability, Growth, Panel Regression 1. INTRODUCTION Working Capital has been
very significant aspect of late as the major changes in the economy made the
accessibility of the external finance difficult (PwC, 2012). The working
capital is vital for the business organizations in these changing conditions,
which helps in maintaining sound solvency and liquidity position. It can be
said that better usage of working capital leads to encashment of competitive
advantage in the market in the form of investments. The large body of
research shows the importance of determinants of working capital management
and the benefits of effective utilization of working capital. The
identification of the significant determination of working capital is crucial
process as these determinants vary with the sectors. For any business to start they need not only fixed assets but also the
working capital. So, the firm needs to find out the adequate amount of
working to carry out the routine activities of buying raw material, meeting up
of day-to-day payments etc. Significance of Working
Capital. Business Solvency: The
firm can maintain the solvency with the adequate working capital in the
business with uninterrupted flow of production. Goodwill: The
timely payment of expenses such as tax and discount can be made with the
adequate working capital which allows the firm to maintain the goodwill. |
|
||
Convenient Loans: With the adequate working capital and liquid assets the firm can easily fetch the fund from the banks and financial institutions with better terms and conditions and sufficient investments in working capital can be used as good collateral for the unsecured fund.
Cash Discounts: If the firm maintains the adequate working capital can get the benefits like availing the cash discounts and can reduce the cost of purchase. Larger the purchase higher will be the cost saving in terms of discounts.
Favorable Market Conditions: Favorable market conditions can be explored with the adequate working capital. It is one of the best situations for the business firm as they can buy the raw material in bulk at a low price and save money for other productive activities.
Flexibility: Adequate working capital gives the flexibility to face the crisis situation of the business such as depression as there will be more pressure on working capital in those periods.
Regular and Quick Return: Generally, investors look for regular and quick return on their investment. So, maintaining working capital sufficiently will help the firm in paying the return to their investors on time without delay.
Literature Review
One of the main themes in the working capital literature is that of the determinants of working capital. Several studies have contributed to this theme, suggesting several important determinants of working capital. Some of the recent studies are reviewed in the following.
Gill (2011) found that working capital cycle, size of the firm, growth, and return on assets had significant impact on the working capital in the service industry. Abbadi and Abbadi (2013) found that cash flow, ROA, and cash cycle had a significant positive impact on working capital, while firm size and leverage had a significant negative impact on working capital. Salawu and Alao (2014) found that the significant determinants of working capital were sales growth, firm size, leverage, and GDP; they found that asset tangibility and trade cycle also determined working capital but were insignificant. Atseye et al. (2015) identified the internal/firm-level factors, which determine working capital as age, firm size, growth, risk, cash flows, and market share, and external factors such as rate of interest, tax rate, GDP, and so on. Oseifuah (2016) found that sales growth, capex, and debtors were major firm-specific factors affecting working capital and inflation, interest rate, economic growth, exchange rate were the external factors affecting the working capital management. Desriwendi and Prijadi (2018) found that the capex, dividend, and growth showed a significant positive impact on the cashholdings.
Several important determinants of working capital have been studied in the literature, including internal/firm-specific determinants such as firm size, asset tangibility, leverage, capex, operating cash flows, growth, profitability, and so on, and external determinants such as inflation, interest rates, tax rates, GDP, and so on. This paper examines the firm-specific determinants of working capital for the Indian Realty Sector.
2. METHODOLOGY
This paper examines the firm-specific determinants of working capital in the Indian Realty Sector. The firm-specific variables considered for the study include firm size (logarithm of total assets), asset tangibility (fixed assets to total assets), leverage (debt-equity ratio), profitability (return on assets), sales growth rate, and fixed assets growth rate, while the dependent variables considered for the study include inventory days, receivables days, payables days, and cash conversation days. The sample includes thirteen companies of the Indian Realty Sector, of which five were large-cap, five were mid-cap, and three were small-cap companies. The study period was 2011-20. The study uses fixed-effects panel regression to analyse the significance of the firm-specific determinants of working capital in the Indian Realty Sector. The model is given by
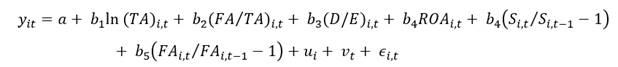
where the terms represent each of the determinants (firm size, asset tangibility, leverage, profitability, sales growth rate, and fixed assets growth rate, respectively), yt represents the dependent variables (viz. inventory days, receivables days, payables days, and cash conversation days), ui represents the ith firm fixed effect and vt represents the tth year fixed effect.
3. DISCUSSION
|
Table 1 Descriptive Statistics of Independent Variables |
|||||||
|
Asset Tangibility |
Debt to Equity |
Return on Assets |
Sales growth |
FA growth |
|||
|
DLF Ltd |
Mean |
11.0064 |
0.248 |
0.852 |
2.974 |
-0.0252 |
-0.0146 |
|
Std. Dev. |
0.08175 |
0.13637 |
0.1939 |
3.18539 |
0.20765 |
0.41158 |
|
|
Skewness |
-2.134 |
-0.755 |
-0.011 |
1.755 |
0.722 |
-0.053 |
|
|
Kurtosis |
5.265 |
-1.526 |
0.226 |
2.296 |
-0.895 |
3.124 |
|
|
Godrej Properties
Ltd |
Mean |
8.361 |
0.018 |
1.545 |
4.465 |
0.3207 |
0.1951 |
|
Std. Dev. |
0.65835 |
0.00632 |
0.43254 |
2.05932 |
0.34038 |
0.31016 |
|
|
Skewness |
-1.123 |
0.132 |
-0.113 |
0.818 |
0.092 |
0.706 |
|
|
Kurtosis |
-0.093 |
0.179 |
-1.028 |
-0.681 |
-0.141 |
-0.348 |
|
|
HDC Ltd |
Mean |
9.6865 |
0.018 |
0.41 |
2.95 |
-0.1089 |
0.2168 |
|
Std. Dev. |
0.21982 |
0.01033 |
0.22076 |
2.65913 |
0.28462 |
1.05147 |
|
|
Skewness |
-1.994 |
1.241 |
1.725 |
0.747 |
-0.226 |
2.905 |
|
|
Kurtosis |
3.419 |
0.946 |
3.372 |
-0.992 |
-1.75 |
8.604 |
|
|
Oberoi Realty Ltd |
Mean |
8.5342 |
0.139 |
0.104 |
9.784 |
0.1767 |
0.1678 |
|
Std. Dev. |
0.53061 |
0.07752 |
0.08462 |
5.57244 |
0.3629 |
0.58818 |
|
|
Skewness |
-0.782 |
-0.66 |
0.951 |
0.947 |
0.632 |
0.937 |
|
|
Kurtosis |
0.02 |
-1.501 |
0.756 |
-0.111 |
0.019 |
3.634 |
|
|
NCC Ltd |
Mean |
9.291 |
0.238 |
1.278 |
1.315 |
0.0698 |
0.1209 |
|
Std. Dev. |
0.20064 |
0.06426 |
0.46341 |
1.26342 |
0.11635 |
0.34976 |
|
|
Skewness |
-1.827 |
0.097 |
-0.277 |
1.089 |
0.815 |
1.087 |
|
|
Kurtosis |
2.779 |
-1.875 |
-0.793 |
-0.162 |
-0.07 |
0.073 |
|
|
Phoenix Ltd |
Mean |
8.4928 |
0.538 |
1.252 |
2.409 |
0.4694 |
0.3801 |
|
Std. Dev. |
0.45159 |
0.23318 |
0.65415 |
0.77184 |
0.68518 |
0.38885 |
|
|
Skewness |
-0.486 |
-0.361 |
-0.168 |
-0.403 |
1.931 |
1.434 |
|
|
Kurtosis |
-1.448 |
-1.91 |
-1.618 |
-0.67 |
3.936 |
2.196 |
|
|
Prestige Group |
Mean |
9.0358 |
0.243 |
1.271 |
3.177 |
0.2798 |
0.1449 |
|
Std. Dev. |
0.63767 |
0.12175 |
0.44167 |
1.00488 |
0.36236 |
0.38087 |
|
|
Skewness |
-0.159 |
-0.915 |
0.748 |
-0.274 |
-0.176 |
-1.41 |
|
|
Kurtosis |
-1.438 |
-1.172 |
-0.249 |
-1.433 |
-0.218 |
4.033 |
|
|
Suntech Realty Ltd |
Mean |
7.8044 |
0.031 |
0.843 |
2.586 |
0.3356 |
0.8127 |
|
Std. Dev. |
0.62799 |
0.02378 |
0.33217 |
2.67707 |
1.12968 |
2.72916 |
|
|
Skewness |
-1.787 |
1.835 |
-0.496 |
0.637 |
2.06 |
2.98 |
|
|
Kurtosis |
3.631 |
4.346 |
-0.336 |
-1.532 |
4.677 |
8.913 |
|
|
Pourvankara Ltd |
Mean |
8.3689 |
0.024 |
0.806 |
3.506 |
0.154 |
0.0815 |
|
Std. Dev. |
0.37114 |
0.00699 |
0.13737 |
1.61331 |
0.21214 |
0.24231 |
|
|
Skewness |
-0.225 |
-0.78 |
-0.382 |
0.12 |
0.541 |
-1.035 |
|
|
Kurtosis |
-1.582 |
-0.146 |
-0.721 |
-1.153 |
-0.665 |
2.67 |
|
|
Shobha Ltd |
Mean |
8.6102 |
0.083 |
0.858 |
3.627 |
0.1343 |
0.0642 |
|
Std. Dev. |
0.35475 |
0.02669 |
0.3412 |
1.2618 |
0.15449 |
0.23969 |
|
|
Skewness |
0.382 |
-0.095 |
2.585 |
-0.431 |
-1.359 |
0.837 |
|
|
Kurtosis |
-1.59 |
-1.509 |
7.461 |
-1.451 |
2.426 |
3.916 |
|
|
Brigade Group |
Mean |
8.1929 |
0.213 |
1.053 |
2.673 |
0.2233 |
0.3759 |
|
Std. Dev. |
0.48037 |
0.14758 |
0.38216 |
0.90168 |
0.24262 |
0.53836 |
|
|
Skewness |
0.408 |
0.746 |
0.405 |
2.219 |
-0.14 |
-1.105 |
|
|
Kurtosis |
-1.214 |
-1.354 |
-1.578 |
5.756 |
-1.533 |
2.125 |
|
|
Mean |
8.8691 |
0.057 |
1.143 |
0.171 |
-0.0928 |
0.1808 |
|
|
Parasvanth
Developers |
Std. Dev. |
0.16046 |
0.01889 |
0.39576 |
2.19312 |
0.29237 |
0.40984 |
|
Skewness |
-1.038 |
0.663 |
1.426 |
-0.611 |
0.629 |
1.933 |
|
|
Kurtosis |
0.027 |
-1.145 |
1.947 |
-0.254 |
-0.721 |
4.476 |
|
|
Indiabulls Real
Estate |
Mean |
9.5743 |
0.02 |
0.856 |
2.4 |
0.2297 |
0.0804 |
|
Std. Dev. |
0.24118 |
0.00943 |
0.83572 |
3.18924 |
0.60805 |
0.49245 |
|
|
Skewness |
-1.043 |
0 |
1.436 |
3.076 |
1.686 |
0.236 |
|
|
Kurtosis |
0.958 |
-2.129 |
0.611 |
9.6 |
3.314 |
-0.687 |
|
|
Industry |
Mean |
8.9098 |
0.1438 |
0.9439 |
3.2336 |
0.1646 |
0.2159 |
|
Std. Dev. |
0.90183 |
0.17265 |
0.54971 |
3.22964 |
0.46144 |
0.87128 |
|
|
Skewness |
0.481 |
1.865 |
0.544 |
2.258 |
2.705 |
6.715 |
|
|
Kurtosis |
0.667 |
3.6 |
-0.161 |
8.456 |
12.711 |
58.237 |
|
There was considerable variation in the independent variables. firm size (logarithm of total assets) varied with a mean of 8.90 and standard deviation of 0.90. Asset tangibility varied with a mean of 14.38% and standard deviation of 17.26%. Debt-equity ratio varied with a mean of 0.94 and standard deviation of 0.54. Return on assets varied with a mean of 3.23% and standard deviation of 3.22%. Sales growth varied with a mean of 16.46% and standard deviation of 46.14%. Fixed assets growth varied with a mean of 21.59% and standard deviation of 87.12%.
|
Table 2 Descriptives Study of Dependent Variables |
|||||
|
Company |
Inventory Days |
Receivable Days |
Payable Days |
Cash Conversion Cycle |
|
|
Mean |
705.082 |
79.127 |
148.584 |
635.625 |
|
|
DLF Ltd |
Std. Dev. |
204.50287 |
14.44655 |
30.59716 |
214.99189 |
|
Skewness |
0.229 |
0.741 |
-0.275 |
0.201 |
|
|
Kurtosis |
0.106 |
0.071 |
-1.511 |
0.36 |
|
|
Mean |
840.113 |
113.381 |
193.271 |
760.223 |
|
|
Godrej Properties
Ltd |
Std. Dev. |
156.373 |
144.11121 |
123.52452 |
182.72483 |
|
Skewness |
0.123 |
2.341 |
0.998 |
1.082 |
|
|
Kurtosis |
-0.987 |
5.416 |
-0.253 |
0.019 |
|
|
Mean |
3,945.99 |
148.243 |
444.779 |
3,649.45 |
|
|
HDC Ltd |
Std. Dev. |
2,097.12 |
111.52821 |
204.36236 |
2,137.53 |
|
Skewness |
0.318 |
0.796 |
1.488 |
0.48 |
|
|
Kurtosis |
-1.164 |
-0.713 |
1.526 |
-0.995 |
|
|
Mean |
677.129 |
27.838 |
37.981 |
666.986 |
|
|
Oberoi Realty Ltd |
Std. Dev. |
351.58684 |
8.63924 |
16.57682 |
356.05963 |
|
Skewness |
0.318 |
-0.106 |
0.619 |
0.339 |
|
|
Kurtosis |
-1.674 |
-1.035 |
-1.398 |
-1.717 |
|
|
Mean |
103.992 |
104.697 |
92.365 |
116.324 |
|
|
NCC Ltd |
Std. Dev. |
11.36313 |
41.03152 |
25.6557 |
23.20178 |
|
Skewness |
-0.217 |
1.705 |
1.536 |
1.769 |
|
|
Kurtosis |
-1.222 |
2.299 |
1.517 |
2.755 |
|
|
Mean |
183.795 |
67.675 |
155.978 |
95.492 |
|
|
Phoenix Ltd |
Std. Dev. |
122.83865 |
33.95587 |
144.72236 |
222.53487 |
|
Skewness |
-0.125 |
0.699 |
0.991 |
-1.052 |
|
|
Kurtosis |
-0.017 |
-1.257 |
-0.635 |
-0.397 |
|
|
Mean |
387.022 |
121.561 |
88.903 |
419.68 |
|
|
Prestige Group |
Std. Dev. |
76.57211 |
73.21503 |
20.83982 |
126.80752 |
|
Skewness |
0.906 |
2.171 |
0.49 |
2.008 |
|
|
Kurtosis |
-0.173 |
5.258 |
1.378 |
4.598 |
|
|
Mean |
4,239.60 |
183.88 |
3,261.06 |
1,162.42 |
|
|
Suntech Realty Ltd |
Std. Dev. |
2,504.88 |
182.49841 |
3,686.92 |
2,339.86 |
|
Skewness |
-0.362 |
1.358 |
0.742 |
-0.552 |
|
|
Kurtosis |
-1.583 |
0.913 |
-0.929 |
1.639 |
|
|
Mean |
966.046 |
82.238 |
95.518 |
952.766 |
|
|
Pourvankara Ltd |
Std. Dev. |
394.35071 |
9.12663 |
18.32943 |
384.72812 |
|
Skewness |
0.767 |
-0.562 |
-0.48 |
0.794 |
|
|
Kurtosis |
-0.815 |
-1.141 |
-1.02 |
-0.737 |
|
|
Mean |
452.517 |
60.921 |
105.359 |
408.079 |
|
|
Shobha Ltd |
Std. Dev. |
167.03882 |
50.03275 |
52.72296 |
175.91892 |
|
Skewness |
1.063 |
1.7 |
1.292 |
0.211 |
|
|
Kurtosis |
-0.596 |
1.825 |
3.289 |
-1.286 |
|
|
Mean |
437.485 |
9.907 |
98.588 |
348.804 |
|
|
Brigade Group |
Std. Dev. |
97.51321 |
5.10834 |
25.25008 |
92.03281 |
|
Skewness |
2.312 |
1.056 |
-0.069 |
1.599 |
|
|
Kurtosis |
6.264 |
0.867 |
-0.739 |
3.869 |
|
|
Mean |
2,320.87 |
559.37 |
1,088.11 |
1,792.14 |
|
|
Parasvanth
Developers |
Std. Dev. |
1,784.96 |
278.98303 |
859.89433 |
2,089.59 |
|
Skewness |
1.873 |
1.46 |
1.789 |
1.305 |
|
|
Kurtosis |
3.382 |
2.142 |
3.548 |
1.802 |
|
|
Mean |
1,121.10 |
183.405 |
41.705 |
1,262.80 |
|
|
Indiabulls Real
Estate |
Std. Dev. |
579.23426 |
152.28165 |
11.72352 |
628.45406 |
|
Skewness |
1.723 |
1.793 |
1.103 |
1.299 |
|
|
Kurtosis |
4.021 |
4.375 |
1.568 |
1.783 |
|
|
Mean |
1,260.06 |
134.0187 |
450.1686 |
943.9067 |
|
|
Std. Dev. |
1,667.54 |
173.95827 |
1,320.39 |
1,376.83 |
|
|
Industry |
Skewness |
2.357 |
3.115 |
5.269 |
2.185 |
|
Kurtosis |
4.802 |
12.516 |
30.012 |
7.882 |
|
There was also considerable variation in the dependent variables. Inventory days varied with a mean of 1260 days and a standard deviation of 1667 days. Receivable days varied with a mean of 134 days and standard deviation of 173 days. Payable’s days varied with a mean of 450 days and standard deviation of 1320 days. Finally, the cash conversion days varied with a mean of 943 days and a standard deviation of 1376 days.
|
Table 3 Tests of Between-Subjects Effects |
|||||
|
Source |
Type III Sum of
Squares |
df |
Mean Square |
F |
Sig. |
|
Corrected Model |
279095719.075(a) |
26 |
10,734,450.734 |
16.317 |
0.000 |
|
Intercept |
16,243,444.071 |
1 |
16,243,444.071 |
24.691 |
0.000 |
|
company |
154,307,541.630 |
12 |
12,858,961.802 |
19.547 |
0.000 |
|
year |
10,969,234.788 |
8 |
1,371,154.348 |
2.084 |
0.046 |
|
lnTA |
13,680,401.702 |
1 |
13,680,401.702 |
20.795 |
0.000 |
|
Asset Tangibility |
274,532.600 |
1 |
274,532.600 |
0.417 |
0.520 |
|
Debt to Equity |
5,795,433.973 |
1 |
5,795,433.973 |
8.810 |
0.004 |
|
Return on Assets |
17,809,224.759 |
1 |
17,809,224.759 |
27.071 |
0.000 |
|
Growth rate Sales |
1,156,749.069 |
1 |
1,156,749.069 |
1.758 |
0.188 |
|
Growth rate Fixed
assets |
670,220.330 |
1 |
670,220.330 |
1.019 |
0.316 |
|
Error |
57,891,592.405 |
88 |
657,859.005 |
||
|
Total |
526,792,743.593 |
115 |
|||
|
Corrected Total |
336,987,311.480 |
114 |
|||
|
a. R Squared = .828
(Adjusted R Squared = .777) |
|||||
|
Table 3a Parameter Estimates |
||||||
|
Dependent Variable: Inventory Days |
||||||
|
95% Confidence Interval |
||||||
|
Parameter |
B |
Std.
Error |
t |
Sig. |
Lower Bound |
Upper Bound |
|
Intercept |
20,424.233 |
4,166.810 |
4.902 |
0.000 |
12,143.573 |
28,704.893 |
|
DLF |
2,594.275 |
789.768 |
3.285 |
0.001 |
1,024.776 |
4,163.774 |
|
Godrej Properties |
-2,205.303 |
630.598 |
-3.497 |
0.001 |
-3,458.484 |
-952.122 |
|
HDC |
3,823.206 |
438.943 |
8.710 |
0.000 |
2,950.900 |
4,695.512 |
|
Oberoi Realty |
-3.703 |
599.991 |
-0.006 |
0.995 |
-1,196.060 |
1,188.654 |
|
NCC |
-1,778.625 |
466.344 |
-3.814 |
0.000 |
-2,705.385 |
-851.865 |
|
Phoenix |
-2,698.457 |
773.457 |
-3.489 |
0.001 |
-4,235.542 |
-1,161.373 |
|
Prestige Group |
-1,338.451 |
474.466 |
-2.821 |
0.006 |
-2,281.353 |
-395.548 |
|
Suntech Realty |
416.120 |
785.257 |
0.530 |
0.598 |
-1,144.413 |
1,976.653 |
|
Puravankara |
-2,092.876 |
616.353 |
-3.396 |
0.001 |
-3,317.747 |
-868.004 |
|
Shobha |
-1,929.656 |
545.369 |
-3.538 |
0.001 |
-3,013.462 |
-845.850 |
|
Brigade Group |
-3,081.756 |
698.039 |
-4.415 |
0.000 |
-4,468.961 |
-1,694.551 |
|
Parsvanth |
-663.874 |
513.714 |
-1.292 |
0.200 |
-1,684.774 |
357.025 |
|
Indiabulls Realty |
0(a) |
. |
. |
. |
. |
. |
|
[year=2011] |
-1,593.342 |
474.663 |
-3.357 |
0.001 |
-2,536.635 |
-650.048 |
|
[year=2012] |
-1,310.913 |
420.625 |
-3.117 |
0.002 |
-2,146.817 |
-475.008 |
|
[year=2013] |
-1,384.190 |
378.755 |
-3.655 |
0.000 |
-2,136.887 |
-631.493 |
|
[year=2014] |
-921.317 |
367.132 |
-2.509 |
0.014 |
-1,650.915 |
-191.719 |
|
[year=2015] |
-795.938 |
360.074 |
-2.210 |
0.030 |
-1,511.509 |
-80.366 |
|
[year=2016] |
-947.802 |
340.643 |
-2.782 |
0.007 |
-1,624.760 |
-270.845 |
|
[year=2017] |
-827.996 |
335.929 |
-2.465 |
0.016 |
-1,495.583 |
-160.408 |
|
[year=2018] |
-604.287 |
327.479 |
-1.845 |
0.068 |
-1,255.083 |
46.509 |
|
[year=2019] |
0(a) |
. |
. |
. |
. |
. |
|
Ln TA |
-1,931.494 |
423.556 |
-4.560 |
0.000 |
-2,773.222 |
-1,089.766 |
|
Asset Tangibility |
-629.071 |
973.799 |
-0.646 |
0.520 |
-2,564.292 |
1,306.149 |
|
Debt to Equity |
679.170 |
228.824 |
2.968 |
0.004 |
224.430 |
1,133.910 |
|
Return on Assets |
-221.130 |
42.500 |
-5.203 |
0.000 |
-305.590 |
-136.670 |
|
Growth rate Sales |
-269.309 |
203.094 |
-1.326 |
0.188 |
-672.916 |
134.298 |
|
Growth rate Fixed Assets |
103.016 |
102.062 |
1.009 |
0.316 |
-99.810 |
305.843 |
|
a. This parameter
is set to zero because it is redundant. |
||||||
There was found to be a significant difference in inventory days between the companies controlling for other variables, with DLF and HDC having significantly higher inventory days than Indiabulls, which in turn had significantly higher inventory days than Godrej, NCC, Phoenix, Prestige, Puravankara, Shobha and Brigade. There was also found to be a significant trend increase in inventory days across the research period, controlling for other variables. Also, controlling for differences between companies and years, there was found to be a significant negative size effect, a significant positive leverage effect, a significant negative return on assets effect with no other company-level variable having a significant impact on inventory days.
|
Table 4 Tests of Between-Subjects
Effects |
|||||
|
Dependent Variable: Receivable Days |
|||||
|
Source |
Type III Sum of Squares |
df |
Mean Square |
F |
Sig. |
|
Corrected Model |
2668719.890(a) |
26 |
102,643.073 |
11.506 |
0.000 |
|
Intercept |
243,565.831 |
1 |
243,565.831 |
27.303 |
0.000 |
|
company |
1,638,867.019 |
12 |
136,572.252 |
15.309 |
0.000 |
|
year |
216,356.439 |
8 |
27,044.555 |
3.032 |
0.005 |
|
lnTA |
223,955.034 |
1 |
223,955.034 |
25.105 |
0.000 |
|
Asset Tangibility |
2,787.876 |
1 |
2,787.876 |
0.313 |
0.578 |
|
Debt to Equity |
179,324.337 |
1 |
179,324.337 |
20.102 |
0.000 |
|
Return on Assets |
64,312.135 |
1 |
64,312.135 |
7.209 |
0.009 |
|
Growth rate Sales |
8,761.817 |
1 |
8,761.817 |
0.982 |
0.324 |
|
Growth rate Fixed assets |
81,784.463 |
1 |
81,784.463 |
9.168 |
0.003 |
|
Error |
785,029.614 |
88 |
8,920.791 |
||
|
Total |
5,493,603.639 |
115 |
|||
|
Corrected Total |
3,453,749.504 |
114 |
|||
|
a. R Squared = .773
(Adjusted R Squared = .706) |
|||||
|
Table 4a Parameter
Estimates |
||||||
|
Dependent Variable: Receivable Days |
||||||
|
95% Confidence Interval |
||||||
|
Parameter |
B |
Std.
Error |
t |
Sig. |
Lower Bound |
Upper Bound |
|
Intercept |
2,614.283 |
485.220 |
5.388 |
0.000 |
1,650.010 |
3,578.557 |
|
DLF |
256.596 |
91.968 |
2.790 |
0.006 |
73.830 |
439.363 |
|
Godrej Properties |
-419.012 |
73.432 |
-5.706 |
0.000 |
-564.944 |
-273.081 |
|
HDC |
78.644 |
51.114 |
1.539 |
0.127 |
-22.935 |
180.223 |
|
Oberoi Realty |
-195.378 |
69.868 |
-2.796 |
0.006 |
-334.226 |
-56.529 |
|
NCC |
-184.870 |
54.305 |
-3.404 |
0.001 |
-292.790 |
-76.950 |
|
Phoenix |
-376.537 |
90.068 |
-4.181 |
0.000 |
-555.529 |
-197.545 |
|
Prestige Group |
-177.458 |
55.251 |
-3.212 |
0.002 |
-287.258 |
-67.658 |
|
Suntech Realty |
-328.753 |
91.442 |
-3.595 |
0.001 |
-510.475 |
-147.031 |
|
Puravankara |
-369.247 |
71.774 |
-5.145 |
0.000 |
-511.882 |
-226.612 |
|
Shobha |
-331.209 |
63.508 |
-5.215 |
0.000 |
-457.417 |
-205.001 |
|
Brigade Group |
-498.592 |
81.286 |
-6.134 |
0.000 |
-660.131 |
-337.054 |
|
Parsvanth |
131.256 |
59.821 |
2.194 |
0.031 |
12.374 |
250.139 |
|
Indiabulls Realty |
0(a) |
. |
. |
. |
. |
. |
|
[year=2011] |
-194.198 |
55.274 |
-3.513 |
0.001 |
-304.043 |
-84.352 |
|
[year=2011] |
-185.387 |
48.981 |
-3.785 |
0.000 |
-282.727 |
-88.047 |
|
[year=2012] |
-156.341 |
44.106 |
-3.545 |
0.001 |
-243.992 |
-68.690 |
|
[year=2014] |
-109.712 |
42.752 |
-2.566 |
0.012 |
-194.673 |
-24.751 |
|
[year=2015] |
-131.251 |
41.930 |
-3.130 |
0.002 |
-214.578 |
-47.923 |
|
[year=2016] |
-147.145 |
39.668 |
-3.709 |
0.000 |
-225.976 |
-68.314 |
|
[year=2017] |
-137.827 |
39.119 |
-3.523 |
0.001 |
-215.567 |
-60.088 |
|
[year=2018] |
-72.382 |
38.135 |
-1.898 |
0.061 |
-148.167 |
3.402 |
|
[year=2019] |
0(a) |
. |
. |
. |
. |
. |
|
Ln TA |
-247.129 |
49.323 |
-5.010 |
0.000 |
-345.148 |
-149.111 |
|
Asset Tangibility |
-63.393 |
113.398 |
-0.559 |
0.578 |
-288.747 |
161.962 |
|
Debt to Equity |
119.469 |
26.646 |
4.484 |
0.000 |
66.515 |
172.423 |
|
Return on Assets |
-13.288 |
4.949 |
-2.685 |
0.009 |
-23.124 |
-3.453 |
|
Growth rate Sales |
-23.438 |
23.650 |
-0.991 |
0.324 |
-70.438 |
23.561 |
|
Growth rate Fixed Assets |
-35.986 |
11.885 |
-3.028 |
0.003 |
-59.605 |
-12.367 |
|
a. This parameter
is set to zero because it is redundant. |
||||||
There was found to be a significant difference in receivable days between the companies controlling for other variables, with DLF and Parsvanth having significantly higher receivable days than Indiabulls, which in turn has significantly higher receivable days than others except HDC. There was also found to be a significant trend increase in receivable days across the research period, controlling for other variables. In addition, controlling for differences between companies and years, there was found to be a significant negative size effect and a significant negative asset tangibility, a significant negative growth of sales and a significant negative growth of fixed assets effect, with no other company-level variable having a significant impact on receivable days.
|
Table 5 Tests of
Between-Subjects Effects |
|||||
|
Dependent Variable: Payable Days |
|||||
|
Source |
Type III Sum of Squares |
df |
Mean Square |
F |
Sig. |
|
Corrected Model |
131339603.328(a) |
26 |
5,051,523.205 |
5.143 |
0.000 |
|
Intercept |
3,103,517.291 |
1 |
3,103,517.291 |
3.160 |
0.079 |
|
company |
72,495,330.635 |
12 |
6,041,277.553 |
6.150 |
0.000 |
|
year |
8,623,905.576 |
8 |
1,077,988.197 |
1.097 |
0.373 |
|
lnTA |
2,863,723.926 |
1 |
2,863,723.926 |
2.915 |
0.091 |
|
Asset Tangibility |
1,511,702.951 |
1 |
1,511,702.951 |
1.539 |
0.218 |
|
Debt to Equity |
8,988,380.177 |
1 |
8,988,380.177 |
9.151 |
0.003 |
|
Return on Assets |
4,425,719.228 |
1 |
4,425,719.228 |
4.506 |
0.037 |
|
Growth rate Sales |
1,259,661.289 |
1 |
1,259,661.289 |
1.282 |
0.261 |
|
Growth rate Fixed Assets |
210,496.796 |
1 |
210,496.796 |
0.214 |
0.645 |
|
Error |
86,437,677.476 |
88 |
982,246.335 |
||
|
Total |
242,737,398.130 |
115 |
|||
|
Corrected Total |
217,777,280.803 |
114 |
|||
|
a. R Squared = .603
(Adjusted R Squared = .486) |
|||||
|
Table 5a Parameter
Estimates |
||||||
|
Dependent Variable: Payable Days |
||||||
|
|
95% Confidence Interval |
|||||
|
Parameter |
B |
Std.
Error |
t |
Sig. |
Lower Bound |
Upper Bound |
|
Intercept |
8,090.039 |
5,091.521 |
1.589 |
0.116 |
-2,028.288 |
18,208.367 |
|
DLF |
1,630.202 |
965.036 |
1.689 |
0.095 |
-287.604 |
3,548.009 |
|
Godrej Properties |
-1,087.438 |
770.542 |
-1.411 |
0.162 |
-2,618.729 |
443.853 |
|
HDC |
902.130 |
536.354 |
1.682 |
0.096 |
-163.761 |
1,968.021 |
|
Oberoi Realty |
718.623 |
733.143 |
0.980 |
0.330 |
-738.345 |
2,175.591 |
|
NCC |
-333.996 |
569.836 |
-0.586 |
0.559 |
-1,466.425 |
798.433 |
|
Phoenix |
-353.375 |
945.105 |
-0.374 |
0.709 |
-2,231.573 |
1,524.823 |
|
Prestige Group |
-217.750 |
579.761 |
-0.376 |
0.708 |
-1,369.904 |
934.404 |
|
Suntech Realty |
2,237.010 |
959.523 |
2.331 |
0.022 |
330.159 |
4,143.861 |
|
Puravankara |
-848.635 |
753.135 |
-1.127 |
0.263 |
-2,345.334 |
648.063 |
|
Shobha |
-445.091 |
666.399 |
-0.668 |
0.506 |
-1,769.419 |
879.236 |
|
Brigade Group |
-990.773 |
852.949 |
-1.162 |
0.249 |
-2,685.831 |
704.284 |
|
Parsvanth |
-47.460 |
627.719 |
-0.076 |
0.940 |
-1,294.920 |
1,200.001 |
|
Indiabulls Realty |
0(a) |
. |
. |
. |
. |
. |
|
[year=2011] |
-66.829 |
580.002 |
-0.115 |
0.909 |
-1,219.461 |
1,085.802 |
|
[year=2012] |
364.622 |
513.972 |
0.709 |
0.480 |
-656.789 |
1,386.032 |
|
[year=2013] |
432.350 |
462.810 |
0.934 |
0.353 |
-487.388 |
1,352.087 |
|
[year=2014] |
406.391 |
448.607 |
0.906 |
0.367 |
-485.122 |
1,297.904 |
|
[year=2015] |
223.834 |
439.983 |
0.509 |
0.612 |
-650.540 |
1,098.207 |
|
[year=2016] |
-168.498 |
416.240 |
-0.405 |
0.687 |
-995.687 |
658.692 |
|
[year=2017] |
-421.088 |
410.479 |
-1.026 |
0.308 |
-1,236.829 |
394.652 |
|
[year=2018] |
-414.998 |
400.154 |
-1.037 |
0.303 |
-1,210.221 |
380.225 |
|
[year=2019] |
0(a) |
. |
. |
. |
. |
. |
|
lnTA |
-883.709 |
517.552 |
-1.707 |
0.091 |
-1,912.236 |
144.817 |
|
Asset Tangibility |
-1,476.169 |
1,189.907 |
-1.241 |
0.218 |
-3,840.860 |
888.521 |
|
Debt to Equity |
845.816 |
279.605 |
3.025 |
0.003 |
290.159 |
1,401.474 |
|
Return on Assets |
-110.234 |
51.932 |
-2.123 |
0.037 |
-213.438 |
-7.030 |
|
Growth rate Sales |
-281.033 |
248.165 |
-1.132 |
0.261 |
-774.210 |
212.143 |
|
Growth rate Fixed Assets |
57.732 |
124.712 |
0.463 |
0.645 |
-190.106 |
305.571 |
|
a. This parameter
is set to zero because it is redundant. |
||||||
There was found to be a significant difference in payable days between the companies controlling for other variables, with Suntech Realty having significantly higher payable days than Indiabulls, which in turn had significantly higher payable days than other selected companies in the sector. There was also found to be no significant trend in payable days across the research period, controlling for other variables. In addition, controlling for differences between companies and years, there was found to be a significant negative size effect, a significant negative asset tangibility effect, a significant negative return on assets effect, and a significant negative growth of sales effect, with no other company-level variable having a significant impact on payables days.
|
Table 6 Tests of
Between-Subjects Effects |
|||||
|
Dependent Variable: Cash Conversion Cycle |
|||||
|
Source |
Type III Sum of Squares |
df |
Mean Square |
F |
Sig. |
|
Corrected Model |
144037163.330(a) |
26 |
5,539,890.897 |
5.304 |
0.000 |
|
Intercept |
7,629,523.851 |
1 |
7,629,523.851 |
7.304 |
0.008 |
|
company |
74,915,618.730 |
12 |
6,242,968.228 |
5.977 |
0.000 |
|
year |
23,490,113.312 |
8 |
2,936,264.164 |
2.811 |
0.008 |
|
lnTA |
6,148,850.023 |
1 |
6,148,850.023 |
5.887 |
0.017 |
|
Asset Tangibility |
426,088.274 |
1 |
426,088.274 |
0.408 |
0.525 |
|
Debt to Equity |
27,964.179 |
1 |
27,964.179 |
0.027 |
0.870 |
|
Return on Assets |
5,616,694.991 |
1 |
5,616,694.991 |
5.377 |
0.023 |
|
Growth rate Sales |
2,188.457 |
1 |
2,188.457 |
0.002 |
0.964 |
|
Growth rate Fixed Assets |
5,459.839 |
1 |
5,459.839 |
0.005 |
0.943 |
|
Error |
91,920,155.285 |
88 |
1,044,547.219 |
||
|
Total |
340,185,363.119 |
115 |
|||
|
Corrected Total |
235,957,318.616 |
114 |
|||
|
a. R Squared = .610
(Adjusted R Squared = .495) |
|||||
|
Table 6a Parameter Estimates |
||||||
|
Dependent Variable: Cash Conversion Cycle |
||||||
|
95% Confidence Interval |
||||||
|
Parameter |
B |
Std. Error |
t |
Sig. |
Lower Bound |
Upper Bound |
|
Intercept |
14,948.477 |
5,250.508 |
2.847 |
0.005 |
4,514.195 |
25,382.759 |
|
DLF |
1,220.669 |
995.170 |
1.227 |
0.223 |
-757.022 |
3,198.361 |
|
Godrej Properties |
-1,536.877 |
794.603 |
-1.934 |
0.056 |
-3,115.984 |
42.230 |
|
HDC |
2,999.720 |
553.102 |
5.423 |
0.000 |
1,900.546 |
4,098.895 |
|
Oberoi Realty |
-917.703 |
756.036 |
-1.214 |
0.228 |
-2,420.167 |
584.760 |
|
NCC |
-1,629.499 |
587.630 |
-2.773 |
0.007 |
-2,797.289 |
-461.708 |
|
Phoenix |
-2,721.620 |
974.617 |
-2.793 |
0.006 |
-4,658.467 |
-784.773 |
|
Prestige Group |
-1,298.158 |
597.865 |
-2.171 |
0.033 |
-2,486.289 |
-110.027 |
|
Suntech Realty |
-2,149.643 |
989.485 |
-2.172 |
0.033 |
-4,116.037 |
-183.249 |
|
Puravankara |
-1,613.487 |
776.653 |
-2.077 |
0.041 |
-3,156.922 |
-70.053 |
|
Shobha |
-1,815.774 |
687.208 |
-2.642 |
0.010 |
-3,181.455 |
-450.093 |
|
Brigade Group |
-2,589.575 |
879.584 |
-2.944 |
0.004 |
-4,337.562 |
-841.587 |
|
Parsvanth |
-485.158 |
647.320 |
-0.749 |
0.456 |
-1,771.572 |
801.255 |
|
Indiabulls Realty |
0(a) |
. |
. |
. |
. |
. |
|
[year=2011] |
-1,720.710 |
598.113 |
-2.877 |
0.005 |
-2,909.334 |
-532.086 |
|
[year=2012] |
-1,860.921 |
530.021 |
-3.511 |
0.001 |
-2,914.227 |
-807.616 |
|
[year=2013] |
-1,972.880 |
477.262 |
-4.134 |
0.000 |
-2,921.337 |
-1,024.423 |
|
[year=2014] |
-1,437.421 |
462.616 |
-3.107 |
0.003 |
-2,356.772 |
-518.069 |
|
[year=2015] |
-1,151.022 |
453.722 |
-2.537 |
0.013 |
-2,052.699 |
-249.346 |
|
[year=2016] |
-926.450 |
429.237 |
-2.158 |
0.034 |
-1,779.469 |
-73.431 |
|
[year=2017] |
-544.735 |
423.296 |
-1.287 |
0.202 |
-1,385.948 |
296.478 |
|
[year=2017] |
-261.671 |
412.650 |
-0.634 |
0.528 |
-1,081.725 |
558.383 |
|
[year=2019] |
0(a) |
. |
. |
. |
. |
. |
|
lnTA |
-1,294.914 |
533.713 |
-2.426 |
0.017 |
-2,355.557 |
-234.271 |
|
Asset Tangibility |
783.705 |
1,227.063 |
0.639 |
0.525 |
-1,654.825 |
3,222.235 |
|
Debt to Equity |
-47.178 |
288.336 |
-0.164 |
0.870 |
-620.186 |
525.830 |
|
Return on Assets |
-124.184 |
53.554 |
-2.319 |
0.023 |
-230.611 |
-17.757 |
|
Growth rate Sales |
-11.714 |
255.915 |
-0.046 |
0.964 |
-520.291 |
496.863 |
|
Growth rate Fixed Assets |
9.298 |
128.606 |
0.072 |
0.943 |
-246.279 |
264.875 |
|
a. This parameter
is set to zero because it is redundant. |
||||||
4. CONCLUSIONS AND RECOMMENDATIONS
A significant negative size effect on inventory days shows that the large companies will keet the low level of inventories in proportion to change in sales. The large companies will make use of their supply chain network more efficiently than small ones. The negative size effect on receivable days shows that the large companies use their market power, which helps in lowering the terms of receivable. The negative size effect on cash conversion days, which shows that the large firms with the use of their market power and are able to hold the suppliers for long. This reduces the cash conversion days. The findings are on par with the studies Mongrut et al. (2014), Nazir and Afza (2009), Moss and Stein (1993),Chiou et al. (2006). There was found to be a significant positive effect of leverage on inventory days, which suggests that companies will maintain higher level of inventory with the use of high debt. Here, the firms do attract external finance for inventories with the view that they will be able to sell and make profits as and when they get orders. They can earn more than the interest cost. With respect to receivable and payable days there was found to be a significant positive effect of leverage indicating the companies having higher debt tend to have higher credit terms and the companies with high debt generally negotiates for payment terms with suppliers. This is due to the better access to the capital market, which in turn re-distributes the capital to the firm, which has poor access via commercial credit to get the competitive advantage (or foregone discounts). These results are consistent with the studies Nakamura and Palombini (2009), Niskanen and Niskanen (2006). The results shows a significant negative effect of return on assets on inventory, receivable, payable and cash conversion days. This suggests that the profitability is the key determinant of working capital in Indian Realty Sector. The firms with the high profits have sufficient cash to invest as a reason they are not concerned about the Working Capital. It was also found that the firm increases the value of shareholders by reducing receivable and increase creditors to improve the Working Capital position. The study goes with the Pecking Order Theory Myers and Majluf (1984), Fatimatuzzahra and Kusumastuti (2016) suggesting the inverse association between profitability and working capital.
There results also indicate a significant negative effect of growth of fixed assets on the receivable days highlights that companies with high growth tend to invest less in receivable. The pursuit of favorable extended credit policies may lead to higher sales while commitment to increase the sales needs more commitment in the receivables. It is in consistent with the Pecking Order Theory, which says higher growth level companies will prefer internal funds to finance the growth.
REFERENCES
Abbadi, S.M. and Abbadi, R.T. (2013). The Determinants of Working Capital Requirements in Palestinian Industrial Corporations. International Journal of Economics and Finance, 5(1), 65-75. Retrieved from https://doi.org/10.5539/ijef.v5n1p65
Atseye, F.A., Ugwu, J.I., and Takon, S.M. (2015). Determinants of Working Capital Management Theoretical Review. International Journal of Economics, Commerce and Management, 4(2), 1-11. Retrieved from http://citeseerx.ist.psu.edu/viewdoc/download?doi=10.1.1.676.7649&rep=rep1&type=pdf
Banos-Caballero, S, Garcı'a-Teruel, PJ & Martı'nez-Solano, P (2010a), 'Working capital Management in SMEs', Accounting and Finance, vol.50, pp511-527. Retrieved from https://doi.org/10.1111/j.1467-629X.2009.00331.x
Blazenko, G & Vandezande, K (2003), 'Corporate Holdings of Finished Goods Inventories', Journal of Economics and Business, vol.55, pp255-266. Retrieved from https://doi.org/10.1016/S0148-6195(03)00023-7
Chiou, J-R, Cheng, L & Wu, H-W (2006), 'The Determinants of Working Capital Management', Journal of American Academy of Business, vol.10, no.1, pp149-155.
Desriwendi, and Prijadi, R. (2018). The Factors Affecting the Company's Cash Holding: Empirical Study of Listed Manufacturing Companies in Indonesia. International Journal of Business Management & Research, 8(1), 1-10. Retrieved from https://doi.org/10.24247/ijbmrfeb20181
D'Mello, R, Krishnaswami, S & Larkin, PJ (2008), 'Determinants of Corporate Cash Holdings: Evidence from Spin-offs', Journal of Banking and Finance, vol.32, pp1209-1220. Retrieved from https://doi.org/10.1016/j.jbankfin.2007.10.005
Deloof, M (2003), 'Does Working Capital Management Affect Profitability of Belgian Firms?', Journal of Business Finance and Accounting, vol.30, no.3 & 4, pp573-587. Retrieved from https://doi.org/10.1111/1468-5957.00008
Fatimatuzzahra, M., & Kusumastuti, R. (2016). The Determinants of Working Capital Management of Manufacturing Companies. Member, 32(2), 276-281. Retrieved from https://doi.org/10.29313/mimbar.v32i2.1872
Fazzari, SM & Petersen, B (1993), 'Working capital and fixed investment: new evidence on financing constraints', Rand Journal of Economics, vol.24, pp328-342. Retrieved from https://doi.org/10.2307/2555961
Ferreira, MA & Vilela, AS (2004), 'Why do Firms Hold Cash? Evidence from EMU countries', European Financial Management, vol.10, no.2, pp295-319. Retrieved from https://doi.org/10.1111/j.1354-7798.2004.00251.x
Garcia-Teruel, PJ & Martinez-Solano, P (2007), 'Effects of Working Capital Management on SME Profitability', International Journal of Managerial Finance, vol.3, no.2, pp164. Retrieved from https://doi.org/10.1108/17439130710738718
Ghosh, SK & Maji, SG (2004), 'Working Capital Management Efficiency: A Study on the Indian Cement Industry', Management Accountant, vol.39, no.5, pp363-372. Retrieved from https://d1wqtxts1xzle7.cloudfront.net/35753207/Working_captal_management_efficiency-with-cover-page-v2.pdf?Expires=1633085065&Signature=KSV-8YHb2JBuWyt4OFKsqJVZunhyfUuGpYV41yVktB93Damzr37gKw1n7WPEy5x6p5-n1KbTOXW5akB7zfGbLnPaKfETQXDRtt2dm2C6-PQP0MRXdTMDKdqXXGRqFKecNzJJZOCOQrLP305myJYYmxcg2CT7KA-mvJU4RmJ~mD6MFPGPwFS4bABIhW~gL8HitzjAlbbQxAWzDvCnzAqggLt5BhGw26KrMO94kpeHOPFM2au-oX~WTopKnhLh0qK~tmqEghALEi353xmzTtJYlMtDQLwTHsl0ugxhgVqxBM~sAftg~KQtdUBGK5aVwcbVpki~u7nvcKjSS5MaazJ7mQ__&Key-Pair-Id=APKAJLOHF5GGSLRBV4ZA
Gill, A. (2011). Factors that Influence Working Capital Requirements in Canada. Economics and Finance Review, 1(3), 30-40. Retrieved from https://www.researchgate.net/profile/Amarjit-Gill/publication/268350639_Factors_that_influence_working_capital_requirements_in_Canada/links/55ca327808aeb975674a4668/Factors-that-influence-working-capital-requirements-in-Canada.pdf
Hawawini, G, Viallet, C & Vora, A (1986), 'Industry Influence on Corporate Working Capital Decisions', Sloan Management Review, vol.27, no.4, pp15-24. Retrieved from https://mpra.ub.uni-muenchen.de/44894/1/MPRA_paper_44894.pdf
Kargar, J & Blumenthal, RA (1994), 'Leverage Impact on Working Capital in Small Businesses', TMA Journal, vol.14, no.6, pp46-51.
Lamberson, M (1995), 'Changes in Working Capital of Small Firms in Relation to Changes in Economic Activity', Mid-American Journal of Business, vol.10, no.2, pp45-50. Retrieved from https://doi.org/10.1108/19355181199500015
Mathuva, DM (2009), 'Influence of Working Capital Management Components on Corporate Profitability: A Survey on Kenyan Listed Firms', Research Journal of Business Management, vol.3, pp1-11. Retrieved from https://doi.org/10.3923/rjbm.2010.1.11
Mongrut, S., Fuenzalida O'shee, D., Cubillas Zavaleta, C., & Cubillas Zavaleta, J. (2014). Determinants of Working Capital Management in Latin American Companies. Innovar, 24(51), 5-18. Retrieved from https://doi.org/10.15446/innovar.v24n51.41235
Myers, S., & Majluf, N. (1984). Corporate Financing and Investment Decisions when Firms have Information that Investors do not have. Journal of Financial Economics, 13, 187 -221. Retrieved from https://doi.org/10.1016/0304-405X(84)90023-0
Moss, JD. & Stein, B (1993), 'Cash Conversion Cycle and Firm Size', Managerial Finance, vol.19, no.8, pp25-34. Retrieved from https://doi.org/10.1108/eb013739
Nakamura, W. & Palombini, N., (2009). The Determinant Factors of Working Capital Management in the Brazilian Market, São Paulo, Brazil: Universidade Presbiteriana Mackenzie. Retrieved from http://bibliotecadigital.fgv.br/ocs/index.php/ebf/10EBF/paper/view/1975/
Nazir, M. S., & Afza, T. (2009). Working Capital Requirements and the Determining Factors in Pakistan. IUP Journal of Applied Finance, 15(4), 28-38. Retrieved from https://www.researchgate.net/profile/Talat-Afza-2/publication/228618942_Working_Capital_Requirements_and_the_Determining_Factors_in_Pakistan/links/09e4150c06b3e1db5e000000/Working-Capital-Requirements-and-the-Determining-Factors-in-Pakistan.pdf
Nazir, MS & Afza, T (2009), 'Impact of Aggressive Working Capital Management Policy on Firms' Profitability', The IUP Journal of Applied Finance, vol.15, no.8, pp19-30. Retrieved from https://lahore.comsats.edu.pk/Papers/Abstracts/146-8588087906194227058.pdf
Niskanen, J. & Niskanen, M., (2006). The Determinants of Corporate Trade Credit Polices in a Bank-Dominated Financial Environment: The Case of Finnish Small Firms. European Financial Management, Volume 12; No.1, pp. 81-102. Retrieved from https://doi.org/10.1111/j.1354-7798.2006.00311.x
Oseifuah EK, Gyekye A (2016) Cash Conversion Cycle Theory and Corporate Profitability: Evidence from Non-Financial Firms Listed on the Johannesburg Stock Exchange. Journal of Accounting and Management 6 (9): 37-51. Retrieved from http://www.zbw.eu/econis-archiv/bitstream/11159/1419/1/1007291532.pdf
Oseifuah, E. (2016). Determinants of Working Capital Requirements: Evidence from Selected Non-financial Firms Listed on the Johannesburg Securities Exchange. Journal of Accounting and Management, 6(1), 1-12. Retrieved from http://www.journals.univ-danubius.ro/index.php/jam/article/view/3200
Raheman, A & Nasr, M (2007), 'Working Capital Management and Profitability - Case of Pakistani Firms', International Review of Business Research Papers, vol.3, no.1, pp279-300. Retrieved from https://www.researchgate.net/profile/Mohamed-Nasr-22/publication/228727444_Working_capital_management_and_profitability-case_of_Pakistani_Firms/links/0c960523758d23d0e1000000/Working-capital-management-and-profitability-case-of-Pakistani-Firms.pdf
Salawu, R.O &. Alao, J. A (2014). Working Capital Management and the Performance of Selected Quoted Manufacturing Companies in Nigeria (2000-2009). Research Journal of Finance and Accounting. 5 (14), 80-93
 This work is licensed under a: Creative Commons Attribution 4.0 International License
© Granthaalayah 2014-2021. All Rights Reserved.