INVESTIGATION OF THE EFFECT OF DEMOGRAPHIC CHARACTERISTICS OF DECOMPOSİTİON, DİSPATCH AND DISTRIBUTION EMPLOYEES IN POSTAGE WORKS ON LEVELS OF ORGANIZATIONAL COMMITMENTDr. Ali Topal 1 1 Researcher, Ankara, Turkey. |
|
||
|
|
|||
|
Received 2 September 2021 Accepted 14 September2021 Published 30 September2021 Corresponding Author Dr.
Ali Topal, yamtar00@hotmail.com DOI 10.29121/granthaalayah.v9.i9.2021.4253 Funding:
This
research received no specific grant from any funding agency in the public,
commercial, or not-for-profit sectors. Copyright:
© 2021
The Author(s). This is an open access article distributed under the terms of
the Creative Commons Attribution License, which permits unrestricted use, distribution,
and reproduction in any medium, provided the original author and source are
credited.
|
ABSTRACT |
|
|
|
The aim
of the research is to determine the demographic characteristics of the
employees who make decomposition, dispatch and distribution in the postal
works; is to determine at what level it affects organizational commitment
levels. The population of the research consists of 2703 people who make
decomposition, dispatch and distribution in postal works in Ankara province.
The sample consists of 238 volunteers, 122 of whom are male and 116 are
females. Data and information were collected by applying the organizational
commitment scale developed by Meyer, Allen, and Smith and the questionnaire
with 7 demographic questions in October, November and December 2018, and in
January, February and March 2019. There is one main hypothesis and seven
sub-hypotheses in the research. Normality,
skewness and kurtosis test, t test from hypothesis tests and ANOVA test from
variance analysis techniques were used in the research. As a result of the
analyzes applied, it has been seen that the demographic characteristics of
the employees who make decomposition, dispatch and distribution in the postal
works play an effective role on organizational commitment. |
|
||
|
Keywords: Post,
Organization, Demographic Characteristics, Organizational Commitment 1. INTRODUCTION The foundation of the
first official postal organization in Turkey was laid on October 23, 1840 as
a supervision as a result of the announcement of the Tanzimat Edict of the
Ottoman state, and in the first years of the Republic, the Ministry of
Internal Affairs in 1933, the Ministry of Public Works in 1939, the Ministry
of transport, depending on the name of the General Directorate of Mail,
Telegraph and telephone PTT (2018). Postal processing
centers (PIMs), which occupy an important place in postal services since
1840, play an important role in collecting, sorting, sending and directing
mail to distribution. Ankara Postal Processing Center (APİM) is one of
the largest postal processing centers in our country Atamer et al. (2008). Incoming mails to PIMs are classified according to where they will be
sent by discriminating employees. The personnel who carry out the dispatch
process, on the other hand, deliver the mail to the relevant PIM. Those
working in the field of distribution are responsible for delivering the mail
they receive from PIMs to the recipients. Registered mail or unregistered
mail are the areas where postal workers create the most workload. Registered
mails are delivered to the |
|
||
recipient by following the entire process through the system. Unregistered mail operations It is understood that this is the area where postal workers work intensively. This situation increases the importance of decomposition, dispatch and distribution, including other postal processes. For this reason, the level of commitment to the organization of those who do the decomposition, referral and distribution works; plays an important role in the performance of its duties. The main purpose of this research is how much the demographic characteristics of the employees affect their organizational commitment levels.
Demographic features included in the study:
1) Gender
2) Slope Status
3) Marital status
4) Age
5) Household Average Monthly Income
6) Total Service in the Occupation
7) Working Time in the Institution
Organizational commitment: “It is the individual's continuing to work for the organization he is in, by adopting the goals and values of the organization and by making efforts on these issues and at the same time having a desire to stay in the organization.” From this point of view, organizational commitment is a sense of belonging to the organization Porter et al. (1974).
Another understanding is that the employee works willingly Boezeman and Ellemers (2007). Kanter, on the other hand, considers it as the process of activating the individual's situation for the organization (Kanter, 1968). Cook, on the other hand, defines it as follows: “It is the will and will of people to stay in an organization they are a member of, as well as their efforts in this direction Cook (2008).
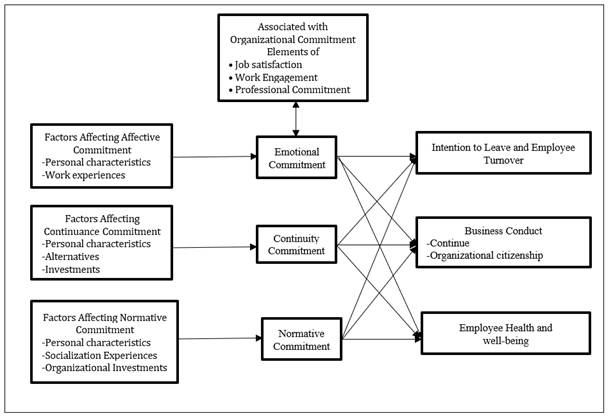
People may feel committed to their organizations for different reasons. Commitment in general; It occurs due to emotional reasons (emotional commitment), feeling obliged (normative commitment) and not being able to leave the job (continuance commitment) Meyer and Allen (1991). However; each employee is connected to the organization at different levels and dimensions (Güçlü, 2006). In this study, the following sub-dimensions were discussed in terms of organizational commitment:
1) Emotional Commitment
2) Normative Commitment
3) Commitment To Continuation
Affective commitment includes self-sacrifice for the organization by adopting the goals, beliefs, rules and elements of the organization McGee and Ford (1987). In emotional commitment, there is a strong connection with the work life of a stable and strong relationship Meyer and Allen (1991). Keeping the interests of the organization ahead of everything is the personal perception and acceptance of successes and failures Baysal and Paksoy (1999). Emotional commitment is the employee's desire and desire to stay connected to the organization with their feelings Meyer et al. (1993). Employees who are emotionally attached are capable of seeing the benefit of the organization before their own interests, devoting themselves to the organization and making sacrifices from their private lives Öztürk (2009).
It can be characterized as the fact that social pressures are effective in the development of normative commitment, as well as being loyal to the organization and making sacrifices, and a moral belief and sense of responsibility Allen and Meyer (1990), (Powell & Meyer, 2003). While continuance commitment and emotional commitment develop more within the organization, normative commitment is mostly affected by the values acquired without being involved in the organization Ince and Gul (2005). Normative commitment, on the other hand, can be explained by the fact that the feeling of loyalty and loyalty, which has turned into a form of belief, makes it necessary to stay in the organization. The employee sincerely believed that it was right to stay in the organization Turkmen (2016).
Continuity commitment is the continuation of the employee to stay in the organization, considering the financial or moral problems he’ll experience after leaving the job. This shows that the longer he stays in the organization, the harder it is to leave. Because he can lose incentive rewards, seniority benefits, retirement and post-retirement plans, etc. However, there are situations where job opportunities are limited in the surrounding area. Due to these and similar reasons, the employee will have to continue to maintain their current status Allen and Meyer (1990). Continuance commitment, on the other hand, is the status of staying in the organization with the thought that the gains (material gain, social status, seniority, promotion, length of time spent, labor given, etc.) that the employee has achieved during the time spent in the organization cannot be achieved elsewhere Boylu et al. (2007). From another point of view, it is seen that not only due to the fear of financial loss, but also intangible effects such as the change of the organizational location, the change of living standards, the change of the city, the change of the environment are effective in ensuring continuance commitment Öztürk (2009).
|
|
|
Figure 1 Three-Dimensional Organizational Commitment
Model Source: (Meyer, et al, 2002: 22) |
2. METHOD
Aim
The aim of the study is to determine whether there is a significant difference between the demographic characteristics of postal workers and organizational commitment in Ankara.
Hypothesis
The hypotheses of the research can be listed as follows:
H: Demographic characteristics make a significant difference in the level of organizational commitment.
H1a: Gender creates a significant difference in the level of organizational commitment.
H1b: Educational status creates a significant difference in the level of organizational commitment.
H1c: Marital status creates a significant difference in the level of organizational commitment.
H1c: Age creates a significant difference in the level of organizational commitment.
H1d: Household monthly average income creates a significant difference in organizational commitment
level.
H1e: Significant difference in the level of organizational commitment from the total service spent in the
profession creates.
H1f: Working time in the institution creates a significant difference in the level of organizational
commitment.
Model
The study was conducted with the descriptive research model. It is aimed to determine the direction and level of the correlation between the dependent variable demographic characteristics and the independent variable organizational commitment.
Universe and Sample
The universe of the study consists of 703 people who make separation, dispatch and distribution in the postal works of Ankara, and the sample consists of 238 employees, 122 men and 116 women, who are volunteers. The survey method, which is a simple random sampling method, was used in the study; It was held in October, November and December 2018 and January, February and March 2019. The purpose of using this method is that each item has an equal chance of entering the determined universe. That's why; the value given to each item is the same.
Data Collection Tools
As the technique used in data collection, the "survey" method was applied. The questionnaire, consisting of 7 questions about the demographic characteristics of the employees and 18 questions about the level of organizational commitment, was used.
Limitations
The reason for this is that there are employees who do not want to fill out surveys and they give a negative answer when asked. The reasons for giving negative answers were that they stated that they would have problems with the workplace. This reason constitutes the main frame of our limitations. The inadequacy of persuasion efforts that this situation will not cause a problem in the workplace has also created a limitation.
Personal Information Form
The Personal Information Form consists of seven items: “Gender, Educational Status, Marital Status, Age, Average Monthly Income of the Household, Total Service Spent in the Occupation, Working Time in the Institution”.
Organizational Commitment Scale
The organizational commitment scale, which includes 18 questions, developed by Meyer et al. is a 5-point Likert type scale Meyer et al. (1993). The statements were classified as “1. strongly disagree”, “2. disagree”, “3. undecided”, “4. agree”, “5. strongly agree”. The first six questions measuring the emotional dimension, the second six questions measuring the continuation dimension, and the last six questions measuring the normative dimension. Meyer et al. (1993) determined the alpha value of the affective dimension of organizational commitment to be 0.82, the alpha value of the continuation dimension to 0.74, and the alpha value of the normative commitment dimension to 0.83.
3. RESULTS
The findings and analysis of the findings are included in this section.
Analyzes
The findings are explained in tables.
|
Table 1 Descriptive Statistics of Organizational Commitment |
|||||
|
n=238 |
Minimum |
Maximum |
Average |
Standard
Deviation |
% |
|
Emotional
Commitment |
6 |
30 |
20,19 |
4,20 |
66,9 |
|
Continuing Commitment |
6 |
30 |
21,71 |
4,70 |
72,1 |
|
Normative
Commitment |
6 |
30 |
20,10 |
4,89 |
67,0 |
|
Organizational
Commitment |
30 |
87 |
61,79 |
10,09 |
71,7 |
Table 1 shows descriptive statistics and mean scores. The mean of affective commitment is 20.19, the mean of continuance commitment is 21.71, the mean of normative commitment is 20.10, and the mean of organizational commitment is 61.79.
|
Table 2 Normality Tests of Organizational Commitment |
||
|
Statistics |
p |
|
|
Emotional
Commitment |
0,960 |
0,000 |
|
Continuing
Commitment |
0,959 |
0,000 |
|
Normative
Commitment |
0,988 |
0,000 |
|
Organizational
Commitment |
0,978 |
0,000 |
In Table 2. The normality test results of organizational commitment are given in
|
Table 3 Skewness and Kurtosis Tests of Organizational Commitment |
||
|
Skewness |
Kurtosis |
|
|
Emotional
Commitment |
0,440 |
0,173 |
|
Continuing
Commitment |
-0,685 |
0,349 |
|
Normative
Commitment |
-0,362 |
0,078 |
|
Organizational
Commitment |
-0,480 |
0,525 |
Table 3 shows the results of skewness and kurtosis. Skewness and kurtosis values were calculated to determine the normal distribution; Values between +3 and -3 are considered to be suitable for normal distribution. As a result, it was accepted that the scales used were within the framework of normal distribution.
|
Table 4 Comparison of Employees with Organizational Commitment Scores in Terms of Gender |
|
||||||
|
Gender |
n |
Average |
Standard
Deviation |
t |
p |
||
|
Emotional
Commitment |
Male |
122 |
20,29 |
4,34 |
0,977 |
0,328 |
|
|
|
Female |
116 |
20,01 |
4,00 |
|
|
|
|
Continuing
Commitment |
Male |
122 |
21,90 |
4,70 |
0,984 |
0,325 |
|
|
|
Female |
116 |
21,49 |
4,68 |
|
|
|
|
Normative
Commitment |
Male |
122 |
20,70 |
4,89 |
2,991 |
0,003* |
|
|
|
Female |
116 |
19,40 |
4,88 |
|
|
|
|
Organizational
Commitment |
Male |
122 |
62,93 |
10,11 |
2,315 |
0,020* |
|
|
|
Female |
116 |
60,65 |
10,08 |
|
|
|
|
*p<0.05 significant difference, p>0.05 no significant
difference. |
|||||||
Table 4 shows the comparison of organizational commitment in terms of gender.
According to the t-test results in terms of gender;
It was found that there was a significant difference in terms of gender in normative commitment rates. It was observed that the normative commitment levels of men were higher than women. (20.70).
It has been revealed that there is a difference in terms of gender as the rate of organizational commitment. It has been observed that the organizational commitment levels of men are higher than women (62,93).
|
Table 5 Comparison of Employees with Organizational Commitment Scores in terms of Educational Status |
||||||
|
Education Status |
n |
Average |
Standard Deviation |
F |
p |
|
|
Emotional Commitment |
Primary Education |
56 |
20,42 |
3,51 |
1,269 |
0,275 |
|
High School |
112 |
20,41 |
3,59 |
|||
|
Associate Degree |
48 |
20,21 |
4,63 |
|||
|
Licence |
14 |
20,50 |
4,81 |
|||
|
Degree |
8 |
19,09 |
4,99 |
|||
|
Doctorate |
- |
- |
- |
|||
|
Continuing Commitment |
Primary Education |
56 |
22,88 |
4,88 |
7,418 |
0,000* |
|
High School |
112 |
22,50 |
4,14 |
|||
|
Associate Degree |
48 |
22,18 |
4,44 |
|||
|
Licence |
14 |
20,47 |
4,39 |
|||
|
Degree |
8 |
18,99 |
4,99 |
|||
|
Doctorate |
- |
- |
- |
|||
|
Normative Commitment |
Primary Education |
56 |
21,42 |
4,69 |
6,375 |
0,000* |
|
High School |
112 |
20,78 |
4,18 |
|||
|
Associate Degree |
48 |
20,58 |
4,93 |
|||
|
Licence |
14 |
18,73 |
4,99 |
|||
|
Degree |
8 |
17,48 |
5,48 |
|||
|
Doctorate |
- |
- |
- |
|||
|
Organizational
Commitment |
Primary Education |
56 |
64,31 |
9,81 |
7,159 |
0,000* |
|
High School |
112 |
63,80 |
7,87 |
|||
|
Associate Degree |
48 |
62,85 |
10,85 |
|||
|
Licence |
14 |
59,59 |
10,54 |
|||
|
Degree |
8 |
55,71 |
11,60 |
|||
|
Doctorate |
- |
- |
- |
|||
|
*p<0.05 significant difference, p>0.05 no
significant difference. |
||||||
Table 5 shows the comparison of the education levels of the employees and their organizational commitment scores.
According to the ANOVA test;
It is seen that there is a statistical difference between education levels and continuance commitment. While the master's level score is the lowest (18.99), the score of primary school graduates is the highest (22.88).
It is seen that there is a statistical difference between education levels and normative commitment. While the master's level score is the lowest (17.48), the score of primary school graduates is the highest (21.42).
It is seen that there is a statistical difference between education levels and organizational commitment. While the master's level score is the lowest (55.71), the score of primary school graduates is the highest (64.31).
|
Table 6 Comparison of Employees with Organizational Commitment Scores in terms of Marital Status |
|
|
||||
|
Marital Status |
n |
Average |
Standard Deviation |
F |
p |
|
|
Emotional Commitment |
Married |
151 |
20,51 |
4,28 |
3,361 |
0,041* |
|
Single |
78 |
19,33 |
4,11 |
|||
|
Divorced/Spousal Death |
9 |
20,19 |
3,33 |
|||
|
Continuing Commitment |
Married |
151 |
21,70 |
4,77 |
0,388 |
0,681 |
|
Single |
78 |
21,78 |
4,21 |
|||
|
Divorced/Spousal Death |
9 |
21,12 |
6,37 |
|||
|
Normative Commitment |
Married |
151 |
19,99 |
4,91 |
0,411 |
0,672 |
|
Single |
78 |
20,36 |
4,95 |
|||
|
Divorced/Spousal Death |
9 |
20,22 |
5,88 |
|||
|
Organizational
Commitment |
Married |
151 |
62,12 |
10,14 |
0,157 |
0,861 |
|
Single |
78 |
61,48 |
9,76 |
|||
|
Divorced/Spousal Death |
9 |
61,32 |
12,70 |
|||
|
*p<0.05
significant difference, p>0.05 no significant difference. |
||||||
Table 6 shows the comparison of the marital status of the employees and their organizational commitment scores.
According to the ANOVA test;
It is seen that there is a statistical difference between marital status and emotional commitment. While single workers have the lowest score (19.33), married workers have the highest scores (20.51).
|
Table 7 Comparison of Employees with Organizational Commitment Scores in terms of Age |
|||||||
|
Age |
n |
Average |
Standard Deviation |
F |
p |
||
|
Emotional Commitment |
29 years and under |
49 |
20,09 |
4,10 |
2,754 |
0,041* |
|
|
30-39 years |
84 |
19,98 |
4,02 |
||||
|
40-49 years |
68 |
20,65 |
4,49 |
||||
|
50 years and older |
37 |
20,86 |
3,28 |
||||
|
Continuing Commitment |
29 years and under |
49 |
21,77 |
4,19 |
0,565 |
0,653 |
|
|
30-39 years |
84 |
21,33 |
4,59 |
||||
|
40-49 years |
68 |
21,92 |
5,04 |
||||
|
50 years and older |
37 |
21,94 |
4,46 |
||||
|
Normative Commitment |
29 years and under |
49 |
20,73 |
4,34 |
0,523 |
0,658 |
|
|
30-39 years |
84 |
19,67 |
5,08 |
||||
|
40-49 years |
68 |
19,88 |
5,12 |
||||
|
50 years and older |
37 |
20,64 |
4,82 |
||||
|
Organizational
Commitment |
29 years and under |
49 |
61,03 |
9,63 |
0,911 |
0,428 |
|
|
30-39 years |
84 |
61,13 |
9,78 |
||||
|
40-49 years |
68 |
62,73 |
11,24 |
||||
|
50 years and older |
37 |
63,02 |
9,56 |
||||
|
*p<0.05
significant difference, p>0.05 no significant difference. |
|||||||
Table 7 shows the comparison in terms of organizational commitment scores for employees of different ages.
According to the ANOVA test;
There is a statistical difference between age levels in terms of emotional commitment. Those aged 30-39 have the lowest level of emotional commitment (19.98), while those aged 50 and over have the highest (20.86).
|
Table 8 Comparison of Employees' Organizational Commitment Scores in Terms of Household Average Monthly Income |
||||||
|
Household Average Monthly Income |
n. |
Average |
Standard Deviation |
F. |
p. |
|
|
Emotional Commitment |
Below 2.000 TL |
34 |
20,08 |
3,46 |
0,827 |
0,531 |
|
2.000-2.499 TL |
63 |
19,84 |
3,86 |
|||
|
2.500-3.499 TL |
85 |
20,68 |
4,10 |
|||
|
3.500-4.499 TL |
28 |
19,70 |
4,92 |
|||
|
4.500-5.499 TL |
18 |
19,60 |
4,13 |
|||
|
More than 5,500 TL |
10 |
20,24 |
5,20 |
|||
|
Continuing Commitment |
Below 2.000 TL |
34 |
23,30 |
4,35 |
7,752 |
0,000* |
|
2.000-2.499 TL |
63 |
22,29 |
4,61 |
|||
|
2.500-3.499 TL |
85 |
22,14 |
3,84 |
|||
|
3.500-4.499 TL |
28 |
20,51 |
5,11 |
|||
|
4.500-5.499 TL |
18 |
20,33 |
5,33 |
|||
|
More than 5,500 TL |
10 |
18,92 |
4,81 |
|||
|
Normative Commitment |
Below 2.000 TL |
34 |
21,79 |
4,50 |
5,328 |
0,000* |
|
2.000-2.499 TL |
63 |
20,41 |
4,59 |
|||
|
2.500-3.499 TL |
85 |
20,26 |
4,35 |
|||
|
3.500-4.499 TL |
28 |
19,54 |
5,49 |
|||
|
4.500-5.499 TL |
18 |
18,98 |
6,20 |
|||
|
More than 5,500 TL |
10 |
17,48 |
5,25 |
|||
|
Organizational Commitment |
Below 2.000 TL |
34 |
65,17 |
8,54 |
6,133 |
0,000* |
|
2.000-2.499 TL |
63 |
62,54 |
9,31 |
|||
|
2.500-3.499 TL |
85 |
63,08 |
9,02 |
|||
|
3.500-4.499 TL |
28 |
59,75 |
11,48 |
|||
|
4.500-5.499 TL |
18 |
58,90 |
11,73 |
|||
|
More than 5,500 TL |
10 |
56,64 |
11,57 |
|||
|
*p<0.05 significant difference, p>0.05 no significant difference. |
||||||
Table 8 shows the comparison of the household average monthly income of the employees and their organizational commitment scores.
According to the ANOVA test;
It is seen that there is a statistical difference between household average monthly income and continuance commitment. Households with an average monthly income of more than 5,500TL have the lowest score (18.92), while those with a monthly average monthly income of households below 2000TL have the highest score (23,30).
It is seen that there is a statistical difference between the household average monthly income and the normative commitment. Households with a monthly average income of more than 5,500TL have the lowest score (17.48), while households with an average monthly income below 2000TL have the highest score (21.79).
It is seen that there is a statistical difference between household average monthly income and organizational commitment. Households with a monthly average income of more than 5,500TL have the lowest score (56,64), while those with a monthly average monthly income of households below 2000TL have the highest score (65,17).
|
Table 9 Comparison of Employees with Organizational Commitment Scores in terms of Total Service in the Occupation |
||||||
|
Total
Service in the Occupation |
n |
Average |
Standard Deviation |
F |
p |
|
|
Emotional Commitment |
1/5 years |
50 |
20,11 |
4,22 |
6,311 |
0,000* |
|
6/10 years |
88 |
19,21 |
3,67 |
|||
|
11/15 years |
37 |
19,78 |
3,78 |
|||
|
16/20 years |
34 |
19,89 |
4,23 |
|||
|
More than 20/- years |
29 |
21,82 |
4,60 |
|||
|
Continuing Commitment |
1/5 years |
50 |
22,09 |
3,78 |
2,532 |
0,040* |
|
6/10 years |
88 |
22,33 |
4,10 |
|||
|
11/15 years |
37 |
20,75 |
6,20 |
|||
|
16/20 years |
34 |
22,12 |
5,52 |
|||
|
More than 20/- years |
29 |
21,14 |
4,85 |
|||
|
Normative Commitment |
1/5 years |
50 |
19,48 |
4,35 |
2,339 |
0,055 |
|
6/10 years |
88 |
21,03 |
4,69 |
|||
|
11/15 years |
37 |
18,78 |
5,55 |
|||
|
16/20 years |
34 |
19,89 |
5,41 |
|||
|
More than 20/- years |
29 |
19,86 |
5,16 |
|||
|
Organizational
Commitment |
1/5 years |
50 |
61,99 |
8,74 |
1,589 |
0,181 |
|
6/10 years |
88 |
62,83 |
8,87 |
|||
|
11/15 years |
37 |
59,81 |
11,71 |
|||
|
16/20 years |
34 |
62,01 |
11,79 |
|||
|
More than 20/- years |
29 |
62,82 |
10,69 |
|||
|
*p<0.05
significant difference, p>0.05 no significant difference. |
||||||
Table 9 shows the comparison of the household average monthly income of the employees and their organizational commitment scores.
According to the ANOVA test;
It is seen that there is a statistical difference between the total service spent in the profession and emotional commitment. While the score of those with a total of 6/10 years of service in the profession is the lowest (19.21), the score of those with a total of more than 20/- years of service in the profession is the highest (21,82).
It is seen that there is a statistical difference between the total service spent in the profession and the continuation commitment. Those with a total of 11/15 years of service in the profession have the lowest score (20.75), while those with a total of 6/10 years of service in the profession have the highest score (22,33).
|
Table 10 İş Görenlerin Kurumdaki Çalışma Süresi Açısından Örgütsel Bağlılık Puanları ile Kıyaslanması |
||||||
|
Working Time in the
Institution |
n |
Average |
Standard Deviation |
F |
p |
|
|
Emotional Commitment |
1/3 years |
58 |
21,01 |
4,66 |
3,492 |
0,008* |
|
4/6 years |
70 |
19,64 |
3,77 |
|||
|
7/9 years |
33 |
19,44 |
3,88 |
|||
|
10/12 years |
25 |
20,42 |
4,21 |
|||
|
More than 12/- years |
52 |
20,79 |
4,32 |
|||
|
Continuing Commitment |
1/3 years |
58 |
21,61 |
4,21 |
0,543 |
0,721 |
|
4/6 years |
70 |
22,01 |
4,30 |
|||
|
7/9 years |
33 |
21,47 |
5,23 |
|||
|
10/12 years |
25 |
22,33 |
4,49 |
|||
|
More than 12/- years |
52 |
21,42 |
5,55 |
|||
|
Normative Commitment |
1/3 years |
58 |
19,33 |
5,01 |
1,648 |
0,170 |
|
4/6 years |
70 |
20,49 |
4,60 |
|||
|
7/9 years |
33 |
20,87 |
5,55 |
|||
|
10/12 years |
25 |
20,77 |
4,21 |
|||
|
More than 12/- years |
52 |
19,59 |
5,38 |
|||
|
Organizational
Commitment |
1/3 years |
58 |
61,58 |
10,24 |
0,336 |
0,885 |
|
4/6 years |
70 |
61,92 |
8,88 |
|||
|
7/9 years |
33 |
61,25 |
11,09 |
|||
|
10/12 years |
25 |
63,43 |
8,78 |
|||
|
More than 12/- years |
52 |
61,80 |
11,63 |
|||
Table 10 shows the comparison of the service time in the institution of the employees and the organizational commitment scores.
According to the ANOVA test;
It is seen that there is a statistical difference between the length of service in the institution and emotional commitment. Those with 7/9 years of service in their institution have the lowest score (19.44), while those with 1/3 years have the highest score (21.01).
4. CONCLUSION AND RECOMMENDATIONS
According to this study, it has been revealed that men have higher levels of commitment than women in normative commitment rates, which is one of the sub-dimensions of organizational commitment in terms of gender. However, in general, it is seen that the organizational commitment levels of men are higher than women. Ayça (2016), who achieved results in line with this study, stated in her study that men have higher levels of organizational commitment than women. Although some researchers could not detect a difference in continuance commitment related to age, they stated that older employees had more continuance commitment, normative commitment, and therefore organizational commitment Demircioglu (2017), Zeynel (2014), Yasbay (2011). Two researchers have revealed through their research that women are more committed to the organization than men Altay (2018), (Meydan, 2010).
A statistically significant difference was found between the level of education and the sub-dimensions of organizational commitment, continuance commitment and normative commitment. While the level of continuance commitment, normative commitment and organizational commitment of graduate graduates is the lowest, primary school graduates have the highest. Chughtai and Zafar (2006) stated that as the level of education increases, the level of organizational commitment decreases. In his study, Özevin (2016) stated that the high expectations of the employees with a high level of education from the organization and the fact that the organization cannot fulfill these expectations, as well as the high job opportunities of the educated employees are among the reasons for the decrease in organizational commitment. In a study on the accommodation sector, it was determined that the organizational commitment of primary school graduates is higher than undergraduate graduates Yazıcıoğlu and Topaloğlu (2009).
It has been determined that there is a statistical difference between marital status and emotional commitment, which is one of the sub-dimensions of organizational commitment, while the commitment level of single employees is the lowest, while the commitment level of married employees is high. The fact that single people quit their job higher than others and that married people have higher family responsibilities and economic responsibilities were interpreted as higher organizational commitment levels Hoş and Oksay (2015).
In the study, a statistical difference was found in the emotional commitment dimension, which is one of the sub-dimensions of organizational commitment, between age levels. It has been determined that the emotional commitment level of those aged 30-39 is the lowest, while the age of 50 and over is the highest. When the literature is examined, it is seen that the direct relationship between age and organizational commitment is tried to be defined, and a positive relationship has been determined Steers (1977), Demircan and Ceylan (2002), Stevens et al. (1978). It is understood that the older employees, who spend more time in the organization than younger employees, have a higher level of organizational commitment Özevin (2016).
It has been determined that while the average monthly income of households and organizational commitment and its sub-dimensions of continuance commitment, normative commitment are more than 5500TL, the commitment levels are the lowest, while those below 2000TL are at the highest level.
Statistical significance was determined in terms of total service time spent in the profession, organizational commitment and its sub-dimensions, continuance commitment and emotional commitment. While there is a high level of commitment to work for 20 years or more, it has been determined that 6/10 years of work are at the lowest level. It has been determined that the rate of emotional commitment is high in those who work 6/10 years and at the lowest level in those who work 11/15 years.
A statistical difference was found between the duration of service in their institution and emotional commitment, which is a sub-dimension of organizational commitment, while those with 7/9 years of service in their institution had the lowest level of commitment, while those with 1/3 years of service had the highest level of commitment.
As a result of the research, it has been determined that men have more organizational commitment than women in terms of gender. It is recommended to investigate the reason for this and to take the necessary measures to remove the differences in terms of gender. It is thought that a study in this direction may be useful for future research.
It is seen that the high level of education has a direct relationship with the level of commitment to the organization, and the level of organizational commitment weakens as the level of education increases. The relationship between low level of education and high level of organizational commitment is shown in this study. It is recommended that necessary research be carried out to increase the level of commitment of educated employees to the organization, taking measures and providing incentives to increase the education level of existing employees. It is known that organizations with a qualified and educated workforce are always in a more advantageous position than other organizations.
It has been determined that while the organizational commitment of the employees with single marital status is low, the organizational commitment levels of the married employees are higher. Taking measures to increase the organizational commitment levels of single employees will be beneficial for the organization.
It is seen in the research that the organizational commitment levels of older employees are higher than those of younger employees. It is seen that this situation is related to the time spent in the organization. It is recommended to organizations to provide the necessary procedures and incentives to increase the level of commitment of young employees to the organization. It would be beneficial to provide various incentives and supports, taking into account the older employees. It is thought that this support and incentives will positively affect the level of commitment to the older personnel by the organization. However, it can be considered to develop appropriate reward systems for the organization in order to encourage younger employees to older ones.
It is seen in this research that there is a significant difference between the household average monthly income of the employees and their organizational commitment. It has been determined that while the group with high income level has low level of commitment to the organization, the group with low-income level has a high level of commitment to the organization. It is explained in the literature that there are many reasons for the low level of commitment to the organization of the high-income group. It is recommended to investigate the features that differ in each organization in accordance with the structure of the organization, to find the reasons for the falling level of commitment and to take precautions.
It has been shown by this research that the total service spent in the profession is effective on the organizational commitment levels of the employees. It has been observed that the organizational commitment levels of those who have a service period of 20 years or more are high. Organizational commitment levels of those who have a service period of 6/10 years have been determined to be lower. It can be suggested that organizations provide various opportunities and incentives by taking into account the length of service of their employees.
As a result of the research, it has been revealed that the working time of the employees in the institution is effective on the level of commitment to the organization. It can be recommended to organizations to carry out activities to increase the level of organizational commitment among employees who differ in terms of working hours.
It is understood that each of the demographic characteristics and each dimension of organizational commitment show commitment at different levels. For each element showing a low level of commitment, detailed examination should be made and the level of commitment should be increased.
For researchers who will conduct similar studies, it is recommended to examine the organizational commitment differences arising from the relationship of demographic characteristics with each other.
REFERENCES
Allen, N.J. and Meyer, J.P., (1990). Organizational Commitment: Evidence of Career Stage Effects.Journal of Business Research, 26, 1, pp.1-18. Retrieved from https://doi.org/10.1016/0148-2963(93)90042-N
Altay, M. (2018). "The Role of Workload and Leader-Member Interaction in the Relationship of Work Life Quality with Job Satisfaction, Organizational Commitment and Intention to Leave", Published PhD Thesis, T.C. Süleyman Demirel University Institute of Social Sciences, Isparta.
Atamer, B.; Cetin, A.S.; Eke, D.; Oruc, S.; Sen, F.; Çilingir, C. & Kayalıgil, S. (2008). "Integrative Organization Improvement in Ptt Ankara Mail Processing Center" Chamber of Mechanical Engineers, Journal of Industrial Engineering, 19(3), p.2.
Ayça, B. (2016). "Investigation of the Effects of Demographic Characteristics on Job Satisfaction and Organizational Commitment and a Study in Hotel Businesses", Published Doctoral Thesis, T.C. Halic University Institute of Social Sciences, Istanbul.
Baysal, A. C. and Paksoy, M. (1999). Meyer Allen Model in the Multidimensional Analysis of Professional and Organizational Commitment. Journal of IU. Faculty of Business Administration, 28, 1, p.7-15.
Boezeman, J. E. & Ellemers, N. (2007). "Volunteering for Charity: Pride, Respect, and the Commitment of Volunteers", Journal of Applied Psychology, 92(3), p.774. Retrieved from https://doi.org/10.1037/0021-9010.92.3.771
Boylu, Y., Elbeyi, P. & Gucer, E. (2007). "A Study on the Organizational Commitment Levels of Academicians"Research", Journal of Finance Politics & Comments, 44(5), p.8.
Chughtai, A. A. & Zafar, S. (2006). "Antecedents and Consequences of Organizational Commitment Among Pakistani University Teachers", Applied HRM Research, 11, 1, pp.39-64. Retrieved from https://www.researchgate.net/profile/Sohail-Zafar-2/publication/237235826_Antecedents_and_Consequences_of_Organizational_Commitment_Among_Pakistani_University_Teachers/links/56d6cacb08aee73df6c2e48b/Antecedents-and-Consequences-of-Organizational-Commitment-Among-Pakistani-University-Teachers.pdf
Cook, S. (2008). "The Essential Guide to Employee Engagement: Better Business Performance Through Staff Satisfaction", Kogan Page Limited, London.
Demircan, N. & Ceylan, A. (2002). "The Causes and Consequences of the Concept of Organizational Trust", Journal of Celal Bayer University, 10(2), p.3.
Demircioglu, M. A. (2017). "A Study on the Relationship of Employees' Perception of Demographic Characteristics with Organizational Citizenship Behavior and Organizational Commitment; Participation Bank Example", Published Master Thesis, Turkish Aeronautical Association University Social Sciences Institute, Ankara.
Strong, H. (2006). "The Effect of Situational Factors on Organizational Commitment in the Tourism Sector", Anadolu University Press, Eskişehir, p.54.
Ince, M. and Gul, H. (2005). A New Paradigm in Management: Organizational Commitment, Forward Offset, Ankara., pp.42-43.
Hoş, C. & Oksay, A. (2015). "The Relationship between Organizational Commitment and Job Satisfaction in Nurses", Süleyman Demirel University Journal of the Faculty of Economics and Administrative Sciences, 20(4), p.6.
McGee, G. W., & Ford, R. C. (1987). Two (or more?) dimensions of organizational commitment: Reexamination of the affective and continuance commitment scales. Journal of Applied Psychology, 72(4), pp.638-641. Retrieved from https://doi.org/10.1037/0021-9010.72.4.638
Meyer, P. J. & Allen, J. N. (1991). "A Three-Component Conceptualization of Organizational Commitment", Human Resource Management Review, p.54. Retrieved from https://doi.org/10.1016/1053-4822(91)90011-Z
Meyer, P. J.; Allen, J.N. & Smith, A.C. (1993). "Commitment to organizations and occupations: Extension and test of a three-component conceptualization", Journal of Applied Psychology, 78, pp.538-551. Retrieved from https://doi.org/10.1037/0021-9010.78.4.538
Özevin, M. U. (2016). "Examination of the Relationship Between Leadership Behaviors and Organizational Commitment, Quantitative Practice in an Airline Enterprise), Published Master's Thesis, T.C. Istanbul Arel University Institute of Social Sciences, Istanbul.
Öztürk, F. H. (2009). "The Relationship between Organizational Moral Climate (Organizational Ethics), Organizational Citizenship and Organizational Commitment in School Administrators (The Case of Şişli District)", Published Master Thesis, Boğaziçi University Institute of Social Sciences, İstanbul.
Powell, D. M. and Meyer, J. P. (August 2004). Side-Bet Theory and the Three Component Model of Organizational Commitment.Journal of Vocational Behavior, 65, (1), p.159. Retrieved from https://doi.org/10.1016/S0001-8791(03)00050-2
Porter, W. L.; Steers, M. R.; Mowday, T. R. & Boulian, V. P. (1974). "Organizational commitment, job satisfaction and turnover among psychiatric technicians", Journal of Applied Psychology, 59, pp.603-609. Retrieved from https://doi.org/10.1037/h0037335
PTT, (2018) Post and Telegraph Organization Joint Stock Company (Access) 12 December, Retrieved from (https://www.ptt.gov.tr/Sayfalar/Kurumsal/Hakkimizda.aspx#ptt_tarihce).
Steers, M. R. (1977). "Antecedents and consequences of organizational commitment", Administratis Science Quarterly, 22, pp.46-56. Retrieved from https://doi.org/10.2307/2391745
Stevens, M. J.; Beyer, J. M. & Trice, H. M. (1978). "Assessing personal. Role, and Organizational Predictors of Managerial Commitment." Academy of Management Journal, 21, pp.380-396. Retrieved from https://doi.org/10.2307/255721
Turkmen, F. (2016). "The Effect of Secondary School Administrators' Servant Leadership Behaviors on Teachers' Organizational Commitment (Sinop Province Example)", Published Master's Thesis, Ondokuz Mayıs University Institute of Educational Sciences, Samsun. Retrieved from https://doi.org/10.11114/jets.v5i12.2713
Yasbay, H. (2011). "The Relationship between Demographic Characteristics and Organizational Commitment", Published Master's Thesis T.C. Dokuz Eylul University Institute of Social Sciences, Izmir.
Yazıcıoğlu, İ., & Topaloğlu, I. G. (2009). "Organizational Justice and Loyalty Relationship: An Application in Hospitality Businesses", Journal of Business Studies, 1(1), p.3-16.
Zeynel, E. (2014). "A Research on the Relationships Between Professional Motivation, Job Satisfaction and Organizational Commitment for Academicians", Published Doctoral Thesis, Süleyman Demirel University, Institute of Social Sciences, Isparta
 This work is licensed under a: Creative Commons Attribution 4.0 International License
© Granthaalayah 2014-2021. All Rights Reserved.