ASSESSING THE IMPACT OF CLIMATE VARIABILITY AND CHANGE ON WATER RESOURCES IN BAMENDA, NORTH WEST REGION OF CAMEROONGordin Bah Ndah Anyang 1 1 Department of Environmental Science, Faculty of Science, University of Buea, Box 63, Buea Cameroon.2 Department of Agricultural and Environmental Engineering, College of Technology, The University of Bamenda, Box 39, Bambili, Cameroon.3 UB Interdisciplinary Climate Change Laboratory, Department of Environmental Science, Faculty of Science, University of Buea, Box 63 Buea Cameroon. |
|
||
|
|
|||
|
Received 15 September 2021 Accepted 15 October 2021 Published 30 October2021 Corresponding Author Gordin
Bah Ndah Anyang, gordinbah@gmail.com DOI 10.29121/granthaalayah.v9.i10.2021.4233 Funding:
This
research received no specific grant from any funding agency in the public, commercial,
or not-for-profit sectors. Copyright:
© 2021
The Author(s). This is an open access article distributed under the terms of
the Creative Commons Attribution License, which permits unrestricted use, distribution,
and reproduction in any medium, provided the original author and source are
credited.
|
ABSTRACT |
|
|
|
Water
resources within Bamenda continue to face climate related stress. This paper
sought to assess the impact of climate variability and change on water
resources in Bamenda metropolis. Questionnaires, field study and historic
climatic data were used to evaluate effects of climatic variability and
changes on water resources. Two Representative Concentration Pathway (RCP 2.6
and RCP 8.5) scenarios were used to project climatic data. Standardised
Precipitation Index (SPI) was used to determine drought. Irregular rainfall
and water shortage were the foremost challenges experienced by the
population. Historic data showed an annual decrease in precipitation and
increase in temperature. Precipitation shifts and a low R-squared values
(0.04 - 0.47) for precipitation indicated climatic variation. Decrease
precipitation (gradient -11.84) coincided with the periods of droughts (1993
- 2019) given by the negative values of SPI (up to -3). The hydrological
changes realised were 23 springs and 13 streams dry off and 27 springs and 16
streams have become seasonal. Projected data showed increase in precipitation
and temperature, leaving Bamenda with the challenge of poor water quality that
negatively affects public health and development. This study highlights the
need to adopt current water and drought management practice in this area. |
|
||
|
Keywords: Climate
Variability and Change, Drought, Standardised Precipitation Index, Impact on
Water Resources, Climate Forecast. 1. INTRODUCTION Water resources are
subjected to hydro-climatic variability and could be a key constraint to
economic development Niang et al. (2014). Climate
variability over space and time can cause water stress IPCC 2014 which can
negatively affect economic development Kirono et al. (2017). Increased
concentration of greenhouse gases could significantly cause climate change
thereby posing risks to freshwater quality and availability Bates et al. (2008), Jiménez et al. (2014). About 7% of the
world’s population is exposed to about 20% decreased renewable water
resources for each decree of global warming Frederick and Major
(2004). It is projected
that, in the tropics, Climate change can significantly reduce renewable
surface water and groundwater resources Fahey et al. (2017), IPCC, (2014). This
can cause increased competition for water thereby affecting regional water,
energy and food security Bertram et al. (2017). Climate variability
refers to the variation in the climate that last longer than |
|
||
individual weather event while climate change refers to those variations that persist for a longer period of time FAO (2018). The IPCC defines climate change as changes in the state of the climate that can be identified by changes in its properties and that persist for an extended period, typically decades or longer, due to natural internal process or external forcing or to persistent anthropogenic changes in the composition of the atmosphere or in land use IPCC (2007). Climate change may be due to natural external forcing, natural processes or anthropogenic forcing Singh et al. (2014).
Changes in the local hydrological cycle are conditioned by an interaction of climatic with non-climatic drivers of change and water management responses Jiménez et al. (2014). Glaring indicators of climate change on water resources include the increasing scarcity of domestic water supplies. More than 22.8 million people in 48 countries, most of them in Sub-Saharan Africa (SSA), will face severe water stress by 2025 Lükenga (2015). Africa is highly vulnerable to environmental changes and climate change, thereby, making water resources inextricably more vulnerable to climate change Arnell (2006). Climate change affects water resources negatively through decreasing precipitation against a backdrop of rising temperatures Chia et al. (2019), Bates et al. (2008). Water supply is a predominant means through which the impacts of climate change are felt Lükenga (2015).
Climate change scenario defines how the future may develop, based on assumptions about driving forces and key relationships with climate Santoso (2008). Scenarios tackle basic difficulties that may influence development of future planning. They enable planners, decision makers and the society to focus on specific number of diverse paths and future states. There are several scenarios that have been developed. Representative Concentration Pathways (RCPs) are radiative forcing scenarios IPCC (2007). The four RCPs are: 2.6, 4.5, 6.0 and 8.5(W/m2), numbered according to the change in radiative forcing released in the atmosphere Global Change (2020). RCP 8.5 is the worst-case scenario, RCP2.6 the least case scenario while stabilizing scenarios are RCP 6.0 and RCP 4.5 IPCC (2007). The worst and least case scenario define the limits indicating the maximum and minimum possible climate changes.
This paper assessed the impact of this global trend of climate variability on water resources in Bamenda metropolis. A previous study carried out by Neba (2009) focused on stakeholders’ participation and the role of Non-Governmental Organisations (NGOs) in water resources management in urban water supply. The researcher affirmed that the predominance of environmental degradation in Africa has generated waves of concern from international and national NGOs Neba (2009). The work, which is a product of field investigations concludes that these NGOs are having a significant impact on the social, political and economic life of the populations. Ndoh et al. (2015) investigates how local people perceive climate change/variability, its impacts and coping mechanisms in the Bamenda highlands of north western Cameroon. The work that involved 4 divisions, concluded on the need for adaptation to current land, forest and water management practices to maintain livelihoods in the face of changes many people are not expecting.
Again, Chiaga et al. (2019) examined catchment management and the sustainability of urban water supply in Bamenda. They revealed that the city of Bamenda is endowed with a litany of catchments and Bamendankwe Highland is the main watershed of Bamenda. These researchers did not take into account the role of climate in water resources dynamics in the city of Bamenda. Mairomi and Tume (2021), researched on the Standardised Precipitation Index Valuation of Seasonal Transitions and Adaptation of Pastoralist to Climate Variability in Rangelands of the Bamenda Highlands of Cameroon. The work focused on the pastoralist and livestock adaptation to climate variability. The study does not consider the impact of climate variability or climate change on water resources in Bamenda metropolis. To fill these methodological lapses, this study will incorporate analysis of climate variability and change alongside water resources dynamics in order to blend the relationship between the two variables.
Hence, this paper has as objective to assess the past and future impact of climate variability and change on water resources in the Bamenda metropolis. This was achieved by:
· Evaluating the impact of climate variability and change as perceived by population
· Assessing the impact of rainfall variability and drought on water resources
· Analysing temperature change and its impact on water resources
· Evaluating the effect of projected climate change scenario on water resources.
2. MATERIAL AND METHOD
2.1. SITE DESCRIPTION
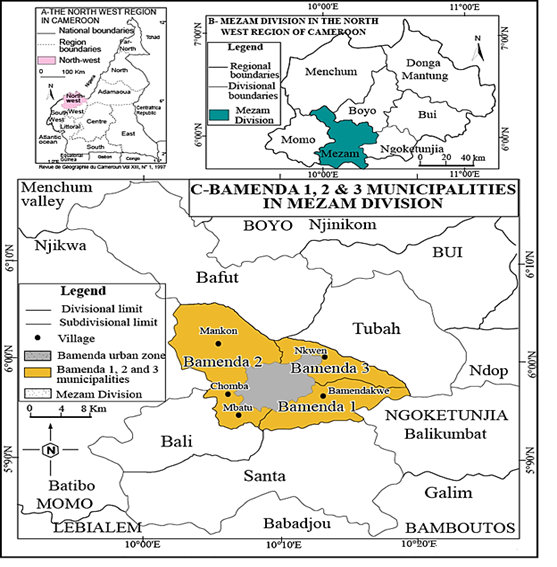
Bamenda is a metropolitan city located southeast of the North West Region of Cameroon and is made up of three council areas which are Bamenda I, Bamenda II and Bamenda III. Bamenda is the capital of the North West Region and doubles as headquarters of Mezam Division Guedjeo et al. (2012). The city is located along the Cameroon Volcanic Line and is made up of two distinct reliefs which are the High Lava Plateau and the Lower Plateau) separated by the Bamenda escarpment Guedjeo et al. (2012). The high lava plateau in which the greater part of Bamenda I Council areas is located has an altitude of about 1,400m above sea level Guedjeo et al. (2012). The area constituting the lower plateau has an average altitude of 1,100m above sea level and is made up of Bamenda II, Part of Bamenda I and Part of Bamenda III Council areas Acho-Chi (1998), Guedjeo et al. (2012). The town is located between latitudes 5°56"N and 5°58"N and longitude 10°09"E and 10°11"E (Figure 1). Bamenda has a surface area of 391 km2 and it is the biggest urban settlement in the North West Region of Cameroon with a population of close to 536,922 World Bank United Nations (2020), Guedjeo et al. (2012). Bamenda has two main seasons the rainy and dry seasons. The rainy season lasting for about seven months (mid-March to mid-October) and an annual average precipitation ranges from 1,700-2,824mm Kometa and Akoh (2012). Bamenda has few rivers and streams; the most prominent is the Mezam River which flows from the Bamenda escarpment through the city centre towards Mankon in Bamenda II Sub-Division Kometa and Akoh (2012).
|
|
|
Figure 1 Location of the study area Source: Geo. database of Cameroon; 2015 NIS Yaoundé |
2.2. DATA COLLECTION
Data for this study include primary and secondary data. Household questionnaire and field visit with local water management actors, constitutes primary data. A random sampling method was used to get the perception of 1000 households in Bamenda. Before carrying out the research, the local administration of the study area granted a verbal consent after looking at the household questionnaire that had to be administered. During the administration of the questionnaire, the consent of the respondent was requested and respondents who accepted did fill the questionnaire. The questionnaire was geared towards accessing the impact of climate variability and change felt by the population and its impact on water resources; this in a bid was necessary to correlate scientific facts with reality. The field visit to the three councils of the metropolitan city of Bamenda was geared towards identifying springs and streams that have either dried up or have become seasonal within the past 35 years. Secondary data included daily rainfall data from 1963 to 2019 and temperature data from 1971 to 2020 collected from the Meteorological Service of the Regional Delegation of Transport for the region. The rainfall data was used to determine drought using the Standardised Precipitation Index (SPI). Temperature data presented changed in water loss through evapotranspiration.
In a bit to estimate the future climatic condition of Bamenda, the Climate change scenarios for Bamenda were predicted based on projected data of maximum and minimum precipitation and temperature from 2021 - 2060. Future data to project precipitation and temperature were acquired from Earth System Grid Federation (ESGF) website. The climatic models used were, Miroc-ESM-CHEM, CSIRO-MK 3.6.0, and Access 1.3 and the IPPC project that was used was Coupled Model Inter-comparison Project phase 5 (CMIP5). Two RCPs (Representative Concentration Pathway scenarios) were chosen: RCP2.6 and RCP8.5 since they defined the minimum and maximum possible scenarios. CMIP5 of the IPCC was preferred due to its ability to present future emission trajectory. The climate model projected data were downloaded as NetCDF files which were converted and treated using the software ArcGIS version10.3 and Microsoft Excel 2016 for graphical presentation and statistical analysis. The projected precipitation data were analysed for water availability using the Standardised Precipitation Index (SPI) to predict future drought intensities.
Standardised Precipitation Index (SPI) as defined by McKee et al. (1993) was used to define drought intensities and the criteria for drought events for different timescales. A drought event occurs any time the SPI is continuously negative and when it reaches an intensity of -1 or less. Each drought event, therefore, has a duration defined by its beginning and end, and an intensity for each month that the event continues. The sum of the SPI for all the months within a drought event can be termed the drought’s magnitude as indicated in (Table 1).
|
Table 1 Drought probability of recurrence |
||||
|
SPI Value |
Category |
Probability (%) |
Freq. in 100 years |
Severity of event |
|
>2.00 |
Extreme wet |
2.3 |
100 |
1 in 1 year |
|
1.5 to 1.99 |
Severely wet |
4.4 |
70 |
1 in 1.1 years |
|
1.00 to 1.49 |
Moderately wet |
9.2 |
50 |
1 in 1.3 years |
|
0 to 0.99 |
Mildly Wet |
34.1 |
45 |
1 in 1.5 years |
|
-0.1 to -0.99 |
Mild dryness |
34.1 |
33 |
1 in 3 years |
|
-1.00 to -1.49 |
Moderate
dryness |
9.2 |
10 |
1 in 10 years |
|
-1.50 to -1.99 |
Severe dryness |
4.4 |
5 |
1 in 20 years |
|
<-2 |
Extreme dryness |
2.3 |
2.5 |
1 in 50 years |
|
Sources: McKee et
al. (1993), World Meteorological Organization (2012). |
||||
SPI value for Bamenda was calculated and the value compared with the values in Table 1 to determine drought occurring.
2.3. Data analysis
The Statistical Package for Social Sciences (SPSS) Version 20 was used to analyse the questionnaires. The independent variable for this study was rainfall, which was treated as the main element affecting water resources in Bamenda. Data of the inter-annual rainfall variations were treated as anomalies that were used to establish trends which were illustrated in graphs (time series), with R-Square or Coefficient of Determination (R2) and linear equations added to the graphs to show the percentage change and variability. Standardised Precipitation Index (SPI) was used in this paper as the main climatic tool to monitor drought in the study region. SPI enable analyst to determine the rarity of drought at a given time scale McKee et al. (1995), Tume (2019) of interest using historic precipitation data. Conceptually, SPI is the number of standard deviations by which the precipitation values recorded for a location would differ from the mean over certain periods Guttman (1999), World Meteorological Organisation, 2012). In statistical terms, the SPI is equivalent to the Z- score McKee (1993), Eq. (1).
Z – score = x – μ/δ (1)
Where Z-score expresses the x score’s distance from the mean (µ) in standard deviation (δ) units.
Statistically, the SPI is based on the cumulative probability of a given rainfall event occurring at a station. SPI was used to assess the occurrence of drought incidents in the Bamenda Municipality. All anomaly graphs generated from the data were fitted with trend lines and linear equations. Climatic graphs for this study are presented as anomalies indicated in Eq. (2).
Anomaly = mean/μ * 100 (2)
3. RESULTS
3.1. Populations’ perception on the Indicators of Climate Variability and change
The frequency distribution of climate variability and climate change indicators as perceived by the population is shown in Table 2. The most outstanding indicators were irregular rainfall (31.9%), water shortages (16.6%), increasing temperatures (14.2%) and prolonged dry seasons (10.6%). Floods and landslides were not popular it was likely due to the hilly topography and soil structure of the city.
|
Table 2 Indicators of climate variability and change as perceived by the population of Bamenda |
||
|
Indicator |
Frequency |
Percent |
|
Irregular rainfall |
319 |
31.9 |
|
Water shortages |
166 |
16.6 |
|
increasing temperatures |
142 |
14.2 |
|
Prolonged dry seasons |
106 |
10.6 |
|
Floods |
57 |
5.7 |
|
Landslides |
34 |
3.4 |
|
All indicators |
176 |
17.6 |
|
Total |
1000 |
100 |
3.2. Springs and Streams that have dried up or become seasonal
During the field visit, the number of springs and streams that have tried up in the past 35 years, as declared by those in charge of water management, are present on Table 3. Results showed that 23 springs and 12streams have dry off while 27 springs and 12 streams have become seasonal. Bamenda I Councils has more springs and streams that have dried up than any other council in Bamenda metropolis (Table 3).
|
Table 3 Springs and Streams that have dried up or become seasonal within the past 35 years per Council area |
|||||
|
SN |
Council Area |
Dried Springs |
Dried Stream |
Seasonal spring |
Seasonal stream |
|
1 |
Bamenda I |
11 |
6 |
13 |
7 |
|
2 |
Bamenda II |
7 |
3 |
8 |
4 |
|
3 |
Bamenda III |
5 |
4 |
6 |
5 |
|
Total |
23 |
13 |
27 |
16 |
|
3.3. Precipitation pattern and drought from 1963 to 2019
3.3.1. Monthly rainfall variation
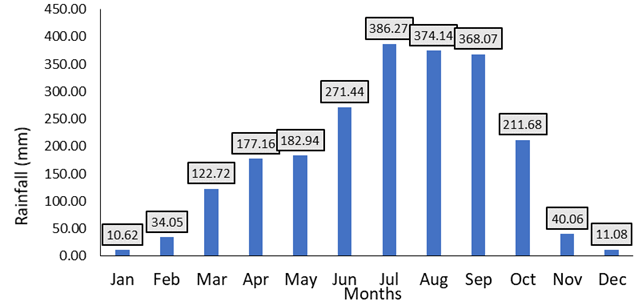
In Bamenda the rainy season begins in March/April till October/ November (Figure 2). The mean monthly rainfall, from 1963 to 2019, shows that the month of July, August and September had the highest rainfall while November, December, January and February had the minimum rainfall. Despite disparities as to the start of the rainy season for the past years, characterised by inconsistency on the onset of the first rains, Figure 2 showed that the wettest month is July and driest month is January. There is a gradual increase in the amount of rainfall from the beginning of the rainy season in March to the peak in July (Figure 2). The rains start subsiding in October as the dry season sets in.
|
|
|
Figure 2 Mean monthly rainfall for
Bamenda Data source: Meteorological Service, Regional
Delegation of Transport, North West |
3.3.2. Yearly rainfall variation
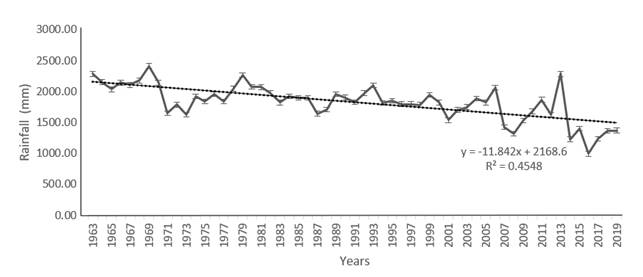
Mean yearly rainfall for the study area was collected from 1963-2019 and presented on Figure 3. From the linear trend line of Figure 3, the inter-annual rainfall for Bamenda has been decreasing (gradient -11.8); with coefficient of determination 0.4548. According to Figure 3, the highest rainfall was in 1969 (2413.3mm) while the lowest annual rainfall was in 2016 (992.5mm).
|
|
|
Figure 3 Inter-annual rainfall for
Bamenda (1963-2019) Data source: Regional Meteorological Service,
Bamenda |
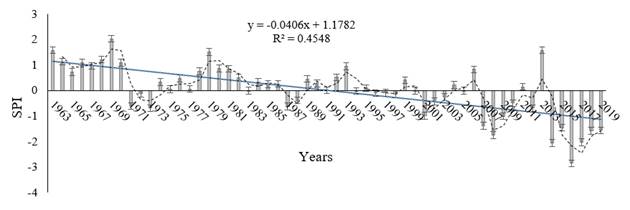
The low periods of rainfall established in the yearly rainfall (Figure 3) coincided with the periods of droughts with negative values of the SPI as presented in Figure 4.
|
|
|
Figure 4 The Standardised Precipitation
Index Trend for Bamenda (1963-2019) Data source: Regional Meteorological Service,
Bamenda. |
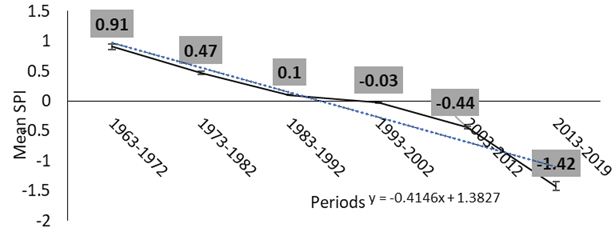
3.3.3. Decadal precipitation SPI
Decadal SPI shows a detailed scenario for periods of 10 years Table 1. Such details give a clearer picture of meteorological droughts, which can be used in assessing the impacts on water resources. The coefficient of determination for the decadal precipitation ranges from 0.028 as lowest value (1983 -1992) to 0.4752 as highest value (1973 - 1982). The various SPI for Bamenda is summarised on Table 4.
|
Table 4 Summary of SPI categories and trends |
|||||
|
Category |
Years |
Mean
SPI |
R² |
Trend |
|
|
1963-1972 |
Extreme
wet |
1969 |
|
|
|
|
Severely
wet |
1963 |
|
|
|
|
|
Moderately
wet |
1964,
1966, 1968, 1970 |
0.91 |
0.2927 |
Decreasing |
|
|
Mildly
Wet |
1965,
1967 |
||||
|
Mild
dryness |
1971,
1972 |
||||
|
1973-1982 |
Severely
wet |
1979 |
0.47 |
0.4752 |
Increasing |
|
Mildly
Wet |
1974-1978,
1980-1982 |
||||
|
Mild
dryness |
1973 |
||||
|
1983-1992 |
Mildly
Wet |
1984-1986,
1989-1992 |
0.1 |
0.028 |
Increasing |
|
Mild
dryness |
1983,
1987, 1988 |
||||
|
1993-2002 |
Mildly
Wet |
1993,
1995, 1999 |
-0.03 |
0.4424 |
Decreasing |
|
Mild
dryness |
1994,
1996-1998, 2000-2002 |
||||
|
2003-2012 |
Mildly
Wet |
2004,2006,
2011 |
-0.44 |
0.0886 |
Decreasing
below average |
|
Mild
dryness |
2003,
2005, 2010, 2012 |
||||
|
Moderate
dryness |
2007-2009 |
||||
|
|
Severely
wet |
2013 |
-1.42 |
0.246 |
Decreasing
below average |
|
2013-2019 |
Moderate
dryness |
2015 |
|||
|
Severe
dryness |
2018,
2019 |
||||
|
Extreme
dryness |
2014,
2016, 2017 |
||||
|
Source: Author’s computation |
|||||
From Table 4, the plotting of mean SPI against the various periods shows a steep decrease in rainfall (Figure 5) with linear trend line gradient – 0.4148.
|
|
|
Figure 5 Summary of decadal mean SPI
over Bamenda Source: Author’s computation |
3.4. Temperature Change from 1971 to 2020
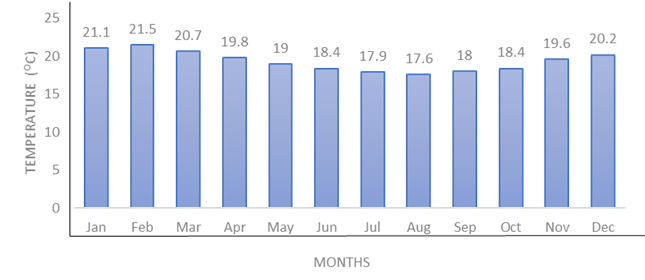
3.4.1. Monthly temperature variation
The mean monthly temperature from 1971 to 2020 showed that July August and September are the coldest months while January, February and March are the hottest months (Figure 6). Though there exist disparities as to the coldest and hottest month, Figure 6 shows that, February is the hottest month with temperature of 21.5°C while August in the coldest month (17.6°C).
|
|
|
Figure 6 Mean monthly temperature for
Bamenda Data source: Meteorological Service, Regional
Delegation of Transport, North West |
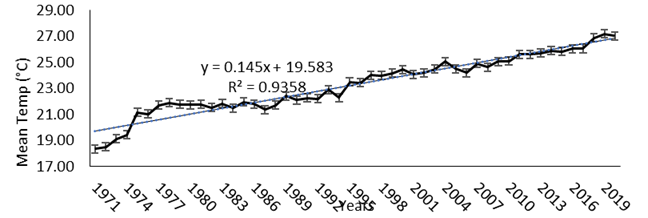
From Figure 7, the linear trend line shows that temperatures have been increasing from 1971 to 2019 with gradient 0.145. Inter-annual temperatures for the last five decades were collected and the results showed that temperatures had been increasing progressively in Bamenda with coefficient of determination 0.9358. The hottest year is 2019 with a temperature of 27.19 oC while 1971 is the coldest year (18.37 oC).
|
|
|
Figure 7 Inter-annual temperature
1971-2020 Data source: Regional Meteorological Service for the
North West |
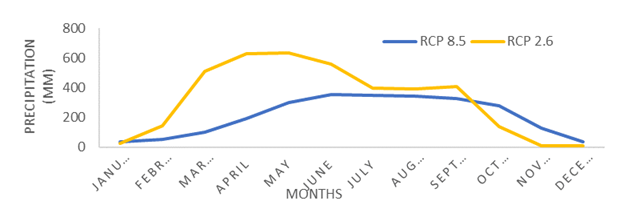
3.5. Projected precipitation and temperature data
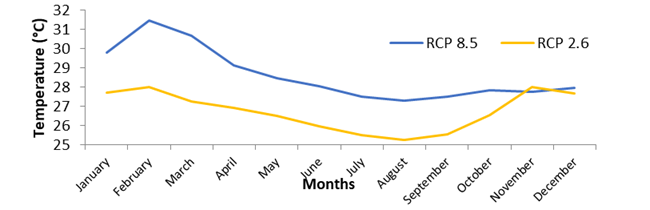
According to RCP 2.6, the highest mean monthly precipitation will be in April while for RCP 8.5 it will be in May. November will be the month with the lowest precipitation for RCP 2.6 while for RCP 8.5 the lowest precipitation will occur in the month of December (Figure 8).
|
|
|
Figure 8 Average monthly precipitation
(2021- 2060) |
Analysis of climatic data from the Representative Concentration Pathway scenarios (RCPs), showed that mean monthly temperature will be highest in February while August will record the lowest mean monthly temperature (Figure 8).
|
|
|
Figure 9 Average
monthly temperature (2021- 2060) |
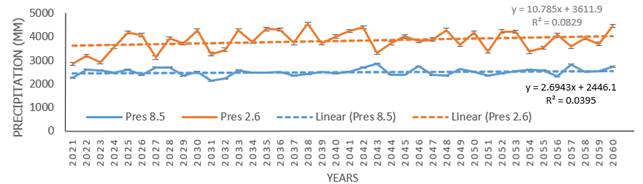
Future precipitation data showed that, there will be an increase in precipitation from 2021 to 2060 for both scenarios. RCP 8.5 recorded that, 2043 will have the highest precipitation (2852.23 mm) while 2031 will have the lowest precipitation (2141.11 mm). Precipitation is generally higher with RCP 2.6 than RCP 8.5. According to RCP 2.6, 2021 will have the lowest precipitation with value 2843.23mm while 2038 will have the highest precipitation (4560.63mm). The gradient showed 10.785 for RCP 2.6 and 2.6943 for RCP 8.5 with coefficient of determination 0.0829 and 0.0395 respectively.
|
|
|
Figure 10 Annual Precipitation pattern
from 2021-2060 |
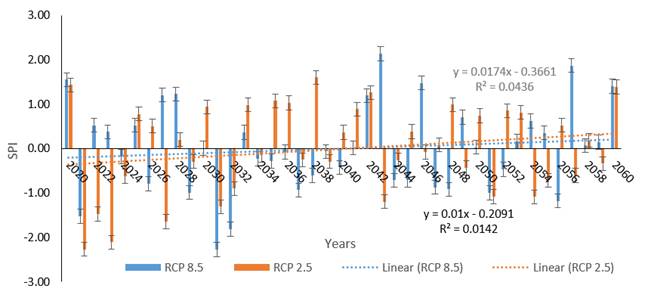
The low rainfall periods coincided with the periods of droughts with negative values of the SPI as presented in Figure 10.
|
|
|
Figure 11 Standardised Precipitation
Index Trend for Bamenda from 2021-2060 |
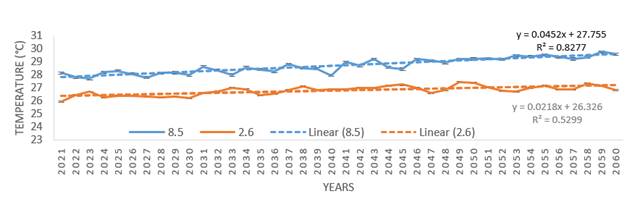
The annual projected temperature trajectory from 2021 to 2060 revealed that temperature will increase for both scenarios (Figure 11). The gradient of the increase for RCP 8.5 is 0.0452 while for RCP 2.6 it is 0.0218 with R square values of 0.5299 and 0.8277 for RCP 2.6 and RCP 8.5 respectively. The change in temperature from 2021 to 2060 is 0.85 for RCP 2.6 while for RCP 8.5 it is 1.44 °C. The hottest year as projected by RCP 2.6 is 2049 with a temperature of 27.44°C while the coldest year is 2021 with a temperature of 25.94°C. For RCP 8.5, the hottest year is 2059 while the coldest year is 2023 with temperatures 29.74°C and 27.69°C respectively.
|
|
|
Figure 12 Annual temperature pattern from 2021-2060 |
4. DISCUSSION
Hydrological cycle responds to the least climatic oscillations Niang et al. (2014). Form the results obtain through populations’ perception, the population is experiencing climatic variation and change. This is attested by the fact that 31.9% accepted irregular rainfall, 16.6% for water shortages, increased temperature (14.2%) and prolonged dry seasons (10.6%). These can lead to consumption of water of doubtful quality Bertram et al. (2017). Consumption of water of doubtful quality like water from stream, can cause water borne diseases (like typhoid, dysentery and diarrheal) and slow down economic activities Kirono et al. (2017), Niang et al. (2014).
Apart from the populations’ perception this paper when further to analysed climatic data of precipitation and temperature. It was realised that the month of July, August and September has the highest rain fall while December, January and February had the minimum rainfall. The month of low precipitation forms the dry season. This is the season where water stress is highly challenging in Bamenda. Economic activities especially those depending on water will be greatly affected Niang et al. (2014). The start of the rainy season or dry season has been inconsistent over the years showing climatic variation. The low coefficient of determination for precipitation was found to be below 50% (0.5); indicating variation in rainfall. It is therefore glaring that Bamenda is undergoing climatic variation. Changing precipitation patterns are shifting rainy seasons and affecting the timing and quantity of ground water through which most domestic water supplies are gotten Bates et al. (2008), Lükenga (2015).
Considering yearly data from 1963 to 2019, the inter-annual rainfall for Bamenda has been decreasing (gradient of -11. 842). The decrease coincided with the periods of droughts given by the negative values of the SPI. The trend line of the SPI for annual rainfall showed that Bamenda is experiencing a drop in water resources. Decadal SPI showed a decreasing gradient of -0.4146. The decrease is sharp, indicating increase severity of drought as it leaves from a value of 0.91 to -1.42 from 1963 to 2019. This has possibly caused some springs and streams to drying up and some others seasonal. The city of Bamenda which is located along the Cameroon volcanic line, is endowed with the main watershed of the country Mafany et al. (2006). This rich natural resource is gradually losing its potential caused by climate variability and change. Springs and river are drying up while some are experiencing seasonal flow. Climate change seriously affects water resource and according to World Meteorological Organisation (2014), drought causes water and food shortage. These can lead to several impact on the health of the population which may cause increase morbidity and result in death.
The coefficient of determination for projected data are far below 0.5 (0.0315 for RCP 8.5 and 0.0821 for RCP 2.6), indicating the future may possibly experience a greater climatic variation. Projected data showed that precipitation will increase, however, temperature will equally increase leaving Bamenda with a more serious challenge of poor water quality since temperature increases molecular activities and microbial action Chia et al. (2019), Fahey et al. (2017). According to FAO (2017), increase in water temperature will increase rate of evapotranspiration from water bodies resulting in shrinking of some water bodies like rivers and springs Fahey et al. (2017). Water resources greatly reduces when temperature increase Chia et al. (2019). Lower level of dissolved oxygen in water, increase concentration of pollutants and loss in aquatic species can also be caused by increase temperature Chia et al. (2019).
From the results, precipitation will have a gradient of 2.6943 for RCP 8.5 and 10.785 for RCP 2.6. Inter-annual temperatures have been continuously fluctuating between the periods 1971 to 2020. The change in temperature from 2021 to 2060 is 0.85 for RCP 2.6 while for RCP 8.5 it is 1.44 °C. These changes are in conformity with the projections made by IPCC (2007), that the global climate temperature will experience a 4 °C increase by 2100. Since about 20% decreased of renewable water resources is experienced for each decree of global warming Frederick and Major (2004), this implies for 1.44°C temperature increase in Bamenda, approximately 17 - 28% decreased water resources will be experience by 2060 in Bamenda. Trenberth et al., (2007), revealed that global mean surface temperature has increased since the late 19th Century. Increase in temperature is a result of rise in atmospheric Methane, CO2 FAO (2017), IPCC (2007) from fossil fuel combustion, agriculture, land use changes, and industrial technologies Chia et al. (2019), Fahey al. (2017) endangering water resources.
Temperature increase over time is explained by a variety of human related activities such as deforestation, population increase and some agricultural practice Kirono et al. (2017). The quest by man to meet the needs of the continuously growing population through agricultural practices such burning (ankara system) has led to the increase of greenhouses gases like methane and CO2 into the atmosphere thereby leading to increasing temperatures at local and global levels FAO (2017), Chia et al. (2019), Fahey et al. (2017). The effect of increasing temperature affects water quality and quantity Chia et al. (2019), Kirono et al. (2017). There is need for adaptation to limit the impact of these environmental changes so as reduce the susceptibly of humanity to climate variability and change. Water resources are subject to hydro-climatic variability over space and time and are a key constraint on economic development Niang et al. (2014).
Climate variability in Bamenda metropolis has superimposed onto already existing water stressed. Water challenges would hinder development and affect health Kirono et al. (2017). Freshwater-related risks of climate change increase significantly with increasing greenhouse gas (GHG) concentrations Jiménez et al. (2014). Climate change is liable to significantly reduce renewable surface water and groundwater resources according to Bertram et al. (2017). This will intensify competition for water among agriculture, ecosystems, settlements, industry, energy production, and food security Bertram et al. (2017). From the results obtained and the analysed made, Bamenda is undergoing climate variability and change and this has an impact on the water resources. Based on this, an immediate action needs to be put in place to avoid this existing challenge to worsen.
5. CONCLUSION AND RECOMMENDATION
This paper aimed at assessing past and future climate variability and change on water resources in the Bamenda metropolis of the North West Region of Cameroon. This research has shown that Bamenda is undergoing climate variability and change and these have a negative impact on water resources especially the quality and quantity. Bamenda from the population’s perspective is experiencing: irregular rainfall, water shortages, increasing temperatures and low precipitation rate. The inter-annual rainfall for Bamenda has been decreasing while temperature is increasing. Future data showed that the temperature will increase with precipitation. This has a negative impact on the water resources in Bamenda since the local hydrological systems are very sensitive to the least climatic oscillations Tume (2019), Niang et al. (2014).
The effect of climate change has caused Bamenda to gradually lose its natural water resources. The councils, State, local and international organizations have to consider a suitable option that will mitigate the effect on climate variability in the city of Bamenda. This could be achieved through:
· Indigenous knowledge systems, observations, records and media attention can assist communities to plan for future mitigation strategies and enable policy makers to implement and facilitate adaptation policies as proposed by Tume et al. (2019).
· Water friendly trees should be planted, watersheds should be protected and water management policies reinforced.
· More water storage dams and reservoirs should be constructed to mobilised water that could be used for socio-economic development.
· The Bamenda metropolis should start applying the Integrated Drought Management Programme (IDMP) put forward by World Methodological Organisation (2012).
It is, however, recommended that studies be carried out on the impact of other climatic parameters (like wind speed, Sunshine duration and relative humidity) on water resources.
REFERENCES
Acho-Chi, C. (1998). Human Interphase and Environmental Instability: Addressing the Environmental Problems of Rapid Urban Growth. Environment and Urbanization, Vol. 10(2), 164-174. Retrieved from https://doi.org/10.1630/095624798101284527
Arnell, N.W. (2006) Climate Change and Water Resources: A Global Perspective. Avoiding Dangerous Climate Change. Cambridge University Press, Cambridge, 167-175. Retrieved from http://pure.iiasa.ac.at/id/eprint/7972/1/avoid-dangercc.pdf#page=181
Bates, B.C., Z.W., Kundzewicz, S., Wu & J.P., Palutikof, (Eds.). (2008) Climate Change and Water. Technical Paper of the Intergovernmental Panel on Climate Change, IPCC Secretariat, Geneva, 210.
Bertram, M., Barrow, E., Blackwood, K., Rizvi, A.R., Reid, H., & von Scheliha-David, S. (2017) Making Ecosystem-based Adaptation Effective: A Framework for defining Qualification Criteria and Quality Standards (Friends of Ecosystem-based Adaptation-FEBA technical paper developed for UNFCCC-SBSTA 46). GIZ, Bonn, IIED, London, UK and IUCN, Gland, 14.
Chia, E. L., Kankeu, S. R., Hubert, D., (2019). Climate change commitments and agriculture a. sectoral strategies in Cameroon: Interplay and perspectives. Cogent Environmental Science, 5(1), 1-14. Retrieved from https://doi.org/10.1080/23311843.2019.1625740
Chiaga, N.F., Kimengsi, J.N., & Balgah, S.N. (2019) Catchment management and the sustainability of urban water supply. Evidence from Bamenda, Cameroon. Canadian Journal of Tropical Geography, Vol. 6 (2), pp. 1-8. Retrieved from https://www3.laurentian.ca/rcgt-cjtg/volume-6-issue-2/4543/?lang=en
Fahey, D. W., Doherty, S. J., Hibbard, K. A., Romanou, A., Taylor, P. C., (2017). Physical a. Drivers of Climate Change. In: Climate Science Special Report: Fourth National Climate Assessment. US Global Change Research program, Washington, DC, USA, 1, 73-113. Retrieved from https://doi.org/10.7930/J0513WCR
FAO, (2017). AquaCrop Training Handbooks. Book I Understanding AquaCrop. FAO, Rome, a. Italy. 50pp.
FAO, (2018). Workshop report on Knowledge exchange on the promotion of efficient rice a. farming practices and value chains in sub-Saharan Africa through South-South Cooperation. FAO of the United Nations, Elmina, Ghana., 22pp.
Frederick, K.D., & Major, D.C. (2004) Climate Change and Water Resources. In Toman, M.A., & Sohngen, B., (Eds.), (2004): Climate Change. The International Library of Environmental Economics and Policy, Ashgate Publishing Company, Burlington, 41-57.
Global Change, (2020). Chapter 4: Climate Models, Scenarios and projections. Retrieved from https://science2017.globalchange.gov/chapter/4/ Consulted on June 10, 2020
Guedjeo C.S, Kagou Dongmo A., Ngapgue F. Nkouathio D. G., Zangmo Tefogoum G., Gountié Dedzo M. and Nono A. (2012) Natural hazards along the Bamenda escarpment and its environs: The case of landslide, rock fall and flood risks (Cameroon volcanic line, North-West Region). Global Advanced Research Journal of Geology and Mining Research Vol. 2(1) pp. 015-026
Guttman, N.B. (1999) Accepting the Standardized Precipitation Index: A Calculation Algorithm. Journal of the American Water Resources Association, 35 (2), 311-322. Retrieved from https://doi.org/10.1111/j.1752-1688.1999.tb03592.x
IPCC, 2007. Climate Change (2007): Synthesis Report. Contribution of working groups I, II a. and III to the Fourth Assessment Report of the Intergovernmental Panel on Climate Change. IPCC, Geneva, Switzerland, 52pp.
IPCC, 2014. Climate Change (2014) Impacts, Adaptation and Vulnerability, Contribution of Working Group II to the IPCC Fifth Assessment Report. Cambridge University Press, Cambridge, United Kingdom & New York, 1774.
Jiménez, C.B.E., T. Oki, N.W. Arnell, G. Benito, J.G. Cogley, P. Döll, T. Jiang, and S.S. Mwakalila. (2014) Freshwater resources. In: Climate Change 2014: Impacts, Adaptation, and Vulnerability. Part A: Global and Sectoral Aspects. Contribution of Working Group II to the Fifth Assessment Report of the Intergovernmental Panel on Climate Change [Field, C.B., V.R. Barros, D.J. Dokken, K.J. Mach, M.D. Mastrandrea, T.E. Bilir, M. Chatterjee, K.L. Ebi, Y.O. Estrada, R.C. Genova, B. Girma, E.S. Kissel, A.N. Levy, S. MacCracken, P.R. Mastrandrea, and L.L. White (eds.)]. Cambridge University Press, Cambridge, United Kingdom and New York, NY, USA, pp. 229-269.
Kirono, D.G.C., Hennessy, K.J. & Grose, M.R. (2017) Increasing Risk of Months with Low Rainfall and High Temperature in Southern Australia for the past 150 years. Climate Risk Management, (16), 10-21. Retrieved from https://doi.org/10.1016/j.crm.2017.04.001
Kometa S.S. & Akoh N.R. (2012) The Hydro-geomorphological Implications of Urbanisation in Bamenda, Cameroon. Journal of Sustainable Development; Vol. 5, No. 6; 2012 ISSN 1913-9063 E-ISSN 1913-9071, 64-73. Retrieved from https://doi.org/10.5539/jsd.v5n6p64
Lükenga W. (2015) Water Resource Management. Book Boon, London, 18-19.
Mafany G.T., Fantong W.Y. and Nkeng G.E. (2006). groundwater quality in Cameroon and its vulnerability to pollution. In Groundwater pollution in Africa. Edited by Yongxin Xu and Brent Usher. Taylor and Francis London
Mairomi H. W. and Tume S.J.P., (2021) Standardized Precipitation Index Valuation of Seasonal
Transitions and Adaptation of Pastoralist to Climate Variability in Rangelands of the Bamenda Highlands of Cameroon. Journal of Ecology and Natural Resources Vol. 5(1): 000229. Retrieved from https://doi.org/10.23880/jenr-16000229
McKee, T.B., Doesken, N.J., & Kleist, J., (1993): The Relationship of Drought Frequency and Duration to Time Scales. Proceedings of the Eighth Conference on Applied Climatology. American Meteorological Society, Boston, 179-184. Retrieved from https://climate.colostate.edu/pdfs/relationshipofdroughtfrequency.pdf
McKee, T.B., Doesken, N.J., & Kleist, J. (1995) Drought Monitoring with Multiple Time Scales. Proceedings of the Ninth Conference on Applied Climatology. American Meteorological Society, Boston.
Ndoh M. I., Bitondo D., Balgah R. A., (2015). Climate Variability and Change in the Bamenda Highlands of North Western Cameroon: Perceptions, Impacts and Coping Mechanisms. British Journal of Applied Science & Technology. 12(5): 1-18. Retrieved from https://doi.org/10.9734/BJAST/2016/21818
Neba, E.N. (2009) NGO input and stakeholder participation in natural resource management: Example of North West Cameroon. International NGO Journal Vol. 4 (3), pp. 050-056. Retrieved from https://doi.org/10.5897/INGOJ.9000082
Niang, I., O.C., Ruppel, M.A., Abdrabo, A., Essel, C., Lennard, J., Padgham, & P., Urquhart. (2014) Africa. In: Climate Change 2014: Impacts, Adaptation and Vulnerability. Part B: Regional Aspects. Contribution of Working Group II to the Fifth Assessment Report of the Intergovernmental Panel on Climate Change [Barros, V.R., C.B., Field, D.J., Dokken, M.D., Mastrandrea, K.J., Mach, T.E., Bilir, M., Chatterjee, K.L., Ebi, Y.O., Estrada, R.C., Genova, B., Girma, E.S., Kissel, A.N., Levy, S., MacCracken, P.R., Mastrandrea, & L.L., White, (Eds.)]. Cambridge University Press, Cambridge, United Kingdom & New York, NY, USA, 1199-1265.
Santoso, H., Idinoba, M., Imbach, P., (2008). Climate Scenarios: What we need to know and how a. to generate them. Working Paper No. 45. Center for International Forestry Research (CIFOR). 27pp. Retrieved from: https://www.cifor.org/publications/pdf_files/WPapers/WP45Santoso.pdf . Consulted on December 20, 2020
Singh, V. P., Mishra, A., Chowdhary, H., Khedun, C. P., (2014). Climate Change and Its Impact a.on Water Resources. Modern Water Resource Engineering, 11, 525-569. Retrieved from https://doi.org/10.1007/978-1-62703-595-8_11
Tume, S.J.P. (2019) Standardised Precipitation Valuation of Water Resources Vulnerability to Climate Variability on the Bui Plateau, Northwest Cameroon. Environment and Ecology Research, 7(2), 83-92, Retrieved from https://doi.org/10.13189/eer.2019.070202
Tume, S.J.P., Kimengsi, J.N & Fogwe, Z.N. (2019) Indigenous Knowledge and Farmer Perceptions of Climate and Ecological Changes in the Bamenda Highlands of Cameroon: Insights from the Bui Plateau. Climate, 7, 138; 1-18. Retrieved from https://doi.org/10.3390/cli7120138
Tume, S.J.P., Mbilam, S.J., Ndze, A.N, Ngoran, D.N., Lawong, J.Y. & Njodzeka, G.N. (2018) Role of the Media in Climate Change Communication in the Northwest Region of Cameroon. Retrieved from https://doi.org/10.1007/978-3-319-70066-3_4
World Bank, United Nations, Census, GeoNames http://populationstat.com 2020 (accessed 20 September 2020)
World Meteorological Organisation. (2014) Atlas of mortality and Economic Losses from weather climate and water extremes. WMO (1090), Geneva, 50.
 This work is licensed under a: Creative Commons Attribution 4.0 International License
© Granthaalayah 2014-2021. All Rights Reserved.