COMPARISON ON VEGETATION COMPOSITION AND STRUCTURE OF EXCLOSURES VS. OPEN GRAZING LANDS IN NORTHERN ETHIOPIASamson Shimelse 1 1 Ethiopian Biodiversity Institute (EBI), P.O. Box. 30726, Addis Ababa, Ethiopia |
|
||
|
|
|||
|
Received 25 July 2021 Accepted 11 August2021 Published 31 August 2021 Corresponding Author Samson
Shimelse, samshimelse@yahoo.com DOI 10.29121/granthaalayah.v9.i8.2021.4154 Funding:
This
research received no specific grant from any funding agency in the public,
commercial, or not-for-profit sectors. Copyright:
© 2021
The Author(s). This is an open access article distributed under the terms of
the Creative Commons Attribution License, which permits unrestricted use, distribution,
and reproduction in any medium, provided the original author and source are
credited.
|
ABSTRACT |
|
|
|
This
study was conducted with the objectives of study investigates, compare, and
try to describe the floristic composition and structure of the vegetation of
exclosures and open grazing lands. A stratified preferential sampling design
technique with flexible systematic model was used for data collection. Data
on vegetation and environmental parameters were gathered from 120 quadrants
(90 from restorations or exclosures of different ages and 30 from adjacent
open grazing lands), of 20 m x 20 m (400 m2) size. Species richness and the
presence or absence of herbaceous plants were recorded like soil samples in a
2 m x 2 m (4 m2) subplot inside each main quadrant from five points, one at
each corner and one at the center. A
total of 142 plant species belonging to 118 genera and 52 families were
identified. All exclosures displayed higher plant species richness,
diversity, and aboveground standing biomass compared to the adjacent open
grazing lands. Consideration of edaphic (e.g., soil total nitrogen, available
phosphorus, CEC, exchangeable bases, soil pH and soil texture) and site
(e.g., Stoniness, Grazing) variables will help to optimize the selection of
areas for the establishment of future exclosures. Moreover, our study
suggests that with time exclosures may increasingly obtain an important role
as refugees and species pool similar to church forests and should be
protected and managed in a sustainable manner. However, economic and social
impacts of exclosures should be included in feasibility studies before
establishing exclosures in the future.
Altitude, Grazing and some soil parameters like Mg were the major
environmental factors in the division of the vegetation into plant community
types. The result of the frequency distribution of woody species showed a
high proportion of small-sized individuals in the lower diameter classes
indicating good recruitment potential of the forest patches and the rare
occurrence of large individuals. Such trend was probably caused by past
disturbance of the original vegetation resulting in a succession of secondary
vegetation. In addition, the analysis of species population structure
indicated that some tree species had abnormal population structure with no or
few individuals at lower size classes. Moreover, assessment of regeneration
status on the basis of age classes indicated that significant proportion of
woody species were represented by few or no seedlings, entailing that they
were under threat. Substantial numbers of forest species were found to have
irregular population structure and are in reduced regeneration status. To
prevent local extinction of these species, present efforts of nursery
establishment and plantation of indigenous species in the exclosures should
be strengthened and extended. |
|
||
|
Keywords: Exclosure,
Open Grazing, Plant Biodiversity, Northern Ethiopia |
|
||
1. INTRODUCTION
The Ethiopian highlands encompass the majority of the African land area covered by Afromontane vegetation which is over 50% Tamrat (1993), of which also the largest part is the dry Afromontane forests Demel (2005).
This vegetation represents a complex system of successions involving extensive grasslands rich in legumes, This vegetation represents a complex system of successions involving extensive grasslands rich in legumes, shrubs and small to large trees to closed forests at an altitudinal range of 1350 - 3550 m.a.s.l. with an average annual temperature and rainfall of 14 – 25oC and 700 - 1100 mm, respectively Friis (1992), Zerihun (1999).
Even though it is difficult to establish the precise cover of the past as well as the present forest vegetation of Ethiopia, it is believed that a substantial portion of the land area in the highlands of Ethiopia was covered with forests having wider coverage than at present Friis (1986). The presence of a number of isolated large-sized trees, even on farmlands, or patches of forests around churchyards and religious burial grounds in this country indicate the occurrence of vast expanses of high forests Tamrat (1993), Zerihun (1999).
Soil degradation can appear as a direct result of past agricultural practices in the highlands. The dissected terrain, the extensive areas with slopes above 16 percent, which are typical characteristics of the study area, lead to accelerated soil erosion once deforestation occurs. Besides, some of the farming practices within the northern highland encourage erosion. These include cultivation of cereal crops which require the preparation of a finely tilled seedbed and downslope plowing to facilitate drainage.
Furthermore, farmers are discouraged from investing in soil conservation practices due insecurity of land and tree tenure issues Badeg (2009). As a result, these parts of the Ethiopian highlands have remnants of natural forests scattered in inaccessible, protected and religious areas Alemayehu (2007) suggesting that the highlands were once covered by high forest Friis (1992), White (1983).
The major causes of forest degradation in northern Ethiopia are conversion to agricultural land Nyssen et al. (2004) and grazing EFAP (Ethiopian Forestry Action Plan). (1994). However, the attention given to conservation and sustainable use of these biological resources is inadequate due to low-level awareness about the role of the forests Demel (2005). Despite the high conservation value, the natural vegetation in northern Ethiopia has poorly been studied Friis (1992), and information necessary for effective biodiversity conservation is scant Aerts et al. (2006). Consequently, depletion of vegetation by anthropogenic and natural factors has led to the decline in number and area of distribution of many plant species. The study investigates, compare, and try to describe the floristic composition and structure of the vegetation of exclosures and free grazing lands.
2. MATERIAL AND METHODS
2.1. STUDY AREA
The study was conducted in three Woredas/districts of Tigray (12° - 15° N latitude and 36° 30' - 40° 30' E longitude), the northernmost region of Ethiopia (Figure 1). In the study area, the first exclosures were established almost three decades ago and accordingly we were able to select replicated (n = 3) exclosures of 10, 15 and 20 years old. We also selected separate adjacent free grazing lands, i.e., a control for each exclosure. The area of the selected exclosures ranged from 8 to 125 ha whereas that of the adjacent free grazing lands ranged from 2 to 45 ha.
|
|
|
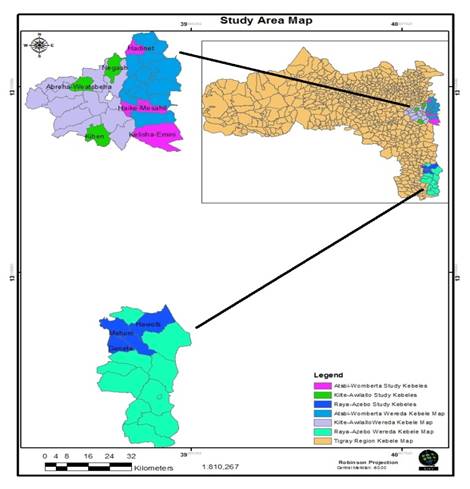
Figure 1 Map of Selected Kebeles of the
Study areas. |
The specific study area was selected based on criteria from the list of districts of the region that have had greater than twenty-five years age area exclosures with different management and utilization system. The wide variety of altitude (range between 1400 and 2900), the age of exclosures (vary between 1 and 25 years), size of exclosures (differ from 8 to 125 hectares), proportion of exclosure, and distance from residence (vary in the range 0.5 to 9 kilometers). Fair accessibility is also under consideration. However, it is rare to find all the exclosure forms in a relatively homogenous environment, mainly, agro-ecological zone. Soils of the Atsbi Wemberta and Kilte Awelaelo sites were classified into four major groups: Luvisols (Alfisols), Regosols (Entisols), Cambisols (Inceptisols) and Calcisols (Aridisols) Soil Survey Staff (1996). And the Fluvisols are mainly confined to the alluvial deposits along the river valley Gebrekidan (2004). A large part of areas vegetation is formed on Enticho sandstone and Crystalline Basement Asfawossen (2002). While in Raya Azebo the dominant soil types are Leptosols, Cambisols, Vertisols, Regosols, and Arenosols BoANRD (Bureau of Agriculture and Natural Resource Development) (1997).
Analysis of the meteorological data showed that the mean annual temperature for Raya Azebo was 20.8 0C and the mean minimum and maximum were 11.8 and 33.50C respectively. The hottest months are April and June, while coldness is from September to December. The mean annual rainfall is 604 mm, which varied greatly from year to year. Generally, the study area has bimodal rainfall pattern, with low rainfall from February to May and the main rainy season (June – September). Kilite Awulaelo Woreda average daily air temperature of the area ranges between 80C and 30.10C with a mean of 19.70C. The mean annual rainfall of the area is about 610 mm. Kilite Awulaelo Woreda has unimodal rainfall pattern.
2.2. VEGETATION
The most common woody vegetation species in exclosures and in adjacent grazing lands included Acacia etbaica, Acacia seyal, Becium grandiflorum, Euclea racemosa subsp. schimperi and Maytenus senegalensis. Understorey vegetation of exclosures and free grazing lands were dominated by grass species such as Hyparrhenia hirta and Digitaria ternata.
2.3. SAMPLING DESIGN
In this study, the assumption is that the exclosures and adjacent free grazing lands had similar conditions before the establishment of the exclosures. Which is a space for time substitution. We, therefore, selected separate adjacent free grazing lands for each exclosure to minimize differences in inherent soil properties. Furthermore, we made sure that soil and terrain conditions between the exclosures and the adjacent grazing land sites were as similar as possible.
2.4. FLORISTIC STUDY
A stratified preferential sampling design technique with flexible systematic model was used for data collection. Flexible systematic model is a special technique based on the principle of optimum allocation of samples Smartt (1978). This method may be viewed as a special form of stratified sampling since samples are allocated on the basis of some predetermined criteria Kent and Coker (1992). Local variation of floristic diversity with restoration age was used as a major criterion for sampling. The study area was first divided up into three agro-ecological zones based on altitude before samples were chosen on the basis of size and variation in the landscape. To take representative samples, 30 quadrants have been selected from each age class. In each restoration age classes, sampling was carried out based on the size and local diversity of vegetation cover. In restorations where different size, diversity, and rate of change of vegetation cover was higher more samples were taken whereas in areas with small size and little change in vegetation heterogeneity a small number of sample plots were laid out. Within each site, 3-4 quadrants were taken from the central portions of the restoration and at least 20 m from the edge and covered variations in aspect and slope. Generally, the quadrants for sampling were selected in such a manner that each is a representative of the vegetation of which it is part and that each plot sampled therein yields a more or less typical description of that vegetation in terms of both floristic composition and structure.
Data on vegetation and environmental parameters were gathered from 120 quadrants (90 from restorations or exclosures of different ages and 30 from adjacent free grazing lands), of 20 m x 20 m (400 m2) size (Kent and Coker, 1992). All vascular plant species were recorded and collected. To produce species diversity/richness of the study area, species occurring outside of the quadrants, but inside the exclosures were also recorded only as ‘present’, but they were not used in the subsequent data analysis. Species richness and the presence or absence of herbaceous plants were recorded like soil samples in a 2 m x 2 m (4 m2) subplot inside each main quadrant from five points, one at each corner and one at the center as used by Getinet Getinet (2014). Plant specimens were collected, identification and verification were done and plant nomenclature followed Flora of Ethiopia and Eritrea.
2.5. SOIL DATA
Soil samples were collected from 120 quadrants for soil analysis. From each quadrant, five soil samples (from a depth of 20 cm) were collected from an area of 2 m × 2 m from each corner and center and mixed to produce a composite soil sample, each weighing 0.7- 1 kg. One core sample was taken for bulk density analysis. The samples were collected from each position were mixed thoroughly in a large bucket to form a composite soil sample resulting in a total number of the whole samples. The soil samples were air dried by spreading on plastic trays, crushed and sieved with a mesh size of 2 mm. Soil bulk density, organic carbon and particle size were determined using the, the core method Blake and Hartge (1986), Walkley–Black method Walkley and Black (1934) and the hydrometer method Gee and Bauder (1982) respectively.
2.6. DATA ANALYSIS
Shannon diversity index, Simpson’s index of diversity and evenness, CCA ordination, and related parameters were calculated using R version 3.4.2 R Development Core Team (2017). To evaluate whether there was statistically significant difference between different age groups of exclosures t-test was conducted using SPSS software (Version 20) SPSS (2010). The remaining population parameters were computed and summarized in Microsoft Office Excel (2007) spreadsheet.
3. RESULTS
3.1. VEGETATION COMPOSITION IN EXCLOSURES AND FREE GRAZING LANDS
A total of 142 plant species belonging to 118 genera and 52 families were identified. About four major life forms were identified of which 61 (42.96%) of the species were herbs, 50 (35.21%) were shrubs, 29 (20.42%) were trees and the remaining 2 (1.41%) were climbers. Top four plant families with the highest percentages of the total recorded were Fabaceae 23 (16.2%), Poaceae 22 (15.49%), Asteraceae 12 (8.45%) and Acanthaceae 8 (5.63%). About 40.38% of the families were represented by more than one species and 59.62% of the families were represented by single species each accounting 0.70% of the total.
In exclosures, we recorded a 3 to 14 plant species representing 3 to 11 families in a plot and a total of 87-103 species whereas 2 to 9 species in a plot and a total of 76 plant species were recorded in the free grazing lands. The oldest exclosures displayed a higher number of plant families that are represented by two or more species. In all exclosures, Fabaceae, Poaceae, and Asteraceae families contributed the highest number of plant species.
Exclosures displayed a higher number of shrub and tree species compared to the adjacent free grazing lands (Table 1). Moreover, the number of species also increased with exclosure age. Furthermore, we recorded a higher number of economically important indigenous shrub and tree species (i.e., shrub and tree species that can be used by the local communities as sources of construction materials, fuelwood and the like) in exclosures compared to the adjacent free grazing lands. The proportion of economically important shrub and tree species recorded were considerable.
3.2. SPECIES RICHNESS, DIVERSITY AND ABOVEGROUND STANDING BIOMASS IN EXCLOSURES AND FREE GRAZING LANDS
All exclosures showed an evidence of higher plant species richness, diversity and aboveground standing biomass compared to the adjacent free grazing lands (Table 1). The 20-year-old exclosure displayed the highest proportion in the increase in plant species richness following the establishment (i.e., 35.5 % increase compared to the free grazing land) similarly we observed the highest increase in aboveground standing biomass in the 20-year-old exclosure (Table 1). The influence of exclosure age on evenness was not linear as the increase in a year and the highest score was in the free grazing area similarly the number of herbaceous specious was higher in free grazing but the rest parameters show consistent patterns of increase with exclosure age than the free grazing lands.
|
Table 1 Plant species richness, diversity, aboveground standing biomass, and herbaceous, shrub and tree species in exclosures and open grazing lands |
|||||||||
|
|
|
Richness |
H |
Evenness |
Above-ground biomass (t ha-1) |
Herb+ Climber Sp. in no. |
Shrub species in no. |
Tree species in no. |
Eco. Impo. S+T |
|
|
Open
grazing |
76 |
2.79 |
0.87 |
1.62 |
51 |
14 |
11 |
16 |
|
Exclosure |
10
Y |
87 |
3.52 |
0.81 |
4.73 |
42 |
27 |
18 |
29 |
|
|
15
Y |
91 |
3.68 |
0.82 |
9.72 |
39 |
29 |
23 |
34 |
|
|
20
Y |
103 |
3.82 |
0.84 |
13.93 |
44 |
31 |
28 |
41 |
|
P
value* |
|
.001 |
.150 |
.093 |
.129 |
.014 |
.001 |
.001 |
.001 |
|
Sig.
Codes |
|
*** |
|
. |
|
* |
*** |
*** |
*** |
|
*The p-values are values obtained after paired t-test @ 95 % CI
or .05 significance level. Sig. codes: 0 ‘***’ 0.001
‘**’ 0.01 ‘*’ 0.05 ‘.’ 0.1 ‘’ 1 |
|||||||||
The t-test showed that the difference was significant for richness, a number of herbaceous, shrub and tree species, and economically important shrub and tree species. This showed that exclosures had relatively higher species richness than that of free grazing areas.
3.3. SPECIES POPULATION STRUCTURE
Growth forms
All species from the study area were categorized into four growth forms (Figure 2). The growth forms classification adapted for the present analysis was very simple and general as compared to other classifications Raunkiaer (1934), Hedberg (1964). The information obtained from field and literature (Flora of Ethiopia and Eritrea.) were used for categorizing the recorded species into one of the four different growth forms, i.e., trees, shrubs, herbs, and Climbers.
|
|
|
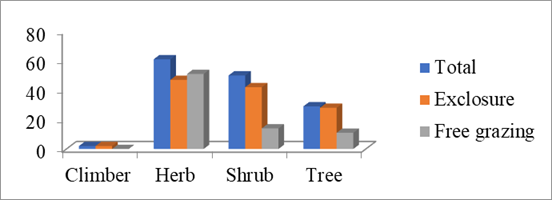
Figure 2 Species diversity according to
growth forms in exclosures and open grazing. |
As it was depicted in Figure 2, herbaceous species accounted for 43 % of the total number of species observed. Trees and shrubs together comprised 55% (trees 20% and shrubs 35%) of the total number of species. In free grazing areas, herbs accounted for the upper hand (67%) and 36% of the total. In Exclosures Shrubs, trees and lianas contributed 35, 23 and 1.7 percent, respectively. Totally, herbs, shrubs, and trees comprised 43, 35.2 and 20.4 percent respectively, while lianas accounted only about 1.4% (Figure 2).
3.4. AGGREGATION OF ENVIRONMENTAL VARIABLES IN EXCLOSURES AND FREE GRAZING LANDS
To see which environmental variables that were responsible for structuring the plant species composition and community types, the results/values of test for significance of environmental variables were obtained for Canonical Correspondence Analysis (CCA) by running the environmental data for the sites in R Statistical Software for the exclosures and free grazing areas.
CCA test for availability of axes (Table 2); results for permutation test for CCA under reduced model marginal effects of terms (Table 3) and the values of CCA (Table 4, Table 5) to display sites constrained by some environmental factors using sites for the exclosure and free grazing areas have also been provided below.
|
Table 2 Results of ANOVA. CCA test for the availability of axes for exclosures and open grazing area. |
||||||||||||
|
Exclosure |
Open grazing |
|||||||||||
|
Variable |
Df |
Chisq |
F |
N. Perm |
Pr(>F) |
Sig. |
Df |
Chisq |
F |
N. Perm |
Pr(>F) |
Sig. |
|
CCA1 |
1 |
0.62 |
3.83 |
99 |
0.01 |
** |
1 |
0.88 |
2.18 |
99 |
0.01 |
** |
|
CCA2 |
1 |
0.37 |
2.31 |
99 |
0.01 |
** |
1 |
0.76 |
1.88 |
99 |
0.01 |
** |
|
CCA3 |
1 |
0.31 |
1.92 |
99 |
0.01 |
** |
1 |
0.68 |
1.69 |
99 |
0.02 |
* |
|
CCA4 |
1 |
0.30 |
1.84 |
99 |
0.01 |
** |
1 |
0.63 |
1.55 |
99 |
0.05 |
* |
|
CCA5 |
1 |
0.25 |
1.56 |
99 |
0.01 |
** |
1 |
0.57 |
1.40 |
99 |
0.07 |
. |
|
CCA6 |
1 |
0.21 |
1.28 |
99 |
0.13 |
1 |
0.55 |
1.35 |
99 |
0.12 |
||
|
CCA7 |
1 |
0.20 |
1.23 |
99 |
0.17 |
1 |
0.50 |
1.25 |
99 |
0.26 |
||
|
CCA8 |
1 |
0.17 |
1.03 |
99 |
0.41 |
1 |
0.45 |
1.12 |
99 |
0.4 |
||
|
CCA9 |
1 |
0.16 |
1.02 |
99 |
0.46 |
1 |
0.43 |
1.06 |
99 |
0.42 |
||
|
CCA10 |
1 |
0.15 |
0.94 |
99 |
0.66 |
1 |
0.40 |
0.98 |
99 |
0.53 |
||
|
CCA11 |
1 |
0.13 |
0.80 |
99 |
0.91 |
1 |
0.37 |
0.91 |
99 |
0.67 |
||
|
CCA12 |
1 |
0.12 |
0.73 |
99 |
0.97 |
1 |
0.35 |
0.86 |
99 |
0.62 |
||
|
CCA13 |
1 |
0.10 |
0.65 |
99 |
0.97 |
1 |
0.28 |
0.69 |
99 |
0.86 |
||
|
CCA14 |
1 |
0.09 |
0.55 |
99 |
1 |
1 |
0.23 |
0.57 |
99 |
0.95 |
||
|
CCA15 |
1 |
0.08 |
0.50 |
99 |
1 |
1 |
0.19 |
0.47 |
99 |
1 |
||
|
CCA16 |
1 |
0.07 |
0.43 |
99 |
1 |
|||||||
|
Residual |
73 |
11.77 |
14 |
5.67 |
|
|
||||||
|
Signif.codes: 0 ‘***’
0.001 ‘**’ 0.01 ‘*’ 0.05 ‘.’ 0.1 ‘’ 1 |
||||||||||||
|
Table 3 Results of ANOVA.CCA values for marginal effects of environmental variables for exclosures and open grazing area. |
||||||||||||
|
Open grazing |
Exclosure |
|||||||||||
|
Variable |
Df |
Chisq |
F |
N. Perm |
Pr(>F) |
Sig. |
Df |
Chisq |
F |
N. Perm |
Pr(>F) |
Sig. |
|
Slope |
1 |
0.51 |
1.25 |
99 |
0.19 |
1 |
0.19 |
1.21 |
199 |
0.12 |
||
|
Aspect |
1 |
0.35 |
0.87 |
99 |
0.59 |
1 |
0.19 |
1.15 |
99 |
0.17 |
||
|
Grazing |
0 |
0.00 |
0.00 |
0 |
0.00 |
1 |
0.23 |
1.45 |
999 |
0.05 |
* |
|
|
Altitude |
1 |
0.55 |
1.35 |
299 |
0.12 |
1 |
0.35 |
2.19 |
199 |
0.01 |
** |
|
|
pH |
1 |
0.51 |
1.25 |
99 |
0.23 |
1 |
0.15 |
0.92 |
99 |
0.71 |
||
|
EC |
1 |
0.44 |
1.09 |
99 |
0.40 |
1 |
0.18 |
1.13 |
99 |
0.22 |
||
|
Na |
1 |
0.37 |
0.92 |
99 |
0.57 |
1 |
0.16 |
0.99 |
99 |
0.44 |
||
|
OM |
1 |
0.44 |
1.09 |
99 |
0.41 |
1 |
0.17 |
1.03 |
99 |
0.49 |
||
|
CEC |
1 |
0.49 |
1.22 |
99 |
0.25 |
1 |
0.19 |
1.18 |
99 |
0.15 |
||
|
Mg |
1 |
0.37 |
0.91 |
99 |
0.61 |
1 |
0.26 |
1.62 |
199 |
0.01 |
** |
|
|
Ca |
1 |
0.38 |
0.94 |
99 |
0.51 |
1 |
0.18 |
1.10 |
99 |
0.30 |
||
|
K |
1 |
0.44 |
1.10 |
99 |
0.32 |
1 |
0.21 |
1.33 |
999 |
0.05 |
. |
|
|
N |
1 |
0.42 |
1.03 |
99 |
0.39 |
1 |
0.15 |
0.91 |
99 |
0.68 |
||
|
P |
1 |
0.43 |
1.06 |
99 |
0.49 |
1 |
0.23 |
1.40 |
299 |
0.02 |
* |
|
|
Residual |
14 |
5.67 |
73 |
11.77 |
||||||||
|
Signif.codes: 0 ‘***’
0.001 ‘**’ 0.01 ‘*’ 0.05 ‘.’ 0.1 ‘’ 1 |
||||||||||||
|
Table 4 Biplot scores for constraining variables in Open grazing. |
||||||
|
Open grazing |
||||||
|
Variable |
CCA1 |
CCA2 |
CCA3 |
CCA4 |
CCA5 |
CCA6 |
|
Slope |
0.41 |
-0.58 |
-0.32 |
-0.37 |
-0.08 |
-0.19 |
|
Aspect |
-0.85 |
0.24 |
0.27 |
0.08 |
0.03 |
-0.18 |
|
Altitude |
0.75 |
0.63 |
0.02 |
0.08 |
0.07 |
-0.06 |
|
pH |
0.43 |
-0.66 |
-0.51 |
0.09 |
0.20 |
0.09 |
|
BD |
-0.16 |
-0.62 |
0.61 |
-0.17 |
0.29 |
-0.21 |
|
EC |
0.03 |
-0.03 |
-0.71 |
-0.06 |
0.67 |
-0.20 |
|
CEC |
-0.26 |
-0.46 |
0.37 |
0.11 |
0.02 |
-0.36 |
|
OC |
0.16 |
-0.60 |
0.09 |
-0.02 |
0.19 |
0.59 |
|
OM |
0.16 |
-0.60 |
0.09 |
-0.01 |
0.19 |
0.59 |
|
Eigen value |
0.86 |
0.75 |
0.66 |
0.53 |
0.52 |
0.47 |
|
Proportion Explained |
0.18 |
0.16 |
0.14 |
0.11 |
0.11 |
0.10 |
|
Cumulative Proportion |
0.18 |
0.33 |
0.47 |
0.58 |
0.69 |
0.78 |
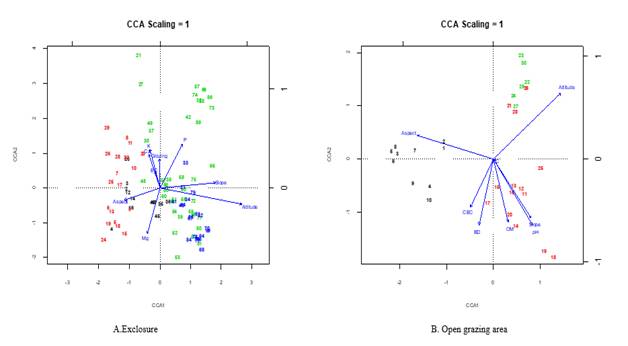
Both in exclosures and in free grazing lands we extracted six axes as independent variables form the Canonical Correspondence Analysis (CCA) of the edaphic and site parameters (Table 2).
These six axes explained 82.4 % of the total variance in exclosures and 78.5 % in the free grazing lands. Basically, the first five have statistically significant as seen in Table 2. In exclosures, the first axis was mainly related to altitude and slope (Table 5).
|
Table 5 Biplot scores for constraining variables in exclosures. |
||||||
|
Exclosure |
||||||
|
Variable |
CCA1 |
CCA2 |
CCA3 |
CCA4 |
CCA5 |
CCA6 |
|
Slope |
0.64 |
0.05 |
0.36 |
0.22 |
0.32 |
-0.44 |
|
Aspect |
-0.41 |
-0.12 |
-0.25 |
-0.10 |
0.03 |
-0.29 |
|
Grazing |
-0.01 |
0.30 |
-0.43 |
-0.17 |
0.59 |
0.17 |
|
Altitude |
0.94 |
-0.16 |
-0.25 |
-0.11 |
-0.11 |
0.05 |
|
EC |
-0.06 |
0.17 |
0.03 |
0.49 |
-0.11 |
0.43 |
|
Mg |
-0.15 |
-0.46 |
-0.54 |
0.46 |
0.21 |
0.32 |
|
Ca |
-0.13 |
0.34 |
-0.28 |
-0.02 |
0.15 |
-0.37 |
|
K |
-0.11 |
0.39 |
-0.59 |
0.14 |
-0.45 |
-0.30 |
|
P |
0.26 |
0.44 |
-0.05 |
0.35 |
0.08 |
0.48 |
|
Eigen value |
0.58 |
0.35 |
0.28 |
0.22 |
0.20 |
0.16 |
|
Proportion Explained |
0.27 |
0.16 |
0.13 |
0.10 |
0.09 |
0.07 |
|
Cumulative Proportion |
0.27 |
0.43 |
0.56 |
0.66 |
0.75 |
0.82 |
The second axis was mainly influenced by soil chemical properties P, K and Ca. The third axis was mainly related to Slope whereas the fourth axis was mainly related to EC and Mg and the fifth was with Grazing. In the adjacent free grazing lands, we did not observe a clear differentiation among the extracted axes. The first and second axis was strongly associated with altitude (Table 4). The third axis showed strong relationships with BD. The fifth axis was related to EC (Figure 3 A and B).
|
|
|
Figure 3 A &B. CCA: Displaying sites constrained by
environmental factors using clusters. |
The distribution of the study plots vegetation over environmental gradients was well explained using CCA. The bi-plot of the first six axes indicates the partitioning of the four plant communities along the measured environmental gradients. Slope, Grazing, and P were positively correlated with both axis and altitude with axis one, while aspect and Mg were negatively correlated with both axes. EC, Ca and K were negatively correlated to axis one and positively to axis 2. A range of possible environmental variables such as altitude, aspect, slope, grazing and major soil parameters like (EC, Mg, Ca, K and P) were analyzed and presumed to be structuring plant species composition and community types were indicated by ordination graph.
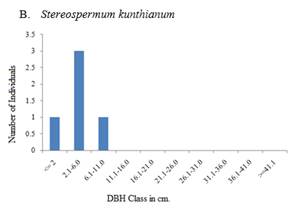
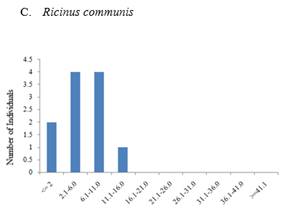
The Importance Value Index (IVI) gives a realistic value of dominance. According to the IVI Euphorbia abyssinica, Acacia etbaica, and Cordia africana are the dominant species in both areas. Whereas Astragalus atropilosulus, Euclea schimperi, Eucalyptus camaldulensis and Maytenus senegalensis are the dominant species in the exclosure (Table 6). On the other hand, Stereospermum kunthianum, Ricinus communis, Sageretia thea, and Commiphora africana are the dominant species in the free grazing areas (Table 7). The higher IVI value of these species is related to the higher basal area, density and frequency distribution they have.
|
Table 6 Importance Value Index (IVI) of selected woody plants sampled in an exclosure |
|||||
|
Species |
Life form |
RF |
RD |
RDOM |
IVI |
|
Euphorbia abyssinica |
Tree |
3.68 |
4.07 |
40.64 |
48.39 |
|
Astragalusatropilosulus |
Shrub |
1.61 |
19.64 |
0.47 |
21.73 |
|
Cordiaafricana |
Tree |
1.15 |
10.62 |
4.41 |
16.18 |
|
Acacia etbaica |
Tree |
9.20 |
0.09 |
6.50 |
15.78 |
|
Eucleaschimperi |
Shrub |
8.97 |
0.75 |
5.77 |
15.48 |
|
Eucalyptus camaldulensis |
Tree |
3.22 |
0.19 |
11.26 |
14.67 |
|
Maytenussenegalensis |
Shrub |
6.90 |
0.05 |
2.98 |
9.92 |
|
Acacia asak |
Shrub |
1.61 |
6.83 |
0.97 |
9.40 |
|
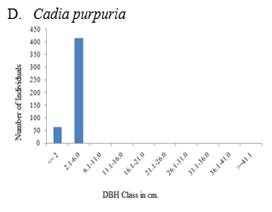
Cadiapurpurea |
Shrub |
5.06 |
0.19 |
3.87 |
9.11 |
|
Cupressuslusitanica |
Tree |
0.46 |
7.90 |
0.11 |
8.47 |
|
Table 7 Importance Value Index (IVI) of selected woody plants sampled in open grazing areas. |
|||||
|
Life
form |
RF |
RD |
Rdominance |
IVI |
|
|
Euphorbia abyssinica |
Tree |
21.21 |
35.96 |
80.94 |
138.12 |
|
Acacia etbaica |
Tree |
6.06 |
7.02 |
2.92 |
16.00 |
|
Stereospermumkunthianum |
Tree |
6.06 |
7.02 |
1.16 |
14.24 |
|
Ricinuscommunis |
Shrub |
6.06 |
6.14 |
1.11 |
13.31 |
|
Sageretiathea |
Shrub |
6.06 |
5.26 |
0.53 |
11.85 |
|
Cordiaafricana |
Tree |
4.55 |
2.63 |
3.51 |
10.68 |
|
Commiphoraafricana |
Tree |
4.55 |
3.51 |
1.05 |
9.10 |
|
Astragalusatropilosulus |
Shrub |
3.03 |
3.51 |
1.73 |
8.27 |
3.5. GROUND COVER OF HERBS
The ground cover is much better in the exclosure than in the free grazing area, thus will support further regeneration because of better soil conditions and microclimate in the exclosures (Table 8).
|
Table 8 Ground cover of herbs in exclosures and open grazing areas. |
|||||
|
Ground Cover class no. of plots and % |
|||||
|
1 |
2 |
3 |
4 |
||
|
Exclosures |
10 years |
1 (3.3) |
4 (13.3) |
22 (73.3) |
3(10.0) |
|
15 years |
0 (0.0) |
4 (13.3) |
12 (40.0) |
14 (46.7) |
|
|
20 years |
0 (0.0) |
1 (3.3) |
3 (10.0) |
26 (86.7) |
|
|
Open grazing |
25 (83.3) |
4 (13.3) |
1 (3.3) |
0 (0.0) |
|
|
Ground Cover Class: 1 = 1-25% (poor cover), 2 = 26-50% (thin
cover), 3 = 51-75% (intermediate), 3 = 76-100% (good covers) |
|||||
3.6. HEIGHT AND DBH DISTRIBUTION PATTERN OF WOODY SPECIES
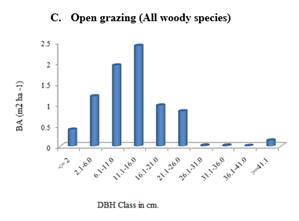
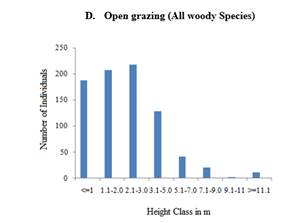
The basal area distribution for the exclosure and free grazing of each diameter class to the total basal area is considerable and smaller diameter class individuals have a higher contribution to the total basal area. The heights of the majority of trees in both sites are almost the same (Figure 4 B and D). The cumulative height class distribution pattern was an inverted J-shape, showing a decline in density of woody plants with increasing height classes (Figure 4 B and D). For instance, in exclosures, 24% of the individuals were found in the first height class (≤ 1 m). The second height class (1 – 2 m) accounted for 25% of the woody plant individuals. The third height class (2 - 3m) accounted for 34%. The rest of the height classes (i.e., 3 - 13m) contributed only 37% of the total individuals. Similar to the general height class distribution of exclosures, in free grazing lands density of woody species generally declined with increase in height class.
In the exclosure, the diameter distribution of the community of all woody species shows an inverted J shape (Figure 4 E), with more abundant individuals in the lower diameter classes. More than 70% of the individuals had a diameter distribution of less than 6 cm. Similarly, in free grazing areas, 60% of the individuals had a diameter distribution of less than 6 cm. The density distribution of woody species by DBH class showed a pattern similar to that seen for height classes. Generally, individuals from the upper diameter class (greater than 21 cm) contributed less than 2% in exclosures (Figure 4 E).
3.7. POPULATION STRUCTURE OF SELECTED WOODY SPECIES
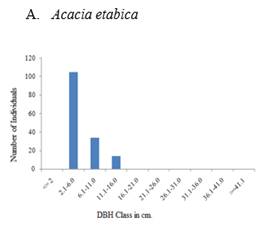
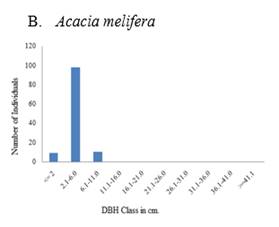
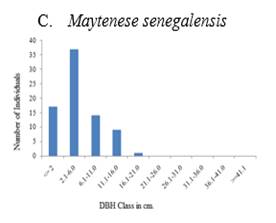
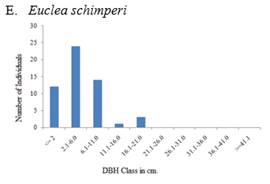
The population structure of selected woody species both in exclosure and free grazing lands followed four general diameter class distribution patterns (Figure 5, Figure 6). These include 1) inverted-J-shape, which showed that the species frequency was highest in the lower diameter classes and decreased gradually towards the higher classes e.g., Accaca etabica (Figure 5 A and Figure 6 A), 2) broken inverted J shape, e.g., Euclea schimperi (Figure 5 E), 3) bell-shape, which showed a type of frequency distribution in which the number of individuals in the middle diameter classes was high and lower in the lower and higher diameter classes, e.g., Acacia melifera (Figure 5B), and Figure 4) broken J-shape, which showed that few individuals in the lower diameter class and individuals were absent in the intermediate diameter class and relatively higher number of individuals in the highest diameter class. Example for such distribution was Schinus molle (Figure 6D).
|
|
|
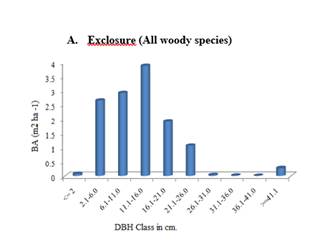
Figure 4 A-F. Basal
area (m2/ha) distribution of all woody species, Height, and Diameter class
(cm) distribution of all woody plants encountered in all plots of the
exclosure and open grazing area |
3.8. BASAL AREA AND DENSITY OF WOODY SPECIES
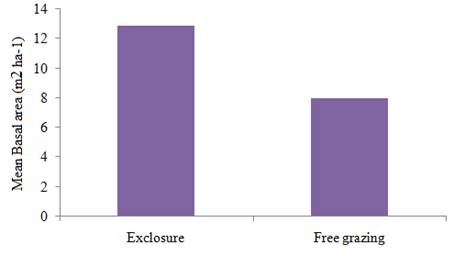
The mean basal area per hectare of exclosures and free grazing areas was shown in Figure 7. As it was indicated in Figure 7, of exclosures had higher basal area per hectare (12.91 m2) than that of free grazing areas (7.96 m2). This difference was statistically significant at P < 0.05 level of significance.
Similarly, the exclosures and the free grazing areas significantly differed in their densities of woody plants. Higher woody plant species density per hectare (856 individuals per ha) was recorded in 20 years exclosures while in free grazing areas only 137 individual per ha was recorded (Table 9). Mean density per plot recorded in 10 years exclosure was 20 individuals while in that of free grazing it was 5.5 (Table 9).
|
Table 9 Density of woody plants in exclosures and open grazing areas. |
||||||
|
Exclosure |
Open grazing |
F value |
P value |
|||
|
10 years |
15 years |
20 years |
||||
|
Total quadrants |
30 |
30 |
30 |
30 |
||
|
Total Density of woody plants |
606 |
805 |
1027 |
164 |
24.49 |
0.0005 |
|
Mean Density per quadrants |
20.2 |
26.8 |
34.2 |
5.5 |
68.25 |
0.002 |
|
Density ha-1 |
505 |
670.8 |
855.8 |
136.7 |
35.24 |
0.0004 |
4. DISCUSSION
4.1. COMPARABILITY OF EXCLOSURES AND THE ADJACENT GRAZING LANDS
The intrinsic assumption here is that exclosures and the adjacent free grazing lands had similar conditions before exclosure establishment. In this study, we tested this assumption using variables measured in the exclosures and grazing lands that are less dependent on land use (e.g., soil texture) and we observed no difference in soil texture between any of the exclosures and free grazing lands. This indicates that the sites were comparable and differences in native plant species richness, diversity and aboveground standing biomass measured between the paired exclosures and adjacent grazing lands were mainly caused by land use change and not by inherent site variability.
The range of precipitation, slope, and soil type included in our study is typical of the highlands of northern Ethiopia. This is due to the fact that more than 80 % of the northern highlands of Ethiopia receive annual rainfall between 500 and 800 mm yr-1 Fetien et al. (2008), Pender and Berhanu (2008). Also, the areas which are used for free grazing lands and areas where exclosures are established have an average slope of greater than 30 % and have an abundant stone cover Descheemaeker et al. (2006). Moreover, the majority of the northern highlands of Ethiopia are characterized by degraded soil and vegetation conditions Betru et al. (2005).
4.2. ABOVEGROUND BIOMASS, PLANT SPECIES RICHNESS, AND DIVERSITY IN FREE GRAZING LANDS
In free grazing lands, the low aboveground standing biomass, richness and diversity of plant species is a result of free grazing practices and human interference resulting in severe overgrazing which affects regeneration and growth of plant species. Severe degradation of the free grazing lands was also illustrated by the large discrepancy between the calculated number of livestock that can be supported by the available forage (between 2.92 and 3.20 TLU/HH) and the minimum number of livestock (92 head) that actually graze in the free grazing lands throughout the year per ha. The severe degradation of useful trees and shrub species in the free grazing lands is critical for the local communities, as more than 90 % of the local communities depend on bio-energy sources (wood, dung) to meet their household energy demand Zenebe (2007) which urges the need to restore these useful shrub and tree species.
In free grazing lands, we interpret the weak relationship between CCA-derived edaphic and site variables and aboveground biomass as manifestations of severe soil erosion and sediment-associated nutrient losses Mwendera et al. (1997), Girmay et al. (2009), Wolded et al. (2009) and vegetation degradation Mwendera et al. (1997), Savadogo et al. (2007). Moreover, difficulties in characterizing the extracted axis and in predicting woody biomass using edaphic and site variables may also illustrate the dominant effect of livestock and human interference in this ecosystem Zhang et al. (2006).
4.3. CHANGES IN ABOVEGROUND BIOMASS, SPECIES RICHNESS, AND DIVERSITY IN RELATION TO EXCLOSURE AGE
The Trees and shrubs or higher plant species richness, diversity and aboveground standing biomass in all exclosures compared to the grazing lands, shows that rehabilitation of the degraded grazing lands occurs in relatively short periods of time after restricting human and livestock interference. Similarly, other case studies carried out in the central and northern highlands of Ethiopia have also shown that exclosures can be effective in improving aboveground biomass, density, composition and diversity of plant species that are naturally regenerated through providing favorable microhabitats to plants Emiru et al. (2007), Wolde et al. (2010). In semi-arid Kenya, Verdoodt et al. (2010) and Muchiru et al. (2009), and in Iran, Hosseinzadeh et al. (2010) also reported that exclosures increased woody and herbaceous species richness, diversity and aboveground biomass.
The richness of plant species and aboveground biomass increased with exclosure age. This was supported by the decreasing trend of vegetation similarity between exclosures and grazing lands with exclosure age and by the increase in species with exclosure age (i.e., the increase in beta diversity; Table 1). The strong increase in plant species richness during the first 10 years following exclosure establishment (Table 1) is the result of the establishment of large numbers of herbaceous and small shrub species as a result of the prohibition of grass and herbaceous species harvesting. There is a slow increase in plant species richness from 15 years to 20 years of exclosure establishment. This may be probably by a manifestation of large shrub and tree species which gain dominance and suppress the abundance of herbaceous, grasses and small shrub species through canopy closure. This was supported by the consistent increase in the number of tree species with exclosure age and the higher number of shrub species in the oldest exclosures (Figure 2). Also, the substantial increase in aboveground biomass with exclosure age is a reflection of vegetation succession illustrated by the increase in abundance and biomass of large shrubs and trees. The increase in Fabaceae family’s proportion, which are legumes in the oldest exclosures, would probably improve also the nitrogen availability with exclosure age which may have contributed to the continuing biomass increase Carpenter et al. (2001). Similar successional patterns showing that herbaceous/grass biomass and diversity decrease while shrub and tree abundance increase with exclosure age have been reported in other case studies conducted in the highlands and lowlands of Ethiopia Yayneshet et al. (2009), Ayana and Oba (2010) and in South African savanna areas Smit et al. (1999).
With the positive correlations in exclosures of CCA-axis-1 with P, we were able to show the positive influence of soil fertility on vegetation restoration following exclosure establishment. This was already suggested in an earlier study by Aerts et al., Aerts et al. (2006) who indicate that the success of natural regeneration in exclosures will greatly depend on the quality of the physical environment and the vicinity to forest remnants. Other studies conducted in the highlands of Ethiopia Desalegn (2009) and in other semi-arid ecosystems Lane et al. (1998), Leger et al. (2007) have also shown the influences of moisture and soil nutrient content in increasing the number of woody species and aboveground net primary productivity. The negative correlation between CCA-axis 1 and aspect is probably the effect of shading by regenerated shrubs and trees in the oldest exclosures which suppressed the growth of grasses. The inverse correlation of CCA-axis 3 with grazing illustrates the reduction of plant species richness and diversity Desalegn (2009), Ermias (2011).
Our results show that easily measurable variables such as edaphic and site characteristics are strong predictors of plant species richness, diversity and aboveground biomass in exclosures. It is also revealed that in these successional plots soil nutrients and precipitation were more important in explaining the total variability in aboveground biomass than plant species richness. This information may support land managers to identify optimal places for establishing exclosures in the future and to establish or improve management of existing exclosures. The applicability of our findings is, however, restricted to areas having edaphic and site conditions within the range of values in our study sites.
4.4. COMPARISON OF EXCLOSURES WITH CHURCH FORESTS AND DRY AFROMONTANE FORESTS
The 15 and 20 years-old exclosures had more woody species compared with church forests studied in Tigray by Wolde et al. (2010). This suggesting that in exclosures less than two decades was required to reach a level comparable to church forests. This was also evident from the relatively high value of the Shannon-Wiener diversity index of the 15 and 20 years-old exclosures (H = 3. 68 and 3.82, respectively) compared with that of church forests in Tigray by Wolde (H = 1.63). Quite a lot of species were unique to exclosures and church forests (i.e., high beta diversity) although the majority of these species are herbaceous and small shrub species. Compared with natural dry Afromontane forests in Ethiopia, all exclosures had a lower number of woody species Alemnew et al. (2007). Also, the Shannon-Wiener diversity index of all exclosures (H = 3.52 to 3.82) was comparable compared to the dry Afromontane Forest (H = 2.72 to 3.72) Alemnew et al. (2007), Tadesse et al. (2000). This illustrates that the 20-year-old exclosures are in a good diversity status but relatively in an early successional stage. The increase in economically important indigenous species with exclosure age is, however, encouraging and suggests that with time a valuable Afromontane Forest may develop.
Compared to native forests, church forests are very small forest fragments that have a species-poor tree and shrub community. They are, however, important for their role in the landscape ecology of the region as refugees and species pools Aerts et al. (2006). As their area increases, with time exclosures may increasingly obtain a similar role or even better as church forest.
4.5. FLORISTIC COMPOSITION
Even though this study is not in forest area, the vegetation in the restoration sites was compared with other forests in East Africa montane forests, and church forests since it is difficult to get information from similar restoration sites. Based on these results of the floristic analysis showed that restored vegetation of Tigray was rich in species composition as shown by the presence of 142 plant species belonging to 118 genera and 52 families. The observed diverse flora of Study sites was in line with the general pattern of rich species presence in East African montane forests.
Generally, tropical forests are among ecosystems that have high species diversity of the world Gentry (1995). East African forests are also considered the center of botanical endemism Lovett (1998). According to Coetzee Coetzee (1978) and Tamrat (1993), among the Afromontane Forest regions, East African Mountains (found in Ethiopia, Kenya, Tanzania, and Uganda) have the richest and most diverse flora. Comparison of species richness in tropical and subtropical dry forests is difficult due to the inherent heterogeneity of the forests Murphy and Lugo (1986) and difference in forest size, data collection methodology, and objectives of the studies. However, to give a general picture of the species richness of study sites, the results of the present study were compared with results from other forests in Ethiopia.
Accordingly, in this study sites even higher species richness than some other forests in Ethiopia such as Masha (130 species) Abreham et al. (2013), Komto forest (103 specie) Fekadu et al. (2012), Jibat Forest (131 species) Tamrat (1993). However, its species richness was found to be less when compared to other forests, e.g., Borena Sayint National Park (397 species), Husen (2014), Simien Mountains National Park (532 species) Getinet (2014). Chilimo Forest (213 species) Teshome and Ensermu (2013). All these differences in species richness among these sites could mainly be attributed to the dissimilarities of the sites in terms of location, altitude, human impact, rainfall, and other biotic and abiotic factors. Variation in species composition over different forests could be attributed to the topographic difference among the forests compared, as well as the degree of available gradients in the respective forests Chen et al. (2004).
The highest representation of species from the family Fabaceae, Poaceae and Asteraceae species in the study sites, in general, could be related to the fact that they are species-rich families in the flora area, Ethiopia, and Eritrea Mesfin (2004). Some of these families, for instance, Asteraceae, Euphorbiaceae, and Fabaceae were said to be always among the top 10 species-rich families in many Neotropical forests Gentry (1995). Hence, the dominance of these families in this study was in agreement to their general dominance in tropical forests.
Successful colonization of these families can be attributed to their pollination, morphological and dispersal mechanism that facilitate to move for long distance and set down in the unoccupied parts of the Forest. According to Hedberg Hedberg (1964), wind dispersal is one of the main mechanisms affecting long-distance dispersal for Afromontane landscapes. Moreover, many species of Asteraceae are having umbrella shape structures adapted for air dispersal Hedberg (1964), and increase their opportunity to the successful establishment of their populations. Physiological and genetic adaptation such as the augmented power of germination and ability to endure severe climatic circumstances and biotic competition for limited resources might facilitate for their dominance Ahmed (2013). There were also very poorly represented families, with only one or two genera and only a single or few species each. Species of these families were either rare or restricted in their distribution.
Results for growth form analysis also showed that herbaceous species outnumber in restored vegetation and free grazing areas of Tigray (Figure 2) when compared to other growth forms. This could be related partly to disturbance and presence of canopy gap in the restoration areas. These observations are in agreement with similar patterns of dominance of herbaceous species in other Ethiopian montane forests even.
Out of the species collected from the study area, Lagggera tomentosa species was endemic to Ethiopia. Out of this also Becium grandiflorum species was categorized near threatened (NT) and Leucas abyssinica categorised as species of least concern (LC) in the IUCN Red List Categories of Ethiopia and Eritrea Vivero et al. (2005). Thus, conservation measures in restoration areas by policymakers, natural resources managers or stakeholders helps to take into account special protection and monitoring of such endemic and threatened species of the area in order to avoid further extinction and to conserve the natural habitat status.
Results of plant species richness and diversity of the study sites showed, higher species richness and diversity for 20 years exclosure. This difference was also confirmed using log species richness vs plot rank curve and found to be statistically significant (Table 1 and Figure 2). Human and livestock disturbance could influence its abundance of species. Associated with this disturbance different types of environmental factors affect the processes that can both enhance or extinct diversity Sagar et al. (2003). Free grazing lands and exclosures have different impacts and these activities can affect species diversity when they are undertaken.
A higher number of species resulted in higher Shannon diversity. Accordingly, the higher species richness at exclosures of higher ages gave higher Shannon diversity index when it is compared with that of lower ages of exclosure or free grazing (Table 1). According to Magurran Magurran (2004), the presence of greater evenness or greater richness or both in an area can result in increased Shannon diversity.
This shows that the exclosures had more trees and shrubs enriched than free grazing areas. This is similar to the findings of Yayneshet et al. (2009) revealing that density of woody species in exclosure is more than twice that of adjacent browsed areas. Betru et al. (2005) also found an average number of species per plot is higher in closed area than in open areas indicating that there was more species diversity in the exclosure. This difference could be due to the protection of human being and domestic animal disturbance and this might be motivated seed germinating and growing up Demel (1996). Therefore, it can be inferred that the area closure is more worthy than the non-closed in terms of trees and shrubs richness. This indicates that the closure is more worthy than if it were not closed.
Species richness as a measure of diversity is fundamental to assess community situation and quantitative evaluation of biodiversity. But, as it is stated by, Chiarucci et al. (2003), the entire inventory of a total number of species for the extensive study of plant population is not easy. Therefore, estimating species richness using various numerical methods is mandatory in studies of biodiversity Magurran (2004). This can help to examine changes in ecological consistency and as necessary tool to make conversant decisions in conservation.
4.6. SPECIES POPULATION STRUCTURE
We found that the species population structure of the study area was represented by an inverted J-shape distribution pattern (Figure 4 A-F). This confirms a general pattern of normal population structure where the number of individuals’ decreases as the height and DBH class increases, indicating the vegetation is in a stage of secondary regeneration. Tamrat (1993) and, Fekadu et al. (2012) had reported similar results from the different Afromontane forests of Ethiopia. This type of population structure is typical of many tropical forest tree species Cesar (1992), and is a sign of good regeneration ability.
However, this pattern does not show trends of population dynamics and recruitment processes of a given species. Investigation of population structures for each individual tree species could offer more sound and detailed information for conservation actions. DBH measurements of some selected tree species revealed different patterns of population structure, showing diverse population dynamics between species (Figure 5, Figure 6). An inverted J-shaped distribution pattern was shown by Acaca etabica, where the species frequency was highest in the lower diameter classes and decreased gradually towards the higher classes, confirmed good regeneration. Conversely, different distribution patterns for instance broken inverted J-shaped (Euclea schimperi); bell-shaped (Acacia melifera) and broken J-shaped (Schinus molle) were also investigated both in exclosures and free grazing areas. Therefore, different biotic and/or abiotic factors could have contributed to the absence of individuals in some DBH classes. According to Alemayehu (2007), livestock-induced disturbances might be among the major factors constraining regeneration and recruitment of woody species and contributing, ultimately, to the decline of woody species populations in forests., Pueyo et al. (2006) reported that community structure was proved to be more sensitive to grazing effects.
In the exclosure the diameter distribution of the community of all woody species shows an inverted J shape (Figure 4 E), The diameter distribution for the free grazing also shows an inverted J shape (Figure 4 F) with more abundant individuals in the lower diameter classes. It indicates active and uniform regeneration. The percent of seedling, sapling, and trees for the exclosure was 29%, 21%, and 20.4% respectively.
|
|
|
Figure 5 A-F Diameter class (cm)
distribution of some major woody plants encountered in all plots of the
exclosure. |
|
|
|
Figure 6 A-D. Diameter class (cm) distribution of some
major woody plants encountered in all plots of open grazing area. |
There is no problem of regeneration but the regenerated seedlings have been trampled by the free grazing animals. Species like Schinus molle and Euclea schimperi had more gaps in the distribution. Mature trees and seedlings are limited. It shows a more disturbed regeneration pattern. There was a very low abundance of tree seedling individuals in the lower diameter classes of the free grazing and much dominated with shrubs of middle diameter class.
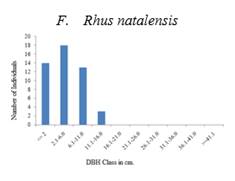
The population structure helps to study the regeneration pattern of a species Swamy (2000). The major species in the exclosure such as Acacia etbaica and Rhus natalensis are represented by high seedling proportion. These species could have seeds that are easily germinating and match their seed dispersal to the rainy season Demel (1996). The high proportion of seedlings in the exclosure showed the potential for the restoration of a woody community. A lower proportion of seedlings of the same species in the free grazing area were less promising.
Since the exclosure is protected from interference, there is a high probability of growing to the next diameter class, which gives a sound population structure. The most dominant Acacia etbaica also shows an inverted J- shape distribution. The high proportion of seedlings shows a self-maintaining population structure implying the probability of being the main species in the recovery of the woody community.
In the free grazing area Acacia etbaica, the dominant species contributes much to the community structure but has a discontinuous type of population distribution with a higher frequency of middle-class diameters. The low proportion of seedlings is probably because of grazing or trampling and shows that the free grazing area has a lower potential for rehabilitation than the exclosure. Cutting for fuelwood may decrease the probability of recruitment to higher diameter classes.
Species like Euclea schimperi and Rhus natalensis in the exclosure occur mostly as bushes with a high number of individuals in the lower classes. Trees in higher diameter classes occur irregularly or are missing. This pattern indicates a good reproduction but a bad recruitment to bigger trees in both the exclosure and the free grazing area. Bigger trees of Euclea schimperi may be cut since the species is important for ceremonies. Species like Schinus molle show a discontinuous or periodic recruitment. The distribution indicates that the number of seedlings may be sufficient to maintain the population. Bigger trees of these less common species might be remnants from the previous vegetation.
The exclosure has a sound type of regeneration, represented both by the community structure and individual species population structure. The unprotected area shows a more obstructed type of structure, mainly indicated by the dominant species. These revealed that the high level of protection in the exclosure helps the regeneration of woody species.
Generally, distribution of population structure which deviates from inverted J-shaped pattern demonstrates historical disturbance of the vegetation by natural or manmade attributes. The species with irregular distributions were trees that are highly required by the local people. Comparable results to the aforementioned tree species population structure were also investigated in different Afromontane Forests of Ethiopia by Tamrat (1994), Feyera (2006), Tadesse et al. (2008), Samson et al. (2010), and Getinet (2014).
With regard to basal area analysis, Exclosures had shown higher values than that of free grazing areas (Figure 7). Density, competition and/or site productivity have an effect on the basal area of vegetation. The density of woody plants (Table 9) in exclosures was higher than that of free grazing areas. In addition, with an increase in exclosures age the density is increasing which have maturation stage, and intensity of disturbance of the sites was not the same, which might have contributed to the total basal area difference. Kohyama (1992), described growth form composition of communities can significantly affect the processes that are responsible for the vertical arrangement of the vegetation.
|
|
|
Figure 7 Mean basal area per ha of
exclosures and open grazing areas |
The ecological behavior of the species and their site conditions are closely linked to growth forms Raunkiaer (1934). But factors causing disparity in species richness may vary between growth forms. In terms of growth form comparison, exclosures had shown highest species richness compared to free grazing areas (Table 1).
Higher percentage proportion of herbaceous species in free grazing areas possibly relate to the effects of competition and shade effects of less canopy closure of woody species. Additionally, useful woody species in the free grazing lands is critical for the local communities that depend on bio-energy sources. But in General terms, herbaceous growth forms were abundant in the study sites indicating a diversity of local habitats due to the difference in moisture, disturbance, and edaphic gradients Whittaker et al. (2001). The ground cover is much better in the exclosure than in the free grazing area, thus supporting further regeneration because of better soil conditions and microclimate (Table 8).
5. CONCLUSION AND RECOMMENDATIONS
Our study showed that the establishment of exclosures on degraded free grazing lands in the northern highlands of Ethiopia is a viable option to restore native vegetation composition, richness, diversity and aboveground biomass. Consideration of edaphic (e.g., soil total nitrogen, available phosphorus, CEC, exchangeable bases, soil pH and soil texture) and site (e.g., Stoniness, Grazing) variables will help to optimize the selection of areas for the establishment of future exclosures. Moreover, our study suggests that with time exclosures may increasingly obtain an important role as refugees and species pool similar to church forests and should be protected and managed in a sustainable manner. However, economic and social impacts of exclosures should be included in feasibility studies before establishing exclosures in the future.
Altitude, Grazing and some soil parameters like Mg were the major environmental factors in the division of the vegetation into plant community types. The result of the frequency distribution of woody species showed a high proportion of small-sized individuals in the lower diameter classes indicating good recruitment potential of the forest patches and the rare occurrence of large individuals. Such trend was probably caused by past disturbance of the original vegetation resulting in a succession of secondary vegetation. In addition, the analysis of species population structure indicated that some tree species had abnormal population structure with no or few individuals at lower size classes. Moreover, assessment of regeneration status on the basis of age classes indicated that significant proportion of woody species were represented by few or no seedlings, entailing that they were under threat.
Based on the study findings, the following recommendations were also drawn: Substantial numbers of forest species were found to have irregular population structure and are in reduced regeneration status. To prevent local extinction of these species, present efforts of nursery establishment and plantation of indigenous species in the exclosures should be strengthened and extended. Before expanding the area covered by exclosures, it is crucial to consider forest management options such as enrichment plantation of indigenous woody species that can grow fast in exclosures to address the shortage of fuelwood and improve future ecological and economic benefits of the exclosures. Moreover, transferring the direct and indirect benefits of exclosures into payments for the respective ecosystem services could increase the interest of the local communities on exclosures and special attention should be given to solve the shortage of grazing land due to exclosure so as to encourage community’s interest in expanding and managing exclosure practices in their locality.
ACKNOWLEDGEMENTS
The corresponding author acknowledges International Foundation for Sciences (IFS) of Sweden under their IFS Grant for their financial support. Addis Ababa University, Mekelle University and the Soil Laboratory are also highly acknowledged.
REFERENCES
Abreham, A., Sebsebe, D., and Zerihun, W. (2013). Floristic composition, structure and regeneration status of Masha forest, south-west Ethiopia. African Journal of Ecology 52: 151-162. Retrived from https://doi.org/10.1111/aje.12098
Aerts, R., Overtveld, K.V., Mitiku, H., Hermy, M., Deckers, J. and Muys, B. (2006). Species composition and diversity of small Afromontane forest fragments in northern Ethiopia. Plant Ecology 187: 127-142. Retrived from https://doi.org/10.1007/s11258-006-9137-0
Ahmed, A. (2013). Diversity and distribution of the Afroalpine flora of eastern Africa with special reference to the taxonomy of the genus Pentaschistis (Poaceae). MSc. Thesis, Kenyatta University, Kenya. Retrived from http://thesisbank.jhia.ac.ke/id/eprint/1658
Alemayehu, W. (2007). Ethiopian Church Forests: opportunities and challenges for restoration, Ph.D. Dissertation. Wageningen University, Wageningen, the Netherlands. Retrived from https://library.wur.nl/WebQuery/wurpubs/357878
Alemnew, A., Demel, T., Yonas, Y., and Edwards, S. (2007). Diversity and status of regeneration of woody plants on the peninsula of Zegie, northwestern Ethiopia. Tropical Ecology 48: 37-49. Retrived from https://d1wqtxts1xzle7.cloudfront.net/31445269/Alelign_et_al-with-cover-page-v2.pdf?Expires=1629778967&Signature=e1Sg6UXdGhoQ43koa7qoAOzSyocgmUNFZK8esirDZwfvgVlFnaPQdWcf4qi8IbPfLY25Dr915mI5A5NICAqBf0JwWfngfb2NDSQq-vtLzqjt7n7tJaAB1Zo3mxcoA69vWUzXTXexQkLbZ7jb7Xf8tzjUntJ~C5FLeE6m2DCWwptnK~SsgXpnfEb-d~PN5lOwk7-woZgLjAVzobGH60WcungnksozamZNEYzGL0GktyzbwP4MjdCHGX1GrOWj4YZm4QsL64RIwg41darfaUTjk2BoRxSbLnTVsEaCqHhkImUSuavDxv0jEbv2Z~ieWA9tCANcF4Y5b4gzcblI2ZWgOg__&Key-Pair-Id=APKAJLOHF5GGSLRBV4ZA
Asfawossen, A. (2002). The Rock-Hewn churches of Tigrai, northern Ethiopia: A geological perspective. Geoarchaeology 17: 649-663. Retrived from https://doi.org/10.1002/gea.10035
Ayana, A., and Oba, G. (2010). Effects of grazing pressure, age of enclosures and seasonality on bush cover dynamics and vegetation composition in southern Ethiopia. J. Arid Environ. 74: 111-120. Retrived from https://doi.org/10.1016/j.jaridenv.2009.07.015
Badeg, B. (2009). Deforestation and Land Degradation in the Ethiopian Highlands: A Strategy for Physical Recovery. Northeast African Studies 8(1): 7- 26. Retrived from https://doi.org/10.1353/nas.2005.0014
Betru, N., Jawad, A., and Ingrid, N. (2005). Exploring ecological and socio-Economic issues for the improvement of area enclosure management: A Case Study from Ethiopia. DCG Report No. 38. May 2005. Pp 3-30. Retrived from https://www.utviklingsfondet.no/dcg/assets/documents/Publications/260-report38.pdf
Blake, G.R., and Hartge, K.H. (1986). Bulk density. In: Klute, A. (ed.), Methods of soil analysis: part 1. Physical and mineralogical methods, ASA Monograph 9: 363-375. Retrived from https://doi.org/10.2136/sssabookser5.1.2ed.c13
BoANRD (Bureau of Agriculture and Natural Resource Development). (1997). Tigray livestock Development action program: Executive summary, Volume II. Mekelle, Ethiopia. Unpublished. 23pp.
Carpenter, S., Walker, B., Anderies, J. et al. (2001) From Metaphor to Measurement: Resilience of What to What?. Ecosystems 4, 765-781. Retrived from https://doi.org/10.1007/s10021-001-0045-9
Cesar, S. (1992). Regeneration of tropical dry forests in Central America, with examples from Nicaragua. Journal of Vegetation Science 3: 407-416. Retrived from https://doi.org/10.2307/3235767
Chen, X., Eamus, D., and Hutley, L.B., (2004). Seasonal patterns of fine-root productivity and turnover in a tropical savanna of northern Australia. Journal of Tropical Ecology 20: 221-224. Retrived from https://doi.org/10.1017/S0266467403001135
Chiarucci, A., Enright, N.J., Perry, G.L., Miller, B.P., and Lamont, B.B. (2003). Performance of nonparametric species richness estimators in a high diversity plant community. Diversity and Distributions 9: 283-295. Retrived from https://doi.org/10.1046/j.1472-4642.2003.00027.x
Coetzee, J. A. (1978). Phytogeographical Aspects of the Montane Forests of the Chain of Mountains on the Eastern Side of Africa. Erdwiss Forsch, 11, 482-494.
Demel, T. (1996). Seed ecology and regeneration in dry Afromontane forests of Ethiopia. Ph.D Dissertation. Swedish University of Agricultural Sciences, Umea, Sweden.
Demel, T. (2005). Seed and regeneration ecology in dry Afromontane forests of Ethiopia: I. Seed production - population structures. Tropical Ecology 46: 29-44. Retrived from https://www.tropecol.com/pdf/open/PDF_46_1/46103.pdf
Desalegn, W. (2009). Plant species and functional diversity along altitudinal gradients, Southwest Ethiopian Highlands. Ph.D Dissertation, University of Bayreuth, Germany, pp. 139. Retrived from https://doi.org/10.1111/j.1654-1103.2010.01177.x
Descheemaeker, K., Nyssen, J., Rossi, J., Poesen, J., Mitiku, H., Moeyersons, J., and Deckers, J. (2006). Sediment deposition and pedogenesis in exclosures in the Tigray Highlands, Ethiopia. Geoderma, 132: 291-314. Retrived from https://doi.org/10.1016/j.geoderma.2005.04.027
EFAP (Ethiopian Forestry Action Plan). (1994). Final report volume 6. Addis Ababa, Ethiopia: 1-47pp.
Emiru, B., Demel, T., and Barklund, P. (2007). Enclosures to enhance woody species diversity in the drylands of Tigray. East African Journal of Science, 1: 136-147. Retrived from https://doi.org/10.4314/eajsci.v1i2.40352
Ermias, A. (2011). Forest diversity in fragmented landscapes of northern Ethiopia and implications for conservation. Ph.D. Dissertation, University of Bonn, Germany. Retrived from https://nbn-resolving.org/urn:nbn:de:hbz:5N-22947
Fetien, A., Waters-Bayer, A., and Bjornstad A. (2008). Farmers' seed management and innovation in varietal selection: implications for Barley breeding in Tigray, Northern Ethiopia. Ambio 37: 312-320. Retrived from https://doi.org/10.1579/0044-7447(2008)37[312:FSMAII]2.0.CO;2
Feyera, S. (2006). Biodiversity and ecology of Afromontane rainforests with wild Coffea arabica L. populations in Ethiopia. Ecology and Development Series No. 38. Center for Development Research, University of Bonn. Retrived from https://cuvillier.de/uploads/preview/public_file/4642/3865378072.pdf
Friis, I.B. (1986). The forest vegetation of Ethiopia. Acta.Univ., Symbolae Botanicae Upsalensis 26(2): 31-47. Retrived from https://agris.fao.org/agris-search/search.do?recordID=SE8711055
Friis, I.B. (1992). Forests and Forest Trees of Northeast Africa: Their Natural Habitats and distribution patterns in Ethiopia, Djibouti, and Somalia. Her Majesty's stationary office, London. 396pp. Retrived from https://www.cabdirect.org/cabdirect/abstract/19926783733
Gebrekidan, T., (2004). Impact of free grazing and open access to communal lands on Natural Resource: The case of Tigray Regional state in Ethiopia. Ethiopian Journal of Natural Resources 6(1): 55-69 Retrived from https://agris.fao.org/agris-search/search.do?recordID=ET2009000118
Gee, G.W., and Bauder, J.W. (1982). Particle size analysis. In: Klute, A. (ed.), Methods of soil analysis: part 1. Physical and mineralogical methods, ASA Monograph 9: 383-411. Retrived from https://doi.org/10.2136/sssabookser5.1.2ed.c15
Gentry, A.H. (1995). Patterns of diversity and floristic composition in neotropical montane forests. In: Churchill S. P., Balslev H., Forero E. and Luteyn J. L. (eds.) Biodiversity and Conservation of Neotropical Montane Forests, The New York Botanical Garden, Bronx, New York, pp. 103-126.
Getinet, M. (2014). Diversity, Structure, Regeneration, and Status of Vegetation in Simien Mountains National Park, Northern Ethiopia. Ph.D. Dissertation, Addis Ababa University, Ethiopia.
Girmay, G., Singh, B.R., Nyssen, J., and Borrosen, T. (2009). Runoff and sediment-associated nutrient losses under different land uses in Tigray, Northern Ethiopia. Journal of Hydrology 376: 70-80. Retrived from https://doi.org/10.1016/j.jhydrol.2009.07.066
Hedberg, O. (1964). Features of Afroalpine plant ecology. Acta Phytogeographica Suecica 49: 1 - 144. Retrived from https://www.diva-portal.org/smash/get/diva2:565487/FULLTEXT01.pdf
Hosseinzadeh, G., Jalilvand, H., and Tamartash, R. (2010). Short term impacts of enclosure on vegetation cover, productivity, and some physical and chemical soil properties. Journal of Applied Sciences 10: 2001-2009. Retrived from https://doi.org/10.3923/jas.2010.2001.2009
Husen, A. (2014). Plant Diversity and Ethnobotany of Borena Sayint National Park, northern Ethiopia. Ph.D. Dissertation, Addis Ababa University.
Kent, M. and Coker, P. (1992). Vegetation Description and Analysis: A practical approach. New York: John Wiley and Sons Ltd. 363pp.
Kohyama, T. (1992). Size-structured multi-species model of rain forest trees. Functional Ecology 6: 206-212. Retrived from https://doi.org/10.2307/2389756
Lane, D.R., Coffin, D.P., and Lauenroth, W.K. (1998). Effects of soil texture and precipitation on aboveground net primary productivity and vegetation structure across the Central Grassland region of the United States. Journal of Vegetation Science 9: 239-250. Retrived from https://doi.org/10.2307/3237123
Leger, E.A., Howe, K.M., Gurevitch, J., Eliza, W., Jonathan, H., Ashton, I.W., and Manuel, L. (2007). The interaction between soil nutrients and leaf loss during early establishment in plant invasion. Forest Science 53: 701-709. Retrived from https://doi.org/10.1111/j.1747-0765.2007.00209.x
Lovett, J.C. (1998). Eastern Tropical Affrican Center of Endemism: a candidate for world heritage status? Journal of East African Natural History 87: 359-366. Retrived from https://doi.org/10.2982/0012-8317(1998)87[359:ETACOE]2.0.CO;2
Magurran, A.N. (2004). Measuring Biological Diversity, Blackwell Science Ltd. A Blackwell Publishing Company, Melden, Mass, USA.
Mesfin, T. (2004). Asteraceae (Compositae). In: Hedberg, I, Friis, I.B. and Edwards, S. (eds.). Flora of Ethiopia and Eritrea Volume 4, part 2. The National Herbarium, Addis Ababa University, Ethiopia, Uppsala, Sweden.
Muchiru, A.N., Western, D., and Reid, R.S. (2009). The impact of abandoned pastoral settlements on plant and nutrient succession in an African savanna ecosystem. Journal of Arid Environments 73: 322-331. Retrived from https://doi.org/10.1016/j.jaridenv.2008.09.018
Murphy, P.G., and Lugo, A.E. (1986). Ecology of Tropical Dry Forest. Annual Review of Ecology and Systematics 17: 67-88. Retrived from https://doi.org/10.1146/annurev.es.17.110186.000435
Mwendera, E.J., Mohamed Saleem, M.A., and Zerihun, W. (1997). Vegetation response to cattle grazing in the Ethiopian highlands. Agriculture Ecosystems and Environment 64: 43-51. Retrived from https://doi.org/10.1016/S0167-8809(96)01128-0
Mwendera, E.J., and Mohamed Saleem, M.A. (1997). Infiltration rates, surface runoff, and soil loss as influenced by grazing pressure in the Ethiopian highlands. Soil Use and Management 13: 29-35. Retrived from https://doi.org/10.1111/j.1475-2743.1997.tb00553.x
Nyssen, J., Poesen, J., Moeyersons, J., Deckers, J., Mitiku, H., and Lang, A. (2004) Human impact on the environment in the Ethiopian and Eritrean Highlands- a state of art. Earth Science Review 64: 273-320. Retrived from https://doi.org/10.1016/S0012-8252(03)00078-3
Pender, J., and Berhanu, G. (2008). Determinants of agricultural and land management practices and impacts on crop production and household income in the highlands of Tigray, Ethiopia. J. African Economies 17: 395-450. Retrived from https://doi.org/10.1093/jae/ejm028
Pueyo, Y., Alados, C.L., and Ferrer-Benimeli, C. (2006). Is the analysis of plant community structure better than common species-diversity indices for assessing the effects of livestock grazing on a Mediterranean arid ecosystem? Journal of Arid Environments 64: 698-712. Retrived from https://doi.org/10.1016/j.jaridenv.2005.06.016
R Development Core Team (2017). R: A Language and Environment for Statistical Computing. A Programming Environment for Data Analysis and Graphics. Version 3.4.2 (2017-09-28). Vienna, Austria. ISBN 3-900051-07-0, Retrived from http://www.R-project.org.
Raunkiaer, C. (1934). The life forms of plants and Statistical Plant Geography. Clarendon Press, Oxford. Retrived from https://www.cabdirect.org/cabdirect/abstract/19340701044
SPSS (2010). Statistical Package for social Sciences. Release 20.0.SPSS Inc. Chicago, U.S.A
Sagar, R., Raghubanshi, A.S., and Singh, J.S. (2003). Tree species composition, dispersion, and diversity of along disturbance gradient in dry tropical forest region of India. Forest Ecology and Management 186: 61-71. Retrived from https://doi.org/10.1016/S0378-1127(03)00235-4
Samson, S., Tamrat, B., and Alemayehu, M. (2010). Floristic Diversity and Structure of Nechisar National Park, Ethiopia. Journal of the Drylands 3(1): 165-180
Savadogo, P., Sawadogo, L., and Tiveau, D. (2007). Effects of grazing intensity and prescribed fire on soil physical and hydrological properties and pasture yield in the savanna woodlands of Burkina Faso. Agriculture, Ecosystem and Environment 118: 80-92. Retrived from https://doi.org/10.1016/j.agee.2006.05.002
Smartt, P.F. (1978). Sampling for vegetation survey: a flexible systematic model for sample location. Journal of Biogeography 5(1): 43-56. Retrived from https://doi.org/10.2307/3038106
Smit, G.N., Richter, C.G., and Aucamp, A.J. (1999). Bush encroachment: an approach to understanding and managing the problem. In: Tainton, N.M. (ed.), Veld Management in South Africa. University of Natal Press, Pietermaritzburg, South Africa. pp. 246-260
Soil Survey Staff. (1996). Keys to Soil Taxonomy. Seventh edition. United States Department of Agriculture, Washington DC.
Swamy, P.S. (2000). Plant species diversity and tree population structure of a humid tropical forest in Tamil Nadu, India. Biodiversity and Conservation 9: 1643-1669.
Tadesse, W., Borsch, T., Denich, M, and Deme,l T. (2008). Floristic composition and environmental factors characterizing coffee forests in southwest Ethiopia. Forest Ecology and Management 255: 2138-2150. Retrived from https://doi.org/10.1016/j.foreco.2007.12.028
Tadesse, W., Demel, T., Edwards, S., and Olsson, M. (2000). Woody plant and avian species diversity in a dry Afromontane forest on the central plateau of Ethiopia: Biological indicators for conservation. Ethiopian Journal of Natural Resources 2: 255- 293.
Tamrat, B. (1993). Vegetation ecology of remnant Afromontane forests on the central plateau of Shewa, Ethiopi. Acta Phytogeographica, Sukecica 79:1-59.
Tamrat, B. (1994). Phytosociology and Ecology of Humid Afromontane Forest on the Central plateau of Ethiopia. Journal of Vegetation Science 5: 87−98. Retrived from https://doi.org/10.2307/3235642
Teshome, S., and Ensermu, K. (2013). Diversity and endemicity of chilimo forest, central Ethiopia. Bioscience Discovery 4(1): 01-04.
Verdoodt, A., Mureithi, S.M., and Ranst, E.V. (2010). Impacts of management and enclosure age on recovery of the herbaceous rangeland vegetation in semi-arid Kenya. Journal of Arid Environments 74: 1066-1073. Retrived from https://doi.org/10.1016/j.jaridenv.2010.03.007
Vivero, J.L., Ensermu, K., and Sebsebe, D. (2005). The Red list of Endemic Trees and Shrubs of Ethiopia and Eritrea. Fauna and Flora international, Cambridge, UK. 23pp.
Walkley, A., and Black. I.A. (1934). An examination of the Degtjareff method for determining organic carbon in soils: effect of variations in digestion conditions and of inorganic soil constituents. Soil Sci. 63: 251-263. https://doi.org/10.1097/00010694-194704000-00001
White, F. (1983). The vegetation of Africa. A Descriptive Memoir to Accompany the Unesco/AETFAT/UNSO Vegetation Map of Africa. UNESCO, Switzerland. 356pp.
Whittaker, R.J., Willis, K.L., and Field, R. (2001). Scale and species richness: towards a general, hierarchical theory of species diversity. Journal of Biogeography 28: 453-470. Retrived from https://doi.org/10.1046/j.1365-2699.2001.00563.x
Wolde Mekuria, Veldkamp E, Mesfin, T., and Roland, O. (2010). Economic valuation of land restoration: the case of exclosures established on communal grazing lands in Tigray, Ethiopia. Land Degradation and Development 22: 334-344. Retrived from https://doi.org/10.1002/ldr.1001
Wolde, M., Veldkamp, E., Mitiku, H., Kindeya, G., Muys, B., and Nyssen, J. (2009). Effectiveness of exclosures to control soil erosion and local community perception on soil erosion in Tigray, Ethiopia. African Journal of Agricultural Research 4: 365-377.
Yayneshet, T., Eik, L.O. and Moe, S.R. (2009). The effects of exclosures in restoring degraded semi-arid vegetation in communal grazing lands in northern Ethiopia. Journal of Arid Environments 73(5): 542-549. Retrived from https://doi.org/10.1016/j.jaridenv.2008.12.002
Zenebe, G. (2007). Household fuel consumption and resource use in rural-urban Ethiopia. Ph.D. Dissertation. Wageningen University. The Netherlands. ISBN: 978-90-8504-745-2.
Zerihun, W. (1999). Forests in the vegetation types of Ethiopia and their status in the geographical context. In: proceedings of the national forest genetic resources conservation strategy development workshop (Edwards, S., Abebe Demissie, Taye Bekele and Haase, G. (eds.) June 21-22, 1999, Addis Ababa, Ethiopia.1- 39pp.
Zhang, P., Li, L., Pan, G., and Ren, J. (2006). Soil quality changes in land degradation as indicated by soil chemical, biochemical and microbiological properties in a karst area of southwest Guizhou, China. Environmental Geology 51: 609-619. Retrived from https://doi.org/10.1007/s00254-006-0356-4
Fekadu, G., Teshome, S., and Ensermu, K. (2012). Structure and regeneration status of Komto Afromontane moist forest, East Wollega Zone, west Ethiopia. Journal of Forestry Research 23: 205-216. Retrived from https://doi.org/10.1007/s11676-012-0242-8.
 This work is licensed under a: Creative Commons Attribution 4.0 International License
© Granthaalayah 2014-2021. All Rights Reserved.