
GROUNDWATER QUALITY IN BIRATNAGAR OF MORANG DISTRICT, NEPAL
Abstract
A study was conducted to assess the groundwater quality in Biratnagar of Morang district of Nepal on the basis of some important physicochemical and microbiological analysis. During the study, the elevated value of turbidity ranged from 2.1±2.80 NTU (ward no. 8) to 81.46±44.28 NTU (ward no. 10), free-carbondioxide (FCO2) ranged from 12±2.45 mg /L (ward no. 21) to 17.2±3.03 mg/L (ward no. 8), arsenic ranged from nil (ward no. 3) to 0.17±0.21 mg /L (ward no. 1), iron (Fe) ranged from 0.45 mg/L (ward no. 7) to 3.67 mg/L (ward no. 4), manganese (Mn), ranged from 0.45 mg/L (ward no. 7) to 5.99 mg/L (ward no. 16) and fecal coliform bacteria were found positive in 10 wards (ward nos. 2, 3, 4, 9, 10, 11,14,15,20 and 21) constituting 45.45% of the total samples ranging from 3 to 25 MPN/100 ml . Out of the total analyzed samples, turbidity in 78 samples (70.90%), FCO2, Fe, and Mn in all samples (100%) and arsenic in 37 water samples (33.64 %) were crossed the permissible limit of WHO guideline. However, the value of pH, EC, DO, TH, PO4-P, NO3 -N, Cd, Zn, and Pb were below the WHO guideline value. The status of fluoride was below detectable level in all the analyzed groundwater samples.
Keywords
Groundwater, Physicochemical Parameters, Arsenic, Fecal Coliform, Nepal
INTRODUCTION
Groundwater is an important source of fresh water for human consumption, irrigation and industrial use in many countries of the world. However, residential, industrial, commercial, agricultural and other anthropogenic activities together with natural conditions often lead to a deterioration in groundwater quality (Nair, Rajaveni, Schneider, & Elango, 2015). In twenty-first century, humanity is facing the major problems related to water quality issues (UN Educ. Sci. Cult. Organ. (UNESCO, 2009) . Good quality of drinking water is very crucial for life. Rapidly increasing human population and their expectations increase the demand on exploitation of existing resources including water (Chowdhury, 2013). Groundwater has been estimated to provide almost half of all drinking water worldwide with 2.5 billion people depending solely on this resource to satisfy their daily needs for water ( (UNESCO, 2012) ). The Escherichia coli are the only real indicator of fecal contamination in groundwater as they are of intestinal origin and found in faces (WHO, 2011)
Anthropogenic pollutants that contaminate the water resources are categorized into two types; point sources and non-point (diffuse) sources. Point sources are industrial premises, towns, agricultural installations, manure storage, and landfills whereas non-point (diffuse) sources consist of leaching of nitrates and pesticides into surface and ground water as a result of rainfall, soil infiltration, and surface run off from agricultural land. These sources can cause significant variation in the contamination level of water over time (Fawell & Nieuwenhuijsen, 2003).
According to Susan Murcott, MIT, USA, in Nepal, near about 44, 000 children under the age of 5 die every year from water borne diseases. About 67% of children in Nepal are under the threat of water-borne diseases (Net, 2001). Almost all the population of Terai including Biratnagar relies on groundwater for drinking, household uses, industrial purposes as well as irrigation and tube wells serve the major source of drinking water. In Nepal, groundwater is at risk of contamination mostly from pathogenic bacteria, pesticides, nitrate and industrial effluents due to sewage and application of inorganic fertilizers and pesticide spray in agricultural activities (Jacobson, 1996). About 0.5 million of villagers in Terai region are at the risk of arsenic poisoning (Tandukar, Bhattacharya, & Mukherjee, 2001) and in Nepal, more than 11 million people are believed to be exposed to as contamination (Shrestha et al., 2003). Elevated levels of turbidity, free-carbondioxide, arsenic, iron, manganese as well as fecal colliform has been reported from Biratnagar (Das & Choudhary, 2018).
In this study, the groundwater quality of Biratnagar city was evaluated for drinking purpose and examined the level of pollutants in groundwater aquifer. For which physicochemical parameters such as pH, turbidity, electrical conductivity (EC), dissolved oxygen (DO), free-carbondioxide (FCO2), bicarbonate (HCO3), total hardness (TH), phosphate (PO4-P), nitrate-N (NO3-N), arsenic (As), and fluoride (Fl), Fe, Mn, Cd, Zn, and Pb as well as microbiological examination for total fecal coliform bacteria were measured.
MATERIALS AND METHODS
SITE DESCRIPTION
Nepal, a small and landlocked country, ranged from the highest peak in the world to the plains of the Terai which along the slopes of the Himalaya between China and India with an area of 147 181 km2 being 800 km from east to west, and from 144 km to 240 km north to south, between 80 0 – 88 0 E and 260 - 310 N. The country is bordered by India to the East, South and West and China to the North. The elevation ranges from 66m to 8848m above sea level. The population of Biratnagar was 204,949 (Census, 2011). Nepal consists of seven physiographic divisions from south to north: Terai, Siwalik Hills, Mahabharat ‘Lek’ (mountain range), Midlands, Himalayas, Inner Himalayas, and Tibetan marginal mountains (Hagen, 1998).
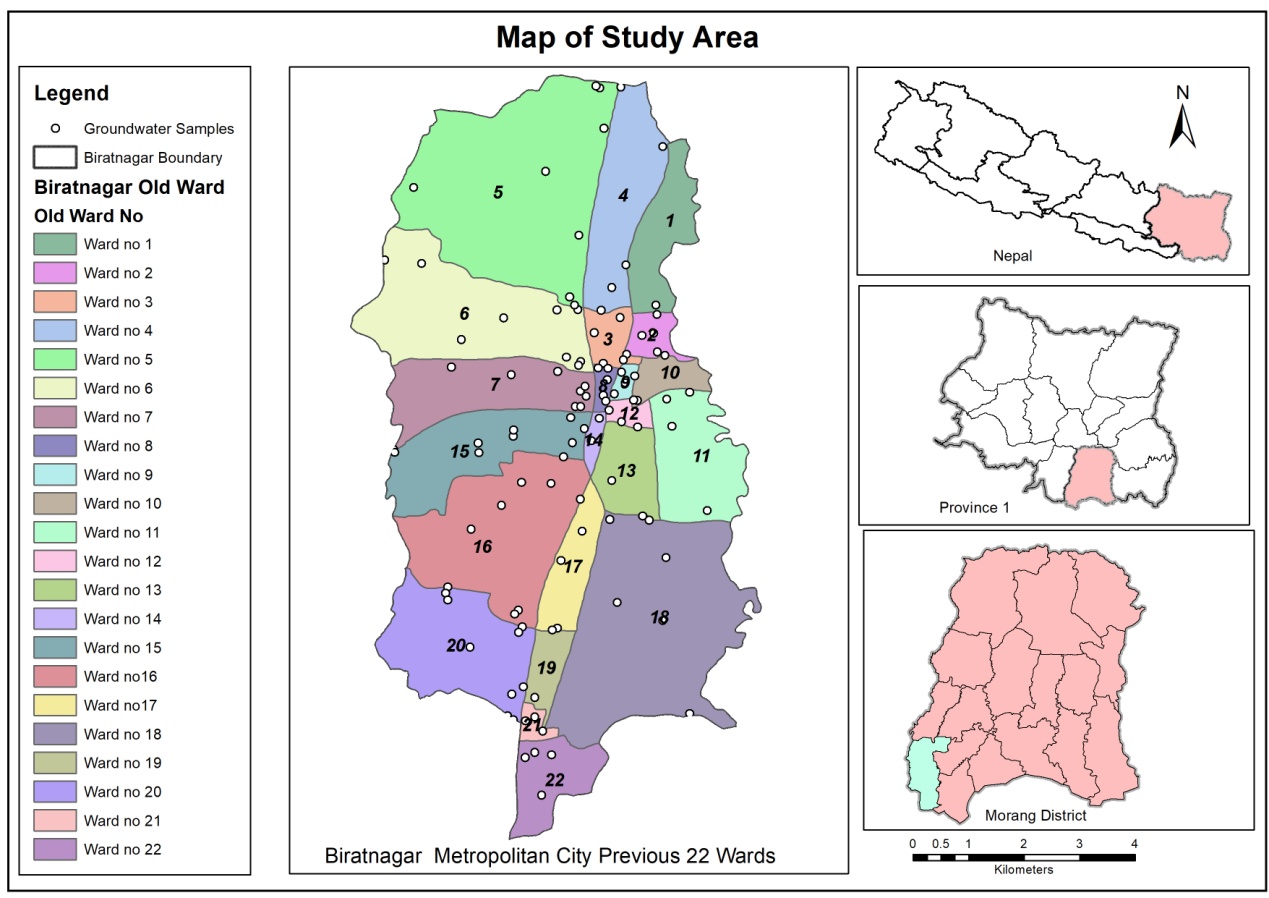
Biratnagar city deceives in the plain area of Morag district of eastern Nepal (Figure 1 ). The city is situated in the south-west corner of Morang district at 26° 23’ N - 26° 30’N latitudes and 87° 14’ - 87°18’ E longitudes. The city is bordered by Kesalia River in the west and north, Singhiya River in east and Jogbani, (Araria district of Bihar, India) in south. Biratnagar is an industrial powerhouse of Nepal with many industries located in and around its suburbs which has traditionally been an agricultural hub and is home to many agriculture-based industries. The city comprises of 22 wards and most of the people living in these wards depend on ground water sources i.e., shallow and deep tube wells for domestic purposes including drinking and industrial purposes (Das et al., 2018).
SAMPLING METHOD
Groundwater samples from different sampling points in 22 wards (5 from each ward) of Biratnagar city were collected between 8:00 AM to 11:00 AM. Samples were collected from 110 representative tube wells from investigated area during post-monsoon 2016 (October to December). Geo-coordinates of the groundwater sources selected for study were recorded with the help of Global Positioning System (GPS) Etrex-20. Before the collection of samples, polythene bottles were cleaned thoroughly by distilled water for several times and purged three times by groundwater sources. For the analysis of total coliform bacteria, bottles were sterilized in an autoclave at 1210C and 15 LBS pressure for 15 min. Finally, the collected samples were clearly labeled and stored in a portable ice box and transported to the laboratory for analysis. Thus, collected samples were analyzed for physicochemical parameters such as temperature, pH, turbidity, electrical conductivity (EC), dissolved oxygen (DO), free-carbondioxide (FCO2), bicarbonate (HCO3), total hardness (TH), phosphate (PO4-P), nitrate-N (NO3-N), arsenic (As), and fluoride (Fl), iron (Fe), manganese (Mn), Cadmium (Cd), Zinc (Zn) and lead (Pb) and microbiological examination. For the microbiological analysis, groundwater was collected aseptically in broad mouth sterilized glass containers and cultured in specific culture media and temperature in the laboratory within 6 hours. The available fecal coliform was determined by the method described by (Apha, 2005) .
SAMPLE ANALYSIS
Parameters like arsenic, fluoride, temperature, pH, dissolved oxygen, free-carbon dioxide and conductivity were determined on the spot while the rest of the parameters were determined in the laboratory (University Department of Botany, Environmental Biology Research Laboratory, Tilka Manjhi Bhagalpur University, Bhagalpur - 812 007, Bihar, India). The temperature, pH and EC were measured using a multi-parameter water quality monitoring instrument (HANNA), dissolved Oxygen (DO), was measured by modified Winkler’s method also known as Alsterberg-azide modification method, free-carbondioxide (FCO2) and bicarbonate (HCO3), determined by titrating the 100 ml of sample water against N/50 sulphuric acid solution upto the pH 8.3. Phenolphthalein was used as an indicator and value was expressed in mg/L. total hardness (TH) was determined by EDTA (Ethylene-diamine tetra acetic acid) titrimetic method (Apha, 2005) , phosphate (PO4-P) was determined by using stannous chloride method described in (Apha, 2005) , nitrate-N (NO3-N) was determined by phenol-disulphonic acid method spectrophotometrically (K & K., 1986). Turbidity was measured by Digital Nephelo Turbidity meter-132(Systronic) and the result was expressed in NTU (Nephelo Turbidity Unit).
For arsenic, the stagnant groundwater particularly in hand pumps was removed by operating the hand pump for ten minutes. Arsenic was determined by colorimetric method with test strips and reagent MQuant™ with the help of Arsenic Test Kit (Merck, Calalogue No. 1.17927.0001). The reaction vessel was filled with sample to the 60 ml mark. The contents of one of the reagents As-1 (potassium permanganate), reagent As-2 (Malonic acid) and reagent As-3(zinc powder, zinc dust stabilized, Sodium tungstate) were added to the reaction vessel. Cap was immediately attached with the test strip inserted to the reaction vessel and swirled to mix. Mixture was allowed to react for 20 minutes and the reaction vessel swirled twice during the reaction period. Test strip was removed, briefly dipped into distilled water and immediately the developed colour was compared with the chart on the strip bottle. The colour change was equivalent to arsenic content in sample water. It gives result in ppb (parts per billion) which was later converted into mg/L. Fluoride was determined using the Water Testing Kit (Nice Chemical Pvt. Ltd. Cochin-682024; C.No. W25535). The test tube was filled with 5 ml of water sample and to it 5 drops of Fluoride reagent-1(1, 8-Dihydroxy-2-(4 sulfophenylazo) naphthalene-3,6- disulfonic acid) was added and shaken well. The colour that formed was compared with the Fluoride Colour Chart given in the test kit. The value was expressed in mg/L.
For the heavy metal (Fe, Mn, Cd, Zn and Pb) analysis, the groundwater samples (only from 5 representative wards) were collected following the protocol (Apha, 2005) . The groundwater samples were collected in an air tight plastic bottle (washed with concentrated 50% Nitric acid (HNO3) and rinsed with distilled water). The collected water samples were filtered through Whatman no. 42 filter paper. Now the samples were preserved by acidifying by conc. HNO3 (1:1) to reduce the pH at 2 in order to minimize the losses by adsorption of metal ions on the vessels or on the suspended particles. These preserved water samples were kept for digestion.
A 50 ml of preserved sample water was transferred to digestion flask. To this 5 ml of conc. HNO3 was added and a few boiling chips were also added in the flask. It was now evaporated gently on a hot plate inside the digestion chamber to the lowest possible volume (10-20 ml), a point before precipitation occurred. The heating was continued adding conc. HNO3 (time taken for complete digestion approximately 6 hrs), finally a light-coloured clear solution obtained after digestion. The flask wall was washed down with double distilled water and the digested solution was filtered through Whatman No. 42 filter paper after proper cooling. For the determination of heavy metals the digested samples were transferred into airtight plastic bottles, properly sealed and kept for further analysis. After digestion, samples were taken to the Graphite Furnace Atomic Absorption Spectrophotometer (Perkin-Elmer Analyst 700). Multi element Perkin-Elmer standard solutions were used for the estimation of trace metals.
Fecal coliform bacteria were examined by membrane filtration method. The samples were filtered by using sterile filter paper with pore size of 0.45 μm with the help of vacuum section and incubated at 370C for 24-48 h in m-endo agar media. After that, fecal coliform bacteria were enumerated by counting the colonies following the (Apha, 2005) . The result was tabulated and compared to the given guidelines for drinking water ( (Who, 2008) ). The depth of the groundwater resources (tube wells) ranged from 20 to 200 feet.
RESULT AND DISCUSSION
A total of 110 groundwater samples were analyzed and calculated with their mean value and standard deviation have been depicted in Table 3; Table 2; Table 1 and Figure 4; Figure 3; Figure 2 .
PHYSICOCHEMICAL ANALYSIS
Groundwater temperature ranged from 20.030C ±0.19 (ward no. 22) to 21.940C ±43 (ward no. 1) and there was no WHO guideline value to be compared and also has not any significant health impact. The pH (concentration of H+ ion in the solution) value ranged from 7.48±0.18 (ward no. 4) to 7.66±0.11 (ward no. 10) and all the pH values were found within range of WHO guidelines value. The water with pH less than 6.5 may cause corrosion of metal pipes and pH higher than 8.0 may adversely affect the disinfectant process. Turbidity values ranged from 2.1±2.80 NTU (ward no. 8) to 81.46±44.28 NTU (ward no. 10). Turbidity values in 70.90% (N=78) water samples during the study period were found to be crossed the WHO guideline values of 5 NTU for drinking purposes. The turbidity could be attributed to the presence of organic matter pollution, other effluents, run-off with high suspended particles and heavy rainfall.
EC values ranged from 251.60±38.02 μS/cm (ward no. 20) to 806±195.50 μS/cm (ward no. 12). All the values were under the WHO guideline values of 1000 μS/cm stipulated for drinking and domestic water. The pure water contains fewer electrolytes and does not conduct electricity. Hence, any rise in the electrical conductivity of water indicates pollution with electrolytes (Eriksson, 1985). The ions dissolute in water make it conductive and such ions may be beneficial or harmful to the body ( (Amadi, Olasehinde, & Yisa, 2010) . The FCO2 value ranged from 12±2.45 mg /L (ward no. 21) to 17.2±3.03 mg/L (ward no. 8). All the results were crossed the WHO guideline value. Carbon dioxide and oxygen are biologically the most important dissolved gases. In groundwater the percolation of water through soil increases the FCO2 concentration (Gibson & Singer, 1969).
The value of dissolved oxygen ranged from 1.64±0.09 mg /L (ward no.15) to 2±0 mg/L (ward no. 11). All the values were under the WHO and BIS guideline value of 5 mg/L. In groundwater, dissolved oxygen is significant for chemical and hydro-geological aspects particularly related to the groundwater contamination ( (Rose & Long, 1988) . Bi-carbonate (HCO3 -) alkalinity or total alkalinity ranged from 43.2±19.21 mg /L (ward no. 13) to 184±71.27 mg/L (ward no. 10). The level bicarbonate is not recommended by WHO, however it is considered to be not more than 500 mg/L. It regulates the pH of water bodies and thereby regulates the quality of biota. Alkalinity in itself is not harmful to human beings. The water supplies with less than 100 mg/L are desirable for domestic use ( (21) Trivedi and Goel, 1986).TH ranged from 89±18.84 mg /L (ward no.1) to 168.8±32.67 mg/L (ward no. 15) and all the values were below the WHO.
The phosphate values ranged from 0.15±0.00 mg /L (ward no.13) to 0.18±0.02 mg /L (ward no. 22). All the values were below the WHO guideline. Nitrate-N (NO3 -N) ranged from 0.34±0.04 mg/L (ward no. 8) to 0.37±0.03 mg /L (ward no. 3). All the values were below the WHO guideline values. Excessive nitrate in drinking water can lead to methemoglobinemia (blue-baby syndrome) and stomach cancer ( (WHO, 2011) ). The value of arsenic (As) ranged from nil (ward no. 3) to 0.17±0.21 mg /L (ward no. 1).) and in 37 water samples (33.64 %) exceeded the WHO permissible limit of 0.01 mg/L. The arsenic toxicity to human health ranges from skin lesions to cancer of the brain, liver, kidney, and stomach (Smith et al., 1992). The status of fluoride was below detectable level in all the analyzed groundwater samples.
|
Wards |
Temp. |
PH |
Turb. |
E.C. |
DO |
FCO2 |
HCO- 3 |
T.H |
PO4 -P |
NO3 -N |
As |
Depth |
|
1 |
21.94±43 |
7.54±0.09 |
12.24±6.31 |
562.4±170.14 |
1.68±0.11 |
14.8±1.1 |
56.8±17.35 |
89±18.84 |
0.17±0.0 |
0.35±0.00 |
0.17±0.21 |
63±7.78 |
|
2 |
21.92±0.24 |
7.6±0.1 |
56.5±63.59 |
663.4±136.05 |
1.68±0.11 |
13.6±1.67 |
54±18.11 |
95.2±10.26 |
0.17±0.0 |
0.35±0.01 |
0.12±0.22 |
57.8±3.11 |
|
3 |
21.66±0.38 |
7.56±0.09 |
11.1±11.47 |
718.6±.65 |
1.72±0.11 |
14±2.45 |
59.2±1.80 |
121.2±46.34 |
0.17±0.01 |
0.37±0.03 |
0.00±0.01 |
63.4±7.57 |
|
4 |
21.82±0.30 |
7.48±0.18 |
22±18.96 |
648.2±248.43 |
1.8±0.2 |
14.8±1.10 |
58±20.5 |
112.4±15.45 |
0.16±0.00 |
0.37±0.04 |
0.02±0.02 |
50.8±7.01 |
|
5 |
21.26±0.23 |
7.58±0.084 |
22.1±16.58 |
521.8±81.61 |
1.88±0.11 |
14.4±2.30 |
52.8±15.79 |
128.8±24.84 |
0.17±0.00 |
0.35±0.01 |
0.2±0.01 |
56.2±6.30 |
|
6 |
21.96±0.34 |
7.56±0.09 |
34.76±30.51 |
389±115.93 |
1.68±0.11 |
14.4±1.67 |
110.8±41.27 |
109.6±55.1 |
0.17±0.01 |
0.35±0.00 |
0.04±0.04 |
54±10.25 |
|
7 |
22.2±0.158 |
7.52±0.045 |
7.68±7.27 |
527.6±197.54 |
1.88±0.179 |
16±2.83 |
120.8±53.75 |
133.6±37.98 |
0.17±0.00 |
0.35±0.00 |
0.02±0.01 |
56.6±7.89 |
|
8 |
22.24±0.11 |
7.56±0.089 |
2.1±2.80 |
538±296.38 |
1.72±0.11 |
17.2±3.03 |
138±65.51 |
116.4±76.71 |
0.17±0.00 |
0.35±0.00 |
0.03±0.03 |
65.2±7.85 |
|
9 |
21.18±0.11 |
7.56±0.09 |
28.94±27.36 |
645.4±78.309 |
1.68±0.11 |
17.6±3.58 |
152±61.40 |
151.6±63.43 |
0.171±0.0 |
0.37±0.01 |
0.110.22 |
69.6±17.62 |
|
10 |
21.24±0.11 |
7.66±0.11 |
81.46±44.28 |
756.2±141.78 |
1.68±0.179 |
13.2±2.28 |
57.6±17.74 |
125.2±18.31 |
0.17±0.00 |
0.34±0.04 |
0.01±0.01 |
83.4±65.80 |
|
11 |
21.4±0.12 |
7.56±0.09 |
2.1±2.80 |
467±232.30 |
2±0 |
13.6±1.67 |
39.6±18.99 |
176.4±84.22 |
0.17±0.00 |
0.36±0.01 |
0.00±0.01 |
84.2±62.00 |
|
12 |
21.36±0.05 |
7.58±0.08 |
23.6±41.65 |
578.4±296.88 |
1.68±0.18 |
15.2±0.84 |
63.6±6.99 |
124±48.35 |
0.17±0.01 |
0.36±0.01 |
0.11±0.22 |
54.8±20.57 |
|
13 |
21.24±0.15 |
7.52±0.04 |
5.62±4.28 |
836.8±88.21 |
1.92±0.18 |
14±1.41 |
54±17.44 |
168.4±37.77 |
0.15±0.00 |
0.35±0.00 |
0.00±0.01 |
59±4.18 |
|
14 |
21.3±0.16 |
7.52±0.045 |
4.94±5.83 |
612±198.04 |
1.720.18 |
15.2±2.28 |
62±8.83 |
148.8±40.34 |
0.15±0.00 |
0.35±0.00 |
0.01±0.01 |
56.2±5.45 |
|
15 |
21.12±0.08 |
7.56±0.05 |
20.92±23.71 |
803.8±268.59 |
1.64±0.09 |
14±2.45 |
44.8±17.70 |
168.8±32.67 |
0.15±0.1 |
0.36±0.00 |
0.01±0.01 |
53.6±7.16 |
|
16 |
20.68±0.40 |
7.52±0.08 |
25.94±23.47 |
306.4±106.49 |
1.72±0.18 |
16.4±0.89 |
24±3.74 |
142.8±70.85 |
0.15±0.00 |
0.35±0.01 |
0.04±0.04 |
56.6±13.46 |
|
17 |
20.6±0.2 |
7.58±0.08 |
12.66±19.15 |
297.6±69.02 |
1.76±0.10 |
14.4±0.89 |
26.4±13.22 |
90.8±19.05 |
0.15±0.00 |
0.35±0.01 |
0.02±0.01 |
61.8±17.95 |
|
18 |
20.72±0.15 |
7.54±0.09 |
24.46±26.51 |
358.2±213.29 |
1.92±0.18 |
12.8±2.28 |
28.8±12.13 |
94.8±52.96 |
0.16±0.01 |
0.36±0.01 |
0.00±0.01 |
66.6±16.21 |
|
19 |
20.6±0.07 |
7.58±0.13 |
19.48±14.91 |
460.4±94.15 |
1.68±0.11 |
14.8±1.10 |
30.4±11.44 |
120±35.36 |
0.17±0.02 |
0.35±0.00 |
0.01±0.01 |
46.6±5.50 |
|
20 |
20.34±0.30 |
7.54±0.09 |
13.46±12.92 |
374±209.83 |
1.8±0.2 |
14±1.41 |
28.8±9.44 |
104±53.67 |
0.16±0.01 |
0.35±0.01 |
0.01±0.00 |
59±6.52 |
|
21 |
20.08±0.11 |
7.66±0.15 |
13.76±13.26 |
417.8±264.34 |
1.76±0.22 |
12±2.45 |
38.4±7.92 |
112±52.63 |
0.16±0.01 |
0.35±0.00 |
0.01±0.01 |
50.4±11.41 |
|
22 |
20.03±0.19 |
7.53±0.05 |
10.1±35.48 |
534±231.45 |
1.73±0.14 |
16±2.61 |
22.67±12.84 |
123.33±57.9 |
0.18±0.02 |
0.35±0.00 |
0.02±0.02 |
53.2±11.34 |
|
Water Parameters |
Post-monsoon 2016 |
|
|
Minimum |
Maximum |
|
|
Temp. |
20.03±0.19(22) |
22.24±0.11(8) |
|
PH |
7.48±0.18(4) |
7.66±0.15(10,21) |
|
Turb. |
0.76±0.87(15) |
81.46±44.28(10) |
|
E.C. |
297.6±69.02(17) |
836.8±88.21(13) |
|
DO |
1.68±0.11(1) |
2±0(11) |
|
FCO2 |
12.0±0(10) |
14.8±2.28(9) |
|
HCO3 |
22.67±12.84(22) |
152±61.40(9) |
|
T.H. |
89±18.84(1) |
176.4±84.22 |
|
PO4-P |
0.15±0.00(13) |
0.18±0.02(22) |
|
NO3-N |
0.34±0.04(10) |
0.37±0.01(9) |
|
As |
0.00±0.01(3) |
0.17±0.21(1) |
|
No. of Sample/ Ward No. |
Post-monsoon-2016 |
||||
|
|
Fe |
Mn |
Cd |
Zn |
Pb |
|
1(4) |
3.67 |
2.55 |
0.0001 |
0.07 |
0.005 |
|
2(7) |
0.45 |
0.45 |
0.0001 |
0.006 |
0.005 |
|
3(10) |
0.97 |
0.89 |
0.0001 |
0.006 |
0.005 |
|
4(16) |
0.85 |
5.99 |
0.0001 |
0.006 |
0.005 |
|
5(18) |
0.66 |
2.45 |
0.0001 |
0.6 |
0.005 |


The values of iron ranged from 0.45 mg/L (ward no. 7) to 3.67 mg/L (ward no. 4) and were beyond the WHO permissible limit of 0.3 mg/L. The values of manganese ranged from 0.45 mg/L (ward no. 7) to 5.99 mg/L (ward no. 16) and were beyond the WHO permissible limit of 0.2 mg/L. The levels of cadmium and lead were found to be constant at 0.0001 mg/L and 0.005 mg/L respectively, which were below the WHO permissible limit of 0.003 mg/L. The values of zinc ranged from 0.005 mg/L to 0.7 mg/L and were below the WHO permissible limit. Fecal coliform bacteria were found positive only in 10 wards (ward nos. 2, 3, 4, 9, 10, 11,14,15,20 and 21) constituting 45.45% of the total and ranging from 3 to 25 MPN/100 ml. The presence of total coliform in groundwater sources is an indication of fecal contamination and is responsible for most water borne diseases such as meningitis, cholera and diarrhea as well as morbidity and mortality among children including acute renal failure and haemolytic anaemia in adults.
CONCLUSION
The groundwater quality of Biratnagar, Nepal was assessed the pollutants levels in aquifer by evaluating the physicochemical and microbiological status. During the study, the value of groundwater temperature, pH, electrical conductivity (EC), dissolved oxygen (DO), bicarbonate (HCO3), total hardness (TH), phosphate (PO4-P), nitrate (NO3 -N), cadmium, zinc, and lead were found to be below the WHO guideline value whereas in some groundwater sources, elevated level of turbidity, free-carbondioxide, arsenic, iron, manganese and fecal coliform were recorded. On the basis of the results obtained on physico-chemical including heavy metals and microbiological variables of groundwaters, it has been concluded that the groundwater sources with elevated levels of turbidity, free-carbondioxide, arsenic, iron, manganese and faecal coliform are unsuitable for drinking and other domestic purposes before proper treatment. People using water from these contaminated sources for drinking and other domestic purposes are susceptible to water-borne diseases.
RECOMMENDATION
From the foregoing observations and discussions, it is evident that the quality of some evaluated groundwater sources in Biratnagar is unsuitable for drinking and domestic purposes. Therefore, it is strongly recommended to keep the groundwater sources at the safe distance from all the possible sources of contamination and to use for drinking only after proper treatments.
Hence for the welfare of the present population in and around the study area, the following suggestions are made to improve the quality of potable water.
-
Public awareness should be developed regarding the danger of arsenic in drinking water, the necessity of arsenic removal, role of better nutrition and available safe-water options.
-
Effluents of domestic, health posts and small-scale industries should be discharged into nearby rivers after conventional treatment.
-
The areas which were highly contaminated should switch on to alternate sources
-
Hand pump, shallow tube well and deep tube well should be located at a safe distance from all possible sources of contamination.
-
All unwanted pits filled with dirty water within a radius of 15m from hand pumps should be filled.
ACKNOWLEDGEMENT
The authors are thankful to the University Department of Botany,T. M. Bhagalpur University, Bhagalpur, Bihar (India), Department of Botany, Mahendra Morang Aadarsh Multiple Campus (Tribhuvan University), Biratnagar, Nepal and Nepal Environmental Service Centre for Biratnagar for providing laboratory facilities. We are thankful to Mr. Madan Kumar Khadka (Senior Scientific Officer/Under Secretary (Technical), Plant Research Centre, Ilam, Department of Plant Resources, Ministry of Forests and Environment) for generating GIS map of study area.
