
ANALYSIS OF VARIATIONS IN TREND IN NOVEL CORONAVIRUS DISEASE IN SOUTHERN TAMIL NADU, INDIA
Abstract
Corona Virus Disease (COVID) is the newly identified communicable disease which originally found in China first and its spread was found all over the world. The spread made a huge impact among people around the world. In this study, the variation of trends in novel COVID spread is determined in the southern region of Tamilnadu state of India. Tamilnadu ranks in the seventh position in the total population among the 29 states in India. This can be one of the reasons for the spread of the disease. In this study, the trend patterns in the spread of disease are determined from May to November for the year 2020 in southern districts of Tamilnadu. The results of the CUSUM test indicated that all the districts had a statistically significant step jump in June. The Mann-Kendall test indicated that there is an increasing trend in June in all the districts and decreasing trend in October and November. From the results, it is suggested that the first phase vaccination can be implemented in Madurai, Virudhunagar, Kanyakumari and Thoothukudi districts.
Keywords
COVID 19, Tamilnadu, CUSUM, Trend Analysis
INTRODUCTION
The Corona Virus Disease (COVID) has been declared as a pandemic by World Health Organization on March 11, 2020. The severity of the spread has been observed in all the countries across the globe (Murugesan, Karuppannan, Mengistie, Ranganathan, & Gopalakrishnan, 2020; Sarkar, Khajanchi, & Nieto, 2020). The spread of the disease from one person to another has increased large in numbers through sneezes and coughs from the infected persons and become more unpredictable in later days (Tomar & Gupta, 2020). Governments in all the countries have adopted many mitigation measures such as lockdowns, social distancing, work on a shift basis, shut down of educational institutions and so on to reduce the spread but it doesn’t keep control until November 2020. Most of the people got affected by the deadly virus by direct contact with the affected people. However, the number of deaths in quite different in numbers according to the mitigation measures adopted by the particular government of the country, health care facilities, land area and demography (Bag, Ghosh, Biswas, & Chatterjee, 2020). It is also said that aged people and people with cancer, diabetics, respiratory diseases, cardiovascular diseases have more chances of high health risk (Kumar, Kumar, Christopher, & Doss, 2020).
The manufacturing of COVID vaccine is almost done but its implementation will be at the starting of 2021 after discussing with the health care officials and preliminary test results. It has to be noted that if the vaccine when enters into the markets cannot be supplied to all the people around the world. The preparation of the medicine requires time but the spread of the disease has to be in control. Hence the first immediate usage of the vaccine has to be implemented to the people where a large number of people got affected and the spread of the disease is more. Furthermore, to identify the area of COVID spread, an alternative solution such as trend pattern detection is needed. The trend patterns of the spread are therefore identified in this study using trend analysis to detect the increasing or decreasing trend in the spread for the given area. In the view to attain the solution, this research adopts Mann-Kendall (MK) test to determine trend patterns of the spread. This study focussed on the southern districts of Tamilnadu for trend detection.
The manuscript is organized as follows: The study area and the data set used for the study is presented followed by the description of the statistical test such as CUSUM and MK. The change point analysis and trend analysis are determined in the next section. Finally, the conclusions are arrived. In the Introduction section, present clearly and briefly the problem investigated, with relevant references.
STUDY AREA AND DATASET USED
The southern districts of Tamilnadu such as Kanyakumari (CAPE), Tirunelveli (TEN), Tenkasi (TSI), Thoothukudi (TN), Virudhunagar (VPT), Ramanathapuram (RMD), Sivagangai (SVGA) and Madurai (MDU) were chosen for this study. The locations of these districts are represented in Figure 1 . In the eight districts, MDU and TN is connected with an international and domestic airport. Other districts are connected with railways and national/state highways. It is also found that a large number of people from CAPE and TEN districts are working in foreign countries like Abu Dhabi, Dubai, Oman and Sharjah.

This study adopts the total number of people affected by COVID 19 from May to November 2020, as the number of COVID cases starts to be countable in these districts from the month of May. District wise daily data is adopted from the Health and Welfare Department of Tamil Nadu and it is used for analysis.
METHODOLOGY
CUMULATIVE SUM TEST
The Cumulative Sum Test (CUSUM) is used to determine the significant changes in the trends of the given data set and to find the date/year in which the trend begins if it exists. This can be done using Equation (1). One common inference that can be arrived through the CUSUM test is determining the significant step jump in the data set (Sivapragasam, Balamurli, Deepak, Prakhar, & Muttil, 2013).

Where
xi = CUSUM value
n – sample size
- average
MANN-KENDAL TEST
Mann-Kendal Test (M-K) is a non-parametric test that is used to determine the trend in the given time series. M-K test is most widely used to detect the trends in the given data. The statistic value “S” is calculated by finding the number of positive direction and negative direction by the cumulative method as mentioned in Equation (2) and the pertaining conditions as given in Equation (3). Then the Variance (s) is computed from Equation (4) and the pertaining conditions as mentioned in Equation (5)

Where

Where n is the number of data


Some of the basic inferences that can be done through trend analysis are, the positive value of “Z” indicates an “increasing trend”, the negative value indicates “decreasing trend” and the insignificant value indicates “no trend” (Saravanan, Sivapragasam, Balamurali, & Priya, 2016).
RESULTS AND DISCUSSION
PRELIMINARY ANALYSIS
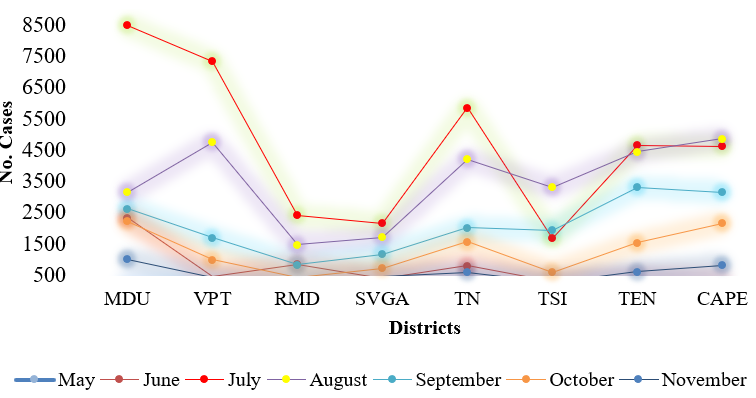
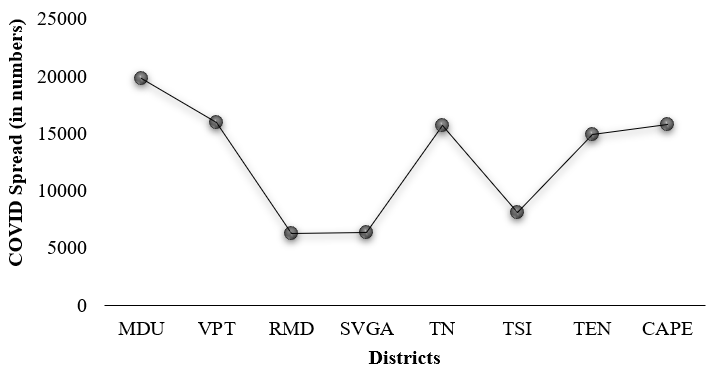
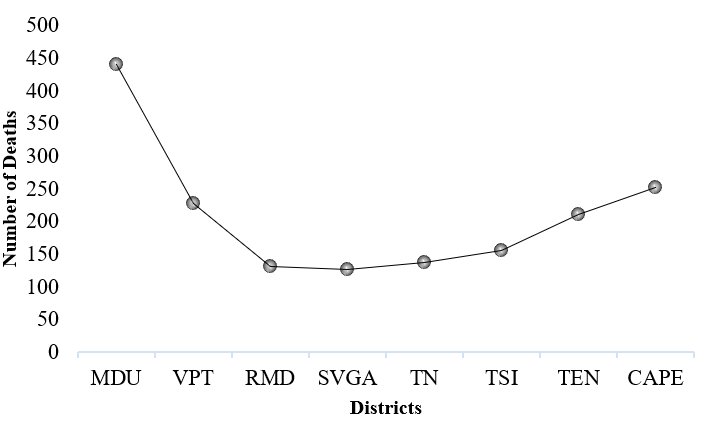
A preliminary analysis is done using the number of cases affected by COVID to know the total cases and the number of deaths in the selected regions. The spread from May to November for the eight districts is shown in Figure 9; Figure 8; Figure 7. It is clearly understood that the spread rate is equal in all the districts but the numbers vary for each district. It is found that MDU records a large number of COVID cases whereas the number of deaths is also high when compared to other districts. VPT records the second large number of cases but the total number of deaths is less when compared to CAPE where the number of cases is less than VPT. It can be also seen that all the districts have recorded the number of deaths above 100. The overall spread of COVID in RMD, SVGA and TSI districts is found to be less when compared with other districts but the total number of people got affected is more than 6000.
CHANGE-POINT ANALYSIS
The results for the change point analysis are shown in Table 1 . The date in which the change point happens is also denoted which indicates that the spread in later years is higher than the earlier years. In May, it can be found that the spread increased to higher numbers in the mid of the month in the districts of TEN and CAPE. In other districts, the change point has started only at the end of May and this indicates the spread has started to increase after May.
|
Month |
District |
Maximum Deviation |
Date of Change |
Significance at α<0.01 |
|
|
MDU |
12 |
14-11-2020 |
Significant (α<0.01) |
|
SVGV |
7 |
13-11-2020 |
Significant (α <0.1) |
|
|
VPT |
4 |
30-11-2020 |
Insignificant (α=0.10) |
|
|
November |
RMD |
6 |
08-11-2020 |
Insignificant (α=0.10) |
|
|
TSI |
10 |
20-11-2020 |
Significant (α<0.01) |
|
TN |
11 |
13-11-2020 |
Significant (α<0.01) |
|
|
TEN |
8 |
14-11-2020 |
Significant (α <0.05) |
|
|
CAPE |
10 |
16-11-2020 |
Significant (α<0.01) |
|
|
|
MDU |
12 |
18-10-2020 |
Significant (α<0.01) |
|
SVGV |
11 |
19-10-2020 |
Significant (α<0.01) |
|
|
VPT |
10 |
20-10-2020 |
Significant (α<0.01) |
|
|
October |
RMD |
12 |
16-10-2020 |
Significant (α<0.01) |
|
|
TSI |
11 |
19-10-2020 |
Significant (α<0.01) |
|
TN |
9 |
13-10-2020 |
Significant (α <0.05) |
|
|
TEN |
14 |
16-10-2020 |
Significant (α<0.01) |
|
|
CAPE |
15 |
15-10-2020 |
Significant (α<0.01) |
|
|
|
MDU |
6 |
08-09-2020 |
Insignificant (α=0.10) |
|
SVGV |
4 |
12-09-2020 |
Insignificant (α=0.10) |
|
|
VPT |
6 |
20-09-2020 |
Insignificant (α=0.10) |
|
|
September |
RMD |
9 |
19-09-2020 |
Significant (α<0.01) |
|
|
TSI |
5 |
21-09-2020 |
Insignificant (α 0.10) |
|
TN |
7 |
21-09-2020 |
Significant (α <0.1) |
|
|
TEN |
8 |
16-09-2020 |
Significant (α <0.05) |
|
|
CAPE |
8 |
20-09-2020 |
Significant (α <0.05) |
|
|
|
MDU |
5 |
27-08-2020 |
Insignificant (α=0.10) |
|
SVGV |
8 |
14-08-2020 |
Significant (α<0.05) |
|
|
VPT |
6 |
20-08-2020 |
Insignificant (α=0.10) |
|
|
August |
RMD |
5 |
21-08-2020 |
Insignificant (α=0.10) |
|
|
TSI |
5 |
23-08-2020 |
Insignificant (α=0.10) |
|
TN |
12 |
12-08-2020 |
Significant (α<0.01) |
|
|
TEN |
3 |
09-08-2020 |
Insignificant (α=0.10) |
|
|
CAPE |
7 |
17-08-2020 |
Significant (α<0.1) |
|
|
|
MDU |
7 |
15-07-2020 |
Significant (α<0.1) |
|
SVGV |
9 |
13-07-2020 |
Significant (α<0.05) |
|
|
VPT |
10 |
20-07-2020 |
Significant (α<0.01) |
|
|
July |
RMD |
4 |
26-07-2020 |
Insignificant (α=0.10) |
|
|
TSI |
10 |
16-07-2020 |
Significant (α<0.01) |
|
TN |
11 |
19-07-2020 |
Significant (α<0.01) |
|
|
TEN |
10 |
22-07-2020 |
Significant (α<0.01) |
|
|
CAPE |
11 |
15-07-2020 |
Significant (α<0.01) |
|
|
|
MDU |
12 |
18-06-2020 |
Significant (α<0.01) |
|
SVGV |
11 |
11-06-2020 |
Significant (α<0.01) |
|
|
VPT |
12 |
14-06-2020 |
Significant (α<0.01) |
|
|
June |
RMD |
13 |
15-06-2020 |
Significant (α<0.01) |
|
|
TSI |
13 |
13-06-2020 |
Significant (α<0.01) |
|
TN |
10 |
16-06-2020 |
Significant (α<0.01) |
|
|
TEN |
11 |
11-06-2020 |
Significant (α<0.01) |
|
|
CAPE |
10 |
16-06-2020 |
Significant (α<0.01) |
|
|
|
MDU |
11 |
29-05-2020 |
Significant (α<0.01) |
|
SVGV |
19 |
29-05-2020 |
Significant (α<0.01) |
|
|
VPT |
5 |
29-05-2020 |
Insignificant (α=0.10) |
|
|
May |
RMD |
9 |
29-05-2020 |
Significant (α<0.05) |
|
|
TSI |
11 |
31-05-2020 |
Significant (α<0.01) |
|
TN |
12 |
14-05-2020 |
Significant (α<0.01) |
|
|
TEN |
11 |
13-05-2020 |
Significant (α<0.01) |
|
|
CAPE |
11 |
29-05-2020 |
Significant (α<0.01) |
RESULTS OF TREND ANALYSIS
The result of trend analysis is shown in Table 2 which shows the Z statistic, significant level and the type of trend for each month in all districts. The result indicates that in May three districts such as CAPE, TEN and TN show a raising trend as the spread started increasing but other districts indicate that there is no trend in the particular month. This doesn’t denote that this particular month has no COVID cases but the number of cases doesn’t increase to a larger extend. The spread is almost minimum in number. There is an increasing trend found in all districts in June and July which indicates that the spread is at a peak when compared with other months. There is a decreasing trend in October and November but the numbers don’t nearer to zero till November 2020. To implement vaccination in these districts a large number of COVID cases as well as the trend patterns have to be known. From the analysis, the first phase vaccination can be implemented in districts such as MDU, VPT, CAPE and TN which has a large number of COVID cases and the trend is only in decreasing stage. TEN, TSI, RMD, SVAG have fewer cases and the spread is also less in numbers so second phase vaccination can be implemented in these districts.
|
Month |
District |
S Score |
Standard Deviation |
Z Statistic |
Significance Level |
Trend |
|
|
MDU |
-204 |
56.05 |
-3.62 |
Significant (α<0.01) |
Decreasing |
|
SVGV |
-93 |
56.05 |
-1.64 |
Insignificant (α =0.10) |
No Trend |
|
|
VPT |
-76 |
56.05 |
-1.33 |
Insignificant (α =0.10) |
No Trend |
|
|
November |
RMD |
-108 |
56.05 |
-1.909 |
Significant (α < 0.1) |
Decreasing |
|
|
TSI |
90 |
56.05 |
1.58 |
Insignificant (α =0.10) |
No Trend |
|
TN |
-181 |
56.05 |
-3.21 |
Significant (α<0.01) |
Decreasing |
|
|
TEN |
-179 |
56.05 |
-3.17 |
Significant (α<0.01) |
Decreasing |
|
|
CAPE |
-207 |
56.05 |
-3.65 |
Significant (α<0.01) |
Decreasing |
|
|
|
MDU |
-262 |
58.83 |
-4.43 |
Significant (α<0.01) |
Decreasing |
|
SVGV |
-250 |
58.83 |
-4.23 |
Significant (α<0.01) |
Decreasing |
|
|
VPT |
-183 |
58.83 |
-3.09 |
Significant (α<0.01) |
Decreasing |
|
|
October |
RMD |
-213 |
58.83 |
-3.60 |
Significant (α<0.01) |
Decreasing |
|
|
TSI |
-256 |
58.83 |
-4.33 |
Significant (α<0.01) |
Decreasing |
|
TN |
-161 |
58.83 |
-2.71 |
Significant (α<0.01) |
Decreasing |
|
|
TEN |
-351 |
58.83 |
-5.94 |
Significant (α<0.01) |
Decreasing |
|
|
CAPE |
-375 |
58.53 |
-6.35 |
Significant (α<0.01) |
Decreasing |
|
|
|
MDU |
-94 |
56.05 |
-1.65 |
Significant (α <0.1) |
Decreasing |
|
SVGV |
3 |
56.05 |
0.03 |
Insignificant (α =0.10) |
No Trend |
|
|
VPT |
-157 |
56.05 |
-2.78 |
Significant (α<0.01) |
Decreasing |
|
|
September |
RMD |
-179 |
56.05 |
-3.17 |
Significant (α<0.01) |
Decreasing |
|
|
TSI |
-97 |
56.05 |
-1.71 |
Significant (<0.10) |
Decreasing |
|
TN |
-44 |
56.05 |
-0.76 |
Insignificant (α =0.10) |
No Trend |
|
|
TEN |
-172 |
56.05 |
-3.05 |
Significant (α<0.01) |
Decreasing |
|
|
CAPE |
-80 |
56.05 |
-1.409 |
Insignificant (α =0.10) |
No Trend |
|
|
|
MDU |
-85 |
58.83 |
-1.42 |
Insignificant (α =0.10) |
No Trend |
|
SVGV |
-177 |
58.83 |
-2.99 |
Significant (α<0.01) |
Decreasing |
|
|
VPT |
-183 |
58.83 |
-3.09 |
Significant (α<0.01) |
Decreasing |
|
|
August |
RMD |
-60 |
58.83 |
-1.00 |
Insignificant (α =0.10) |
No Trend |
|
|
TSI |
-98 |
58.83 |
-1.64 |
Significant (α <0.1) |
Decreasing |
|
TN |
-198 |
58.83 |
-3.34 |
Significant (α<0.01) |
Decreasing |
|
|
TEN |
-51 |
58.83 |
-0.85 |
Insignificant (α =0.10) |
No Trend |
|
|
CAPE |
-191 |
58.83 |
-3.22 |
Significant (α<0.01) |
Decreasing |
|
|
|
MDU |
-115 |
58.83 |
-1.93 |
Significant (α <0.1) |
Decreasing |
|
SVGV |
85 |
58.83 |
1.42 |
Insignificant (α =0.10) |
No Trend |
|
|
VPT |
275 |
58.83 |
4.65 |
Significant (α<0.01) |
Increasing |
|
|
July |
RMD |
-104 |
58.83 |
-1.75 |
Significant (α <0.1) |
Decreasing |
|
|
TSI |
192 |
58.83 |
3.24 |
Significant (α<0.01) |
Increasing |
|
TN |
267 |
58.83 |
4.52 |
Significant (α<0.01) |
Increasing |
|
|
TEN |
293 |
58.83 |
4.96 |
Significant (α<0.01) |
Increasing |
|
|
CAPE |
296 |
58.83 |
5.01 |
Significant (α<0.01) |
Increasing |
|
|
|
MDU |
361 |
56.05 |
6.42 |
Significant (α<0.01) |
Increasing |
|
SVGV |
287 |
56.05 |
5.10 |
Significant (α<0.01) |
Increasing |
|
|
VPT |
242 |
56.05 |
4.3 |
Significant (α<0.01) |
Increasing |
|
|
June |
RMD |
246 |
56.05 |
4.37 |
Significant (α<0.01) |
Increasing |
|
|
TSI |
210 |
56.05 |
3.72 |
Significant (α<0.01) |
Increasing |
|
TN |
152 |
56.05 |
2.69 |
Significant (α<0.01) |
Increasing |
|
|
TEN |
179 |
56.05 |
3.17 |
Significant (α<0.01) |
Increasing |
|
|
CAPE |
254 |
56.05 |
4.51 |
Significant (α<0.01) |
Increasing |
|
|
|
MDU |
29 |
58.83 |
0.47 |
Insignificant (α =0.10) |
No trend |
|
SVGV |
69 |
58.83 |
1.15 |
Insignificant (α =0.10) |
No trend |
|
|
VPT |
17 |
58.86 |
0.27 |
Insignificant (α =0.10) |
No trend |
|
|
May |
RMD |
89 |
58.83 |
1.49 |
Significant (α =0.10) |
No trend |
|
|
TSI |
-30 |
58.83 |
-0.49 |
Insignificant (α =0.10) |
No trend |
|
TN |
225 |
58.83 |
3.80 |
Significant (α<0.01) |
Increasing |
|
|
TEN |
144 |
58.83 |
2.43 |
Significant (α <0.05) |
Increasing |
|
|
CAPE |
100 |
58.83 |
1.68 |
Significant (α <0.1) |
Increasing |
CONCLUSIONS
In this study trend analysis is performed in COVID 19 data for about seven months using the Mann-Kendall test and the trend patterns are determined for the southern districts of Tamilnadu, India. It is observed that the spread of COVID started in the southern districts in May and there is a spread of the disease from July to mid of October. In November, the impact of the disease is found to be lower in numbers. However, the count doesn’t reach zero but the peak numbers decreased all over November. From the trend analysis, it is found that the first phase of vaccination can be given to four districts such as Madurai, Virudhunagar, Kanyakumari and Thoothukudi. Unless the government of the state and the nation made a severe attempt to mitigate the spread this couldn’t be possible.
