
|
|
|
|
RIVALRY AMONGST TOP-FIVE MAJOR AIRLINES IN THE U.S. MARKETSundaram Nataraja *1
|
|
|
|


Article Type: Research Article
Article Citation: Sundaram Nataraja, and Beau Grantham.
(2020). RIVALRY AMONGST TOP-FIVE MAJOR AIRLINES IN THE U.S. MARKET. International
Journal of Research -GRANTHAALAYAH, 8(6), 160-173. https://doi.org/10.29121/granthaalayah.v8.i7.2020.596
Received Date: 28 June 2020
Accepted Date: 29 July 2020
Keywords:
U.S. Airline Industry
Major Airlines
Market Share
Rivalry
Five Forces of Competition
Load Factor
Net Income
ABSTRACT
Understanding the economic characteristics of the U.S. airline industry, assessing the degree of competition/rivalry among the competing airline businesses in the U.S. airline industry, and (3) making recommendations to the airlines and to the consumers of air transportation are the primary objectives of this research study. The authors analyze the rivalry among major U.S. airlines operating in the domestic market using datasets extracted from Bureau of Transportation Statistics for operations during a 12-month period ending in May 2019. Amongst the 17 major U.S. airlines, whose annual operational revenue is over $1 billion, a set of top-five airlines has been identified using the percentage of their marketshare. The research findings indicate that these five major airlines have an intense rivalry in the U.S. domestic market in terms of number of markets served, number of departures made, number of passengers transported, amount of cargo carried, load factor, revenue and cost of operations, profit and loss, and net income earned. Hence, these airlines put pressure on one another and limit each other’s profit potential.
1. INTRODUCTION
An in-depth study on the historical perspective of air transportation in the United States affirms the phenomenal growth of the sector during the 40-year period between 1938 and 1978. The amazing growth of the industry during this period can be celebrated from both domestic and international standpoints.
To tell a few success stories of the developments happened in this important four decades, we can talk about the growth and increase in many areas of air transportation including authorization to new routes; expansion of air-route connectivity to many city pairs; entry of new airlines; growth-rate of air traffic; air carrier’s revenue; employment opportunities in the aviation, aerospace, and associated industries; technological developments including the evolution of propeller-driven aircraft to wide-body jumbo jets; and the quantum improvements in safety, speed, comfort, and overall conveniences for the users of air service (Wensveen, 2015).
The U.S. airline industry was regulated by the federal government in 1978. The next 40-year period followed by the deregulation, the U.S. airline industry has experienced significant and often surprising changes (Kling & Smith, 1995) including the demise and/or disappearance of well-established airline businesses (Gifford & Kudrle, 2017) such as Pan American Airways and Eastern Airlines in 1991, Trans World Airlines in 2001, Northwest Airlines in 2010, Continental Airlines in 2012, US Airways in 2015, and Virgin America in 2018. The list of defunct airlines in the U.S. is very long and some unofficial data indicate that at least 550 airlines had failed so far. While describing the financial record of the airline industry post-regulation as dismal, Borenstein (2011) articulates, “The industry lost $10 billion from 1979 to 1989, made $5 billion in the 1990s and lost $54 billion from 2000 to 2009. Additionally, the dominant issues faced by U.S. airlines during this period were cost efficiency, operating profitability, and competitive behavior (Belobaba et al. 2009). Along these lines, it can be understood that every commercial airline operating in the U.S. airline industry has been struggling and striving for its survival, growth, and profitability.
Airlines are grouped in many different ways including their size and what they transport. The most common classifications for airlines are the major passenger airlines, air freight carriers, and regional or commuter carriers. Kling and Smith (1995) articulate:
Identifying strategic groups within an industry is highly desirable from both a qualitative and quantitative perspective. It is easier to psychologically to understand the competitive dynamics of an industry if we can identify three or four groups rather than having to characterize each firm separately. Furthermore, by dividing the airline industry into meaningful groups, performance and operating statistics can be separated and analyzed more effectively. P. 27
As per the 2019 statistics published by the United States Department of Transportation (U.S. DOT) through its Bureau of Transportation Statistics, there are 17 major airlines in the U.S. market that provide services with annual operating revenue over $ 1 billion. These 17 major airlines can be grouped into three strategic groups such as (1) mainline air carriers providing scheduled passenger transportation services, (2) regional air carriers transporting passengers, and (3) cargo carriers that are providing purely freight only air carriage.
This study uses the “Five Forces Model of Competition” as Michael Porter described it in 1978 in his article published in Harvard Business Review. The Harvard Business School’s Institute for Strategy & Competitiveness (n. d.) explains, “The five forces is a framework for understanding the competitive forces at work in an industry, and which drive the way economic value is divided among industry actors” (p. 1). While considering the five forces framework to measure the degree of competition among the competing major U.S. airlines, the researchers have also paid attention to other views. Wilkinson (2013) states, “The intensity of rivalry among competitors in an industry refers to the extent to which firms within an industry put pressure on one another and limit each other’s profit potential” (p.1). This study examines Wilkinson’s point of view in order to assess the degree of competition/rivalry among competing for airline businesses in the U.S. airline industry. Since the events of 9/11 attacks, there have been several switch-ups in the top players in the airline industry. However, the emergence of five top passenger air carriers has been the most noticeable. In such a context, this article provides a scenario in which the five major U.S. airlines are operating under the oligopolistic state of the industry today.
Primarily three objectives drive this study i.e., (1) understanding the economic characteristics of the U.S. airline industry, (2) assessing the degree of competition/rivalry among the competing airline businesses in the U.S. airline industry, and (3) making recommendations to the airlines and to the consumers of air transportation by analyzing the attractiveness, and the trends that would affect airlines industry competition in the future.
2. THEROTICAL FOUNDATIONS
2.1. U.S. AIRLINE INDUSTRY STRUCTURE
The five forces model of market competition provides the groundings for the U.S. airline industry structure. Porter describes intensity of rivalry is depending on the number of firms competing in a specific industry (Wilkinson, 2013). The structure of the U.S. airline industry is made up of three groups of air carriers (Chadwick, Jr. & Gorham, 2018). As per the Title 14, Code for Federal Regulations 241, Section 4 (14 C.F.R. 241 §04 - Air Carrier Groupings), all the air carriers operating in the U.S. market have been categorized as follows: (1) mainline airlines, (2) regional airlines (both (a) affiliated and (b) independent operators), (3) cargo carriers, (4) charter airlines, and (5) air taxis and tours carriers, air ambulances, and fleet of air crafts operated for and by U.S. Federal Government. In line with U.S. DOT’s C.F.R. 241 §04 Accounting and Reporting Directive No. 328, which has been made effective 01.01.2019, Table 2.1.1 provides the criteria for the U.S. DOT certificated air carrier groupings according to their annual operating gross revenue boundaries.
Table 2.1.1: The Structure of the U.S. Airline Industry – 2019
|
Grouping |
Criterion (Annual gross revenue) |
Number of Carrier |
|
Group III |
Over $1 billion |
17 |
|
Group II |
Over $100 million to $ 1 billion |
21 |
|
Group I* |
$100 million and under (further
divided under subgroups) |
|
|
Subgroups: |
|
|
|
Group I |
$20 million to $100 million |
13 |
|
Group I |
Under $20 million |
8 |
*Group I air carriers have been have been subdivided into two subgroups.
As shown in Table 2.1.1, the U.S. airline industry is filled with 17 major airlines (Group III) since their annual operating gross revenues have been reported to have more than $1 billion, 21 national air carriers (Group 2) as their annual operating gross revenues have been reported to have over $100 million to $1 billion, and 21 small carriers Group I since their annual operating gross revenues have been reported to have $100 million and under. Table 2.1.2 provides a list of 17 major airlines that are currently operated in the U.S. market.
Table 2.1.2: List of Major Airlines Operated in the U.S. Market – 2019
|
Mainline Carrier |
Regional Carrier |
Cargo Carrier |
|
Alaska Airlines |
Envoy Air (Affiliated) |
Atlas Air |
|
Allegiant Air |
Republic Airways (Affiliated) |
FedEx Express |
|
American Airlines |
SkyWest Airlines (Affiliated) |
Polar Air Cargo |
|
Frontier Airlines |
|
UPS Airlines |
|
Hawaiian Airlines |
|
|
|
JetBlue |
|
|
|
Southwest Airlines |
|
|
|
Spirit Airlines |
|
|
|
United Airlines |
|
|
Source: U.S. DOT’s C.F.R. 241 §04 Accounting and Reporting Directive No. 328.
As given in Table 2.1.2, there are 17 major airlines provide services in the U.S. market with annual operating revenue over $ 1 billion. Of which, 10 of them are mainline air carriers providing scheduled passenger transportation services, three are regional air carriers transporting passengers, and four others are providing purely freight-only services. The three regional carriers listed in Table 2.1.2 are the affiliated entities. Envoy Air is affiliated to American Airlines, Republic Airways is affiliated to Republic Airways Holdings, and SkyWest Airlines is affiliated to SkyWest Inc.
2.2. ECONOMIC CHARACTERISTIC OF THE U.S. AIRLINE INDUSTRY
Every airline has a vested interest in providing the best possible services to its customers. The best services rendered to the customers would certainly yield in building-up a loyalty toward a specific brand and hence guarantee repeat business. When a customer returns to fly with a specific airline based on the perceived quality of service received in the previous trip, that airline starts to build-on its brand loyalty (Aaker, 1991; Chen & Tsang, 2010).
Although 10 mainline air carriers are operating in the market, as of 2019 only five airlines are controlling almost 74% of the U.S. airline industry marketshare. Troy Segal (2019) orchestrates that the U.S. airline industry today is arguably in an oligopolistic state since the market is controlled by a small group of airline businesses. Spicer (2018) articulates that an analysis conducted by economists at Compass Lexecon, one of the world's leading economic consulting firms, shows that the state of nationwide U.S. based airline competition has intensified in recent years. Also, Tang and Hsu (2016) and Jim Chappelow (2019) confirm that oligopoly is a market structure with a small number of firms, none of which can keep the others from having significant influence. Generally, there will be few sellers, a similar product, and a high obstacle to entry in an oligopolistic market structure. From this viewpoint, economists usually describe the U.S. certificated airline industry as closely approximating the oligopolistic market structure (Wensveen, 2015). Besides, operating in a very competitive space is good for the airline industry, and it’s good for consumers (Spicer, 2018). Figure 2.2.1 depicts the market share of the U.S. airline industry.
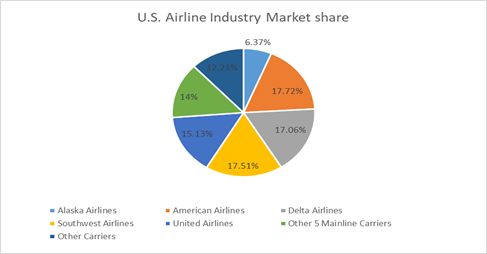
Figure 2.2.1: U.S. Airline Industry Market share. Source: Bureau of Statistics (2019).
Figure 2.2.1 illustrates the marketshare of the U.S. airline industry. It confirms that the top five mainline carriers dominate in the market with a total of 73.79%. Their marketshare can be noted from the breakdown of data such as Alaska Airlines (AS) 6.37%, American Airlines (AA) 17.72%, Delta Airlines (DL) 17.06%, Southwest Airlines (SW) 17.51%, and United Airlines (UA) 15.13%. The remaining five other mainline air carriers marketshare is 14% with a breakdown data as follows: Frontier Airlines 2.78%, Hawaiian Airlines 1.63%, JetBlue 5.56%, Spirit Airlines 4.03%, and Allegiant Air does not report any marketshare since it is operating for the leisure market only. At the same time, the remaining marketshare of 12.2% is shared by other carriers offering passenger transportation services.
2.3. Porter’s Five Forces Model
Porter's Five Forces Model a strategic tool developed in 1979 by Michael Porter from Harvard Business School. This model encapsulates the five marketing factors which affect the performance of a particular firm in a given industry. It has become the effective tool to measure the competitiveness of the market since its introduction in order to determine whether or not a firm can operate profitably in a competitive environment among the competing rival firms in a specific industry. Figure 2.3.1 illustrates the five forces as given in Porter’s Five Forces Model of Competition.
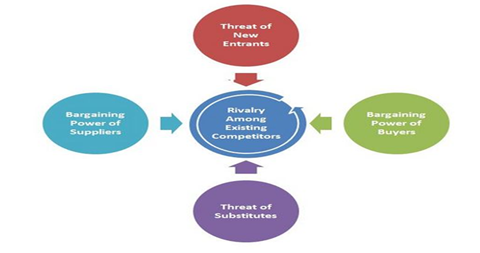
Figure 2.3.1: Porter’s Five Forces Model of Competition. Source: McNamara, G. (n.d.).
As shown in Figure 2.3.1, the five forces are (1) rivalry among existing competitors, (2) bargaining power of the buyers, (3) bargaining power of the suppliers, (4) threat of substitutes, and (5) threat of new entrants (barriers to entry).
2.3.1. RIVALRY AMONG COMPETING FIRMS
Porter’s five forces model of market competition describes if the airlines industry consists of numerous competitors then the rivalry among these airlines will be more intense. At the same time, if the competing airlines are of the equal size or closer marketshare, then the intensity of rivalry will increase. Also, it can be noted if the industry products are undifferentiated and the fixed costs are high then the competitive rivalry will be intense (Wilkinson, 2013).
According to 2018-2019 data from the US Bureau of Transportation Statistics, 73.79% of the total domestic airline marketshare belongs to the top five major airlines i.e., AS, AA, DL, SW, and UA. Figure 2.3.2 shows the marketshare and the close competition between these carriers, as well as their overall dominance over the US domestic market.

Figure 2.3.2: The Marketshare of the Major U.S. Airlines.
Data Source: Bureau of Transportation Statistics, 2019.
Figure 2.3.2 portrays how the U.S. airline industry is dominated by the top five major airlines. While it is imperative to view the profits and amount of passengers that these major carriers enplane in order to establish their relative dominance over the US market. It is just as important to analyze the pricing models, marketing strategies, and aggressive tendencies of these airlines in order to determine what differentiates these five airlines from other major carriers. Airlines primarily compete on price and service; however, to a lesser extent, they do compete on the frequency of flights, frequent-flyer programs, reliability of flights, and other amenities. Rivalry among competing airlines in the Low-Cost Carrier (LCC) market is moderate to strong. Borenstein (2011) states, “The financial results for legacy airlines and LCCs have improved substantially in 2010, and the industry seems likely to be closer to break-even on domestic operations” (p.233). In recent years, pressures for airlines to expand has somewhat eased as established carriers have stayed within their existing geographical areas of dominance, concentrating more on returning to profitability than expansion. However, there have been added stresses from low-cost carriers such as JetBlue, who has been in a recent state of expansion.
2.3.2. BARGAINING POWER OF CUSTOMERS
Before the Internet, the travel industry was linearly organized with three major components: suppliers (airlines, hotels, ferries, and car rental companies), intermediaries (Travel Agencies and Tour Operators), and the travelers. For leisure tourism, tour operators used to be mainly responsible for packaging and administrating services such as transport, accommodation, transfers, etc., together for lower prices. Meanwhile, travel agents were selling those packages or suppliers' products to travelers by using various Global Distribution Systems (Buhalis & Licata, 2002) and Computer Reservation Systems (CRS) such as Apollo, Galileo, Sabre, and Worldspan, etc. Therefore, suppliers used to have to pay both fees and commission to the intermediaries and technology companies that were helping them reach their target customers. Consumers now demand higher value and service from the suppliers of tourism products and the Internet provided a means of obtaining information on service quality and cost, and also allowed the purchasing of products and services to take place instantly and interactively. All of these factors have made it possible for the typical traveler to obtain the best deal that fits their needs quickly and relatively easily.
2.3.3. BARGAINING POWER OF SUPPLIERS
The aircraft manufacturing industry is dominated worldwide by Boeing and Airbus, together accounting for 99% of large aircraft orders globally, which means that the aircraft manufacturers hold most of the bargaining power over the airlines that are purchasing their aircraft. Air travel is also a fuel-intensive industry, thus making the airlines very sensitive to swings in fuel prices offered by fuel suppliers. Though generally, fuel suppliers have little bargaining power because they are numerous and their product is a commodity. Reich (2014) states that business travelers seek convenience and leisure travelers seek a stress-free, enjoyable journey; however, there is only a small premium that either will pay for these perks. Therefore, the suppliers have less advantage and opportunities at both ends.
While aircraft manufacturers and fuel providers are the distinct suppliers within the airline industry, several others worth mentioning as well. For example, aircraft lessors act as intermediates between aircraft manufacturers and operators by renting airplanes for a commission. Although the lessors’ sector is a less concentrated sector than that of the aircraft manufacturers’ and it has a proportionally smaller amount of bargaining power (Moreira, 2014). Another supplier of services within the airline industry includes companies that operate Global Distribution Systems (GDSs) and CRS. GDSs and CRSs are systems that are used to connect customers with the ideal flight and travel services that they are in search of. With the expansion of internet sales of flights, the bargaining power of GDS and CRS suppliers has shifted towards travel sites that can cross-reference fare prices more quickly and efficiently than ever before in order to get the customer, the best deal possible.
2.3.4. AVAILABILITY OF SUBSTITUTES
Up until recent years, the air transport industry had been more frequently a substitute for other transport means than the opposite. In the US, the decline of the bus transportation industry was distinctly related to the arrival of the low-cost carriers in this same market. However, the inception of modern train services in Western Europe has played the opposite role and is beginning to take over a large portion of the low cost, short-haul flight market in this sector (Moreira, 2014). However, it does not seem as though this threat is as present in other markets around the world, and especially not in the US travel market. Which is because travel distances are typically much bigger, and government entities often restrict available capital for investments in new transportation systems.
2.3.5. THREAT OF NEW ENTRANTS (BARRIERS TO ENTRY)
The threat of new entrants in the U.S. airline industry is reasonably low, which is primarily due to the high entry and exit barriers within the industry. These barriers often dissuade new entrants from entering the industry because of the high expansion costs and the associated risks. Aside from requiring much capital to enter into this market, there are many regulatory hurdles that an airline would have to jump through as well. In order to compete with the amount of marketshare hold of these top five major airlines (AS, AA, DL, SW, and UA), an airline would need to establish and acquire new domestic and international routes, purchase millions of dollars in aircraft and equipment, and hire on more staff. This being the case, only an established international carrier would be able to enter into competition with these five dominant airlines. A customer’s brand loyalty to previously flown or established airlines is another factor that reduces the possibility of new entrants. Each of these majors invests vast amounts of money into brand awareness and customer retention, which would make it highly unlikely for any new players to emerge into this market and challenge these airlines. When a new entrant shows up and tries to cut costs on a route, officials in the airline industry do tend to respond to the threat of entry. For example, if Sun Country Airlines began to threaten one of United’s routes, the airline would likely try to cut costs before United even started flying the route.
3. RESEARCH METHODOLOGY AND DATA ANALYSIS
3.1. RESEARCH METHODOLOGY
Since varied resources and distinctive capabilities are required for the successful operation of an airline, not all airlines will compete on the same basis in the U.S. airline industry (Kling & Smith, 1995). Therefore, an analysis of airline by airline performance should distinguish the degree of rivalry among the competing airlines in the U.S. market. Subsequent to identifying the dominant players of the U.S. airline industry based on their market share, this study uses a case-study methodology to study their performance from an individual airline basis, case-by-case. Yin (1994) categorizes the case-studies into three types: (1) exploratory, (2) explanatory, and (3) descriptive. The exploratory case is for searching without first defining specific variables, the explanatory case is for searching after defining specific variables, and the descriptive case is for reporting on findings not related specific variables. Since the rivalry among the competing five major airlines in the U.S. airline industry is written with the intention of reporting the research findings that are not related to specific variables, this is called a descriptive case-study. Additionally, a case-study research methodology has opted for this study because it facilitates an in-depth understanding of a current complex issue and strengthens previous knowledge, while it is providing opportunities for further research (Johnson, 2009).
3.2. DATA ANALYSIS
The authors analyze the rivalry among major U.S. airlines operating in the domestic market using datasets extracted from Bureau of Transportation Statistics for operations during a 12-month period ending in May 2019. This analysis focuses on the five major U.S. passenger air carriers namely AS, AA, DL, SW, and UA. To standardize the analysis of (1) number of markets served, (2) number of departures made, (3) number of passengers carried, (4) the amount of cargo carried, (5) the load factor, (6) the revenue and cost of operations, (7) the profit and loss of these carriers, and (8) net income data will cover only the domestic operations of these carriers.
Since the certificated airlines operating in the U.S. airline industry are required to report their operational data to the U.S. Department of Transportation, the DOT publishes valid data pertaining to these top five major airlines via the Bureau of Transportation Statistics, therefore, there is no need to collect any new data for this study. The researchers have obtained the data from the Bureau’s website.
Figure 3.2.1 illustrates the content analysis of the rivalry among the competing top five airlines in the U.S. market:
|
Identifying the number of markets served by these top five major
airlines in the 12 months period ending May 2019 |
![]()
|
Collating the number of passengers and the amount of cargo carried
by these top five airlines in the 12 months period ending May 2019 |
![]()
|
Analyzing the number of departures made by these top five
airlines in the 12 months period ending May 2019 |
![]()
|
Analyzing the load factor of these top five airlines in the 12
months period ending May 2019 |
![]()
|
Analyzing the operating revenues earned, cost of operations,
profit/loss, and net income of these top five airlines in the 12 months
period ending May 2019 |
Figure 3.2.1: Content analysis of the top five airlines in the U.S. market.
Figure 3.2.1 provides a system to analyze the data pertinent to the rivalry among the competing top five airlines in the U.S. market. The authors attempt to measure the degree of rivalry amongst these five competing airlines through the statistical indicators such as tables, figures involving histograms and pie charts.
4. DISCUSSION
As the authors analyze the rivalry among major U.S. airlines operating in the domestic market using datasets extracted from Bureau of Transportation Statistics for operations during a 12-month period ending in May 2019, six sets of data are analyzed. The results of the analysis are based on: (1) number of markets served; (2) number of departures made; (3) number of passengers carried; (4) the amount of cargo carried; (5) the load factor; and (6) the revenue and cost of operations, profit and loss of these carriers, and net income.
4.1. NUMBER OF MARKETS SERVED
Graph 4.1.1 illustrates the number of markets served by these five airlines during the time period of 12 months ending in May 2019.
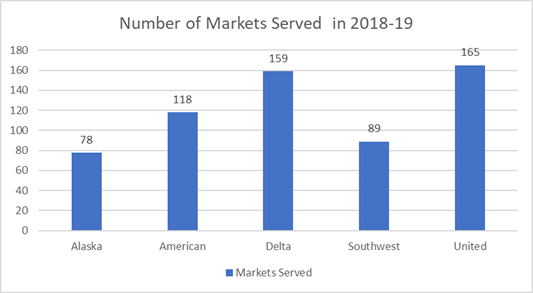
Graph 4.1.1: Number of Markets Served.
As it can be noted from Graph 4.1.1, United Airlines (UA) has served in 165 markets, which is the highest number of U.S. domestic markets served by these five competing airlines during the time period of 12 months ending in May 2019. UA is competing neck-to-neck with Delta Airlines (DL) as it can be seen that DL has served on 159 markets. Although UA has served on the highest number of markets, DL has recorded the highest load factor (86.9%) amongst the competing five major air carriers during this period. Additionally, American Airlines (AA) has incurred the highest cost of operation, which is $42,041 million despite the fact that AA has served only on 118 markets during this time period.
4.2. NUMBER OF DEPARTURES MADE
Pie Chart 4.2.1 provides the data for number of departures made by these five airlines during the time period of 12 months ending in May 2019.
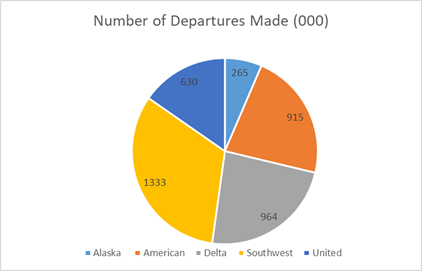
Pie Chart 4.2.1: Number of Departures Made.
The pie chart 4.2.1 shows that Southwest (SW) has made the
highest number of departures in the U.S. domestic market during the time period
of 12 months ending in May 2019, which is more than double the number of
departures of UA (SW made 1,333,000 departures whereas UA made only 630,000
departures). SW is competing very closely with AA and DL in terms of the number
of passengers carried. While UA has made only 47.3% of the number of departures
that SW has made in the U.S. domestic markets during this time, AA has carried
55.2% of the number passengers carried by SW during this time period. SW’s load
factor is 3% lower than DL despite the fact that SW made 28% more departures
than DL in the U.S. domestic markets during the same period of time.
4.3. NUMBER OF PASSENGERS CARRIED
Pie Chart 4.3.1 provides the data for number of passengers carried by these five airlines during the time period of 12 months ending in May 2019.
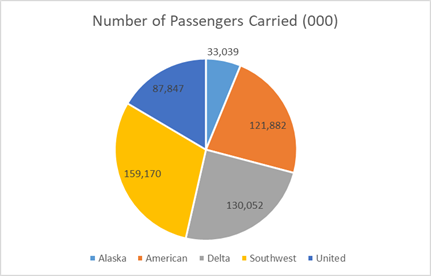
Pie Chart 4.3.1: Number of Passengers Carried.
The pie chart 4.3.1 shows that Southwest (SW) has carried the highest volume of passengers (159,170,000) in the U.S. domestic market during the time period of 12 months ending in May 2019. Although AA and DL have had closer marketshare (few decimal points higher or lower) with SW (AA marketshare: 17.7%; DL market share: 17.1%; and SW marketshare: 17.5%), SW has carried almost 30 million passengers more than what both AA and DL have transported during this period. Interestingly, SW has served only 89 markets whereas UA has served 165 markets in the U.S. domestic market during this time, which is 46% less than UA’s operations in terms of the number of markets served. At the same time, SW has transported 81% more passengers than UA during this period.
4.4. AMOUNT OF CARGO CARRIED
Pie Chart 4.4.1 provides the data for amount of cargo carried by these five airlines during the time period of 12 months ending in May 2019.

Pie Chart 4.4.1: Amount of Cargo Carried.
As it can be noted from the pie chart 4.4.1, Alaska Airlines (AS) and SW are the two out of the five competing major airlines in the U.S. market, who have transported the less amount of cargo during the time period of 12 months ending in May 2019. It could be the reason that both AS and SW are more of passenger transporters than cargo carriers.
AA, DL, and UA are in the same ballpark of carrying more than 400 m tons of cargo during this period. When analyzing the amount of cargo carried by these three (AA, DL, and UA) competing airlines, it can be noted that UA has carried the highest volume of cargo (473 m tons) during this period while UA has a lower marketshare (AA: 17.7%; DL: 17.1%; and UA: 15.1%) amongst these three (AA, DL, and UA) airlines.
4.5. LOAD FACTOR
The load factor of an airline is derived through dividing the revenue passenger miles (RPM) by available seat miles (ASM). Graph 4.5.1 illustrates the number of markets served by these five airlines during the time period of 12 months ending in May 2019.

The Graph 4.5.1 illustrates that DL has the highest load factor (86.9%) in the U.S. airline market. A high load factor indicates that an airline has full planes with most seats occupied by passengers, which in turn generates more revenues and hence, more profits. Along these lines, analysis has indicated that DL is the highest profit-making airline in the U.S. airline industry, please refer to section 4.6 of this paper. On the same token, both AA and UA also have comparatively higher load factors (AA: 85.8% and UA: 85.9%) in the U.S. domestic market. It should also be noted that SW has the lowest load factor (83.7%) although its market share is higher than AS, DL, and UA during this period.
4.6. REVENUE AND COST OF OPERATIONS
Graph 4.6.1 provides the financial data pertaining to the revenues earned and the cost of operations of these five airlines during the time period of 12 months ending in May 2019.

Graph 4.6.1 portrays that DL has the highest operating revenues ($45,022 million) amongst these competing five airlines in the U.S. market during the time period of 12 months ending in May 2019 although AA has the highest marketshare (17.72%), SW has carried the highest volume of passengers carried (159,170,000 passengers) and made the highest number of departures (1333,000), and UA has the highest number of markets/destinations (165 markets) being served and highest volume of cargo (473 m tons) being transported during this time period. At the same time, DL has the lost operating cost ($39,411 million) while comparing with AA’s operational cost ($42, 091 million) during this 12 months period ending in May 2019.
4.7. PROFIT OR LOSS AND NET INCOME
Graph 4.7.1 provides the net incomes earned by these five airlines during the time period of 12 months ending in May 2019.

Graph 4.7.1 portrays that Delta Airlines has earned the highest profit amongst these competing five airlines in the U.S. market during the time period of 12 months ending in May 2019. It can be understood that AA has the lowest profit ($702 million) during this period since it has the lowest numerical value in terms of its market share, number of markets served, number of passengers carried, the amount of cargo being transported, and the number of departures made amongst the five competing major airlines in the U.S. market. During this period, the profit of DL is $2,989 million more than AA’s profit although DL’s marketshare (17.06%) is slightly less than AA’s marketshare (17.72%). And, SW’s profit is $2,517 million lower than DL’s profit although SW’s marketshare (17.51%) is slightly higher than DL’s marketshare (17.06%).
The profit earned, the net income, and the rate of net income are tabulated by using the following
Formula 1: Net Profit/Loss = Operating Revenue minus Operating Cost.
Formula 2: Net Income = Net Profit minus Taxes paid.
Formula 3: Percentage of Operating Cost = Operating Cost divided by Operating Revenue@100
While analyzing the net income of the individual airline during the time period of 12 months ending in May 2019, Table 4.7.1 provides the scenario.
Table 4.7.1: Net Income earned.
|
Airlines |
Revenue ($ in millions) |
Cost ($ in millions) |
Profit ($ in millions) |
Net income ($ in millions) |
Percentage of Operating Cost |
|
Alaska |
8303 |
7,602 |
702 |
510 |
91.6% |
|
American |
44,712 |
42,091 |
2,622 |
1,652 |
94.1% |
|
Delta |
45,022 |
39,411 |
5,611 |
4,050 |
87.5% |
|
Southwest |
22,171 |
19,076 |
3,094 |
2,389 |
86% |
|
United |
41,861 |
38,347 |
3,513 |
2,277 |
91.6% |
Data Source: Bureau of Transportation Statistics, 2019.
Table 4.7.1 shows that DL has earned the highest amount of revenues whereas AA has incurred the highest operating cost during the time period of 12 months ending in May 2019. SW has earned just half the amount of revenue earned by AA, but SW has earned 18% more profit than AA. While comparing AA and DL, it can be noted that DL is more cost efficient in its operations and its profit more than double the amount of profit what AA has earned during this period.
It also can be noted from Table 4.7.1 that SW has the lowest percentage of operating cost (86%) while AA has the highest percentage (94.1) and both AS and UA have a similar level of operating cost (91.6%). Next to SW, DL has a lower operating cost, which can be assumed as a factor for DL’s higher profit situation than AA and UA while all these three carriers (AA, DL, and UA) are in a closer proximity of earned operational revenues and operating cost.
5. CONCLUSION
As Porter’s five forces model of market competition provides the groundings for the competitive structure of the U.S. airline industry, the research findings of this study have indicated that these five major airlines have an intense rivalry in the U.S. domestic market. Hence, they put pressure on one another and limit each other’s profit potential. Since three of these competing top-five airlines (AA, DL, and UA) are of the equal size and a closer marketshare, the intensity of rivalry has increased in the U.S. market. Again, the products offered by all these competing top-five airlines are undifferentiated and the fixed costs are high, the competitive rivalry is intense in the U.S. market. It can be observed from the analysis provided in Section 4 of this paper that the rivalry among these top-five major U.S. air carriers is fierce as they are trying to bargain profit and marketshare from one another. As a result, such a stiff competition reduces profit potential for all these major airlines in the U.S. market.
5.1. RESEARCH IMPLICATIONS
This research is expected to have two implications. The first one is that it would help inform the readers of this article about the degree of completion the five major U.S. airlines are currently facing in the market. The second implication is to inform and induce the readers of this article about more opportunities to replicate this research in order to conduct an even more in-depth research to find out the pros and cons of this stiff market competition both for the operators and consumers of air transportation in the U.S. Additionally, this research would serve as a tool for academicians teaching aviation major to portray the level rivalry among the competing major U.S airlines and how Porters five forces can be applied to analyze the airline competition in the future.
SOURCES OF FUNDING
This research received no specific grant from any funding agency in the public, commercial, or not-for-profit sectors.
CONFLICT OF INTEREST
The author have declared that no competing interests exist.
ACKNOWLEDGMENT
None.
REFERENCES
[1]
Aaker,
D. A. (1991). Managing Brand Equity. New York: The Free Press.
[2]
Belobaba,
P., Odoni, A., & Barnhart, C. (2009). The global airline industry. John
Wiley & Sons. Retrieved from
https://doi.org/10.1002/9780470744734.
[3]
Borenstein,
S. (2011). Moving beyond deregulation: Why can’t US airlines make money? American Economic Review: Papers &
Proceedings, 101(3), 233-237.
[4]
Bureau
of Transportation Statics. (2019). U.S. Department of Transportation. Retrieved
from https://www.transtats.bts.gov/carriers.asp?pn=1
[5]
Buhalis,
D. & Licata, M. C. (2002). The Future eTourism Intermediaries, Tourism
Management, 23, 207–220. Retrieved from
https://www.sciencedirect.com/science/article/pii/S0261517701000851
[6]
Chadwick,
Jr., William; Gorham, Jeff (October 1, 2018) [effective January 1, 2019]. Air
Carrier Groupings 2019 — Directive No.328 (PDF). Accounting and Reporting
Directive of the Office of Airline Information (Report), 328. Washington, D.C.:
Bureau of Transportation Statistics, United States Department of
Transportation. Retrieved from
https://www.bts.gov/sites/bts.dot.gov/files/docs/explore-topics-and geography/topics/airlines-and-airports/222726/directive-no-328-air-carrier-groups-
2019.pdf
[7]
Chappelow,
J. (2019). What is an oligopoly? Retrieved from https://www.investopedia.com/terms/o/oligopoly.asp
[8]
Chen,
C.-F., & Tseng, W.-S. (2010). Exploring Customer-based Airline Brand
Equity: Evidence from Taiwan. Transportation Journal (American Society of
Transportation & Logistics Inc),
49(1), 24-34.
[9]
Gifford,
D. & Kudrle, R. (2017). U.S. airlines and antitrust: The struggle for
defensible policy towards a unique
industry. Indiana Law Review, 50(2), 539-578.
[10] Johnson, J. C. (2009). Case study methodology
in the Aviation industry. Journal of Aviation/Aerospace
Education & Research, 18(3). Retrieved from https://doi.org/10.15394/jaaer.2009.1427
[11] Kling, J. & Smith, K. (1995). Identifying
strategic groups in the U.S. airline industry. Transportation
Journal, 35(2), 26-34.
[12] McNamara, C. (n.d.). Porter's Five Forces
Model of Strategy. Retrieved from https://managementhelp.org/
[13] Moreira, M. (2014). An analytical model for
the assessment of airline expansion strategies. Journal of Airline and Airport
Management, 4(1), 48-77.
[14] Reich, T. (2014). Domestic air service
development in the stagnant US market. Airport Management, 9(1), 6-14.
[15] Segal, T. (2019). The North American Airline
Industry: Is it an oligopoly? Retrieved from https://www.investopedia.com/ask/answers/011215/airline-industry-oligopoly-state.asp
[16] Spicer, R. (2018). Driven by Competition, The
Airline Industry is Taking Off. Retrieved from
https://www.aviationpros.com/airlines/
[17] Tang, C.-H. & Hsu, Y.-L. (2016). Airline
flight scheduling for oligopolistic competition with direct flights and a point to point network. Journal of
Advanced Transportation, 50:1942–1957.
DOI: 10.1002/atr.1438
[18] The Five Forces. (n.d.). Institute of
Strategy & Competitiveness. Retrieved from https://www.isc.hbs.edu/strategy/business-strategy/Pages/the-five-forces.aspx
[19] Wensveen, J. (2015). Air Transportation: A
management perspective, 8th ed. Burlington, VT:
Ashgate Publishing Company.
[20] Wilkinson, J. (2013). Porter’s Intensity of
Rivalry Definition. Retrieved from https://strategiccfo.com/intensity-of-rivalry-one-of-porters-five-forces/
[21] Yin, R. (1994). Case study research: Design
and methods (2nd Ed.) Thousand Oaks, CA: Sage Publishing.
|
|
 This work is licensed under a: Creative Commons Attribution 4.0 International License
© Granthaalayah 2014-2020. All Rights Reserved.