
|
|
|
|
THE EFFECT OF POPULATION DYNAMICS ON FOREST COVER IN DARO LEBU WEREDA, WEST HARARGHE ZONE, OROMIA REGION, ETHIOPIADelelegy Legese 1, Alemayehu Diriba 2
|
|
|
|


Article Type: Research Article
Article Citation: Delelegy Legese, and Alemayehu Diriba. (2021). THE EFFECT OF POPULATION DYNAMICS ON FOREST
COVER IN DARO LEBU WEREDA, WEST HARARGHE ZONE, OROMIA REGION, ETHIOPIA. International
Journal of Research -GRANTHAALAYAH, 9(3), 78-96. https://doi.org/10.29121/granthaalayah.v9.i3.2021.3761
Received Date: 21 February 2021
Accepted Date: 22 March 2021
Keywords:
Population Dynamics
Deforestation
Forest
Degradation
ABSTRACT
Forest is one of renewable land properties which endowed with numerous resources that are valuable to man. The quality of the environment is constantly losing its status due to increase in population size in most countries of the world. The general objective of this study was to assess the effect of population dynamics on forest cover in West Hararghe Zone in general and Daro Labu Wereda (DLW) in particular. Systematic random sampling technique was used to select the target population of this study whose total number was 364 households from four kebeles of DLW. Questionnaire, interview, FGD and satellite imagery used as data gathering tools for this study. The quantitative data of this study were analyzed using descriptive statistics and the qualitative data were discussed and interpreted through narration. As the result in this study a mixed method was used. This study is triangulation study in its design. The study was found out that population dynamics had contributed a lot to deforestation of the wereda under the study through agricultural land expansion, settlement, fuel wood gathering and illegal tree cutting. Thus due to population growth, lack of alternative livelihood approach, ruthless profit making, lack of economic transformation human encroachment and lack of alternative sources of energy. Population growth had contributed greatly to forest deforestation especially as it affected the forest covers. The major findings were observed that expansion for cultivated and settlement LULC classes rapidly increased from1973 to 2013 on the contrary forest and shrub lands decreased in DLW due to population dynamics and human encroachment in the forest cover. Therefore, there is an urgent need with government for the various stakeholders in environmental resource management to provide mechanism that can prevent the forest cover from further reduction in the study area.
1. INTRODUCTION
1.1. BACKGROUND OF THE STUDY
Forest is defined as wealth endowed with numerous resources that are valuable to mankind (Simmons, 1991; FAO, 2003). It is a large area covered chiefly with trees and undergrowth which gives many benefits for the society, such as providing habitat for wild life, site for recreation, water shade protection, moderating climate, industrial raw materials, fuel wood as source of energy, construction materials and absorbing atmospheric carbon dioxide (Dealon, 1993).
Population dynamics is population change caused by birth, death and migration which refers either population growth or decline (World Bank, 1990). According to it population growth is an increase in the number of individuals in population but Population decline is the decrease in the number of individuals in population. Population growth rate is the rate at which the number of individuals in population changes in a given time as a fraction of the initial population (World Bank, 1990). Ethiopia with its 79 million (CSA, 2009) people living in a geographical extent of 1.1 million km2 has a GDP of US$ 6.1 million 39% of which is contributed by agriculture up on which 85% of the population are dependent for livelihoods (Amare, 2013).
The effect of population dynamics on forest cover is often discussed in terms of its areal extent that is the maximum number of individual that a forest can sustain. The quality of the forest is constantly losing its status due to increase in population growth in most countries of the world (John, 1984). Population has been chief agent of forest deforestation in most countries of the world (Gebriel, 1999). He further explained that man main occupation were hunting and gathering of fruits but latter as human population increased, Man invented new techniques which constituted great danger to the forest cover (Enger and smith, 2006) supported the idea of Gabriel (1999) and stated that as population continues to increase, it becomes more difficult to limit the forest deforestation that accompanies it. Because forests are deforested and uneven by timber harvesting, conversion to agricultural land, road building, human caused fire, fuel wood, settlement, construction, source of industrials raw materials and urban sprawl.
Human population trends determine the environmental impact of human activities. Rising population put increasing demands on natural resources like forest, water and land. With population and environment relation, population has role to influence the environment. In this case there were two conflicting hypotheses such as Malthusian (pessimistic) and Boserupian (optimistic) views.
Malthusians predicted that a population growth outpaced food production in which population growth is geometrical but food production is arithmetic. Forest degradation is one of the natural resources depletion caused by population dynamics. It is the change within the forest which negatively affects the arrangement of the stand and thereby lowering the capacity to supply products and services (FAO, 2006).This takes different forms particularly in open forest formation, deriving mainly from human activities such as over grazing, over exploitation for (fuel wood or timber). In most cases forest degradation does not show as decrease in the area of woody vegetation but rather as gradual reduction of bio mass, changes in species composition and soil degradation (FAO, 2000).
Deforestation is the conversion of forested areas to non- forest lands through cutting, clearing and removal of the forest and related ecosystem in to less diverse ecosystem such as pasture, cropland, plantation, urban use logged area or west land (Kricher, 1997).According to him the transformation of forest lands by human action represent one of the great forces in global environmental change and one of the big biodiversity losses. Therefore, impact of population dynamics has been continues to be deep problem which leads to famine (Thomas mlthus, 1873).He believed that improving people’s standard of living is impossible without limiting population growth and people have to estimate earth’s carrying capacity because it is limited Ester Boserup (optimistic) has alternative view to population environment relation. According to Easter Boserup (1965) problems in connection with population growth are solved through technological advancement (innovation) for example agricultural intensification.
In various studies major causes of deforestation and degradation are identified as population dynamics, institutional factors, affluence and technology. The interaction between population, institution, affluence and technology is taken as the driving forces of deforestation (Meyer and Turner, 1992).
The driving forces of deforestation is shown by the formula EI=IPAT (Geist and Lambin, 2001). According to them where as EI is environmental impact, I, is institutional factors, P, is population, A, is affluence (consumption) and T is technology.
Population change is one of major causes of deforestation however demographic drivers operate in political and economical process at various scales in which it tend to have an in direct effect on land use land cover change.
1.2. STATEMENT OF THE PROBLEM
The purpose of this study was to identify the effect of population dynamics on forest cover and why people actually encroached in the forest area and how they practiced it in DLW
The effect of population dynamics on forest cover was a central problem in the current forest deforestation (Ahmed, A.I.Mahbub Uddin, 2002).According to him the degree of forest deforestation would be judged by focusing on population dynamics and its pressure on forest cover. A number of studies have been conducted with the purpose of understanding how population dynamic affects the forest cover. According to FAO (2006), population increment leads to deforestation which in turn causes forest reduction in terms of its quality and areal extent.
The World Resources Institute estimates that only about 22% of the world's (old growth) original forest cover remains "undamaged". In the past humankind has influenced the forests in which much of the crash has been relatively minor but today, the impact is enormous. Therefore deforestation is expanding and accelerating into the remaining areas of untouched forest, in which the quality of the remaining forests is declining. Global patterns in deforestation, assess the human and ecological costs of forest loss, and discuss some of the steps that can help to correct this alarming situation. Until quite recently, most of the deforestation occurred in Europe, North Africa and Middle East (Global Deforestation, 2006).According to it in the last few decades, the vast majority of deforestation has occurred in the tropics and the speed still accelerates.
The removal of tropical forests in Latin America is going on at a pace of about 2% per year. In Africa, the rate is about 0.8% per year and in Asia it is 2% per year.
Since 1600thc, 90% of the virgin forests that once covered much of the states have been cleared away. In the Pacific Northwest about 80% of this forestland is slated for logging (Global Deforestation, 2006). The situation in Ethiopia is not different because after 1960’s population in Ethiopia started to increase rapidly due to socio economic condition in the world (Amare, 2013).According to this author parallel to rapid population growth and low socio-economic development forest deforestation increased .Therefore, the forest cover of Ethiopia which was 40% at the beginning of 20th century has declined to 3% at the end of 20thc. The forest deforestation in Ethiopia is closely linked to the ongoing population dynamics. More people generally lead to an increasing demand on land for living and expansion of agricultural land. The situation has got more sever in the 18thc when the large number of people moved to south west in scope of organized resettlement program. Consequently, the population pressure on the forest cover increased due to higher demand on fuel wood, construction, timber, grazing and browsing land (Reusing ,2000).
Finally, uncontrolled logging and the illegal export of wood stems to urban centers like Addis Ababa, however, there is no reliable source for data on rates of forest deforestation in Ethiopia (Melaku, 1992: Pankhurst, 1995and Nyssen et al. 2004).
Foresters are arguing that forest deforestation has accelerated over the last 150 years caused largely by the high dynamics in population on Ethiopia (Breitenbach, 1962: Pohjonen and Pukkala, 1990, Reusing, 1998). According to several studies, Ethiopia forest covered approximately about 40% of its total area a century ago but now has shrunken to only about 3% of its land area (Berry, 2003). These studies will high light relationship between population dynamics and forest cover particularly in situation where the effect of population dynamics on forest deforestation. According to Iftekhar and Hoque (2003) human encroachment is an important cause of forest deforestation. Forests are declining mainly because of illegal logging and conversion to non forestry uses.
There were few studies which were similar to the effect of population dynamics on forest cover. For example, (Feyera Debele, Urgesa Tilahun and Dereje Chimdesa, 2014) assessed the effects of population growth on forestry development in East Welega Zone ː The case of Haro Limu district . The others such as (Out, Judith,E, Jesephand Kinuabeye,U,2014) assessed the effect of population growth on forest resource degradation in Indonesia ːThe case of Ikom both which often discussed in terms of biological carrying capacity that the maximum number of individuals that a forest resource can sustain but this research was based on the effect of population dynamics on forest cover in west Hararghe Zone ːThe case of Daro Lebu wereda which frequently discussed the relation between population dynamics in terms of area coverage of the forest and land use land cover change.
1.3. OBJECTIVES OF THE STUDY
1.3.1. GENERAL OBJECTIVE
The general objective of this study was to examine the effect of population dynamics on forest cover in DLW.
1.3.2. SPECIFIC OBJECTIVES
The specific objectives of the study were to
1) To identify the effects of population dynamics on forest cover in DLW.
2) To assess major causes of deforestation in DLW.
2. RESEARCH METHODOLOGY
2.1. DESCRIPTION OF THE STUDY AREA
The study was conducted in Daro Lebu Wereda which was one of the weredas of West Hararghe zone in Oromia Regional State.
2.1.1. LOCATION OF THE STUDY AREA
It is located 80 15’00”N-80 43’00” N latitudes and 400 17’00” E- 400 45’00”E longitudes. This Wereda is neighboring with Habro in the north east, East Arsi Zone (Ejersa river)in the west, Hawi Gudina Wereda in the south, Anchar Wereda in the north and Boke Wereda in the east . It is the Wereda located at a distance of 118km and 478km from Zonal town called Chiro and Addis Ababa respectively and has an altitude that ranges from 1147-2300 meters above sea level.
2.1.2. AGRO-ECOLOGICAL ZONES
According to DLW report (2015), the wereda has 2 basic agro-climatic conditions, namely Woyinadega (44%) and Kola (56%). The total annual rainfall ranging between 900mm and 1000 mm and average temperature is 18.280. Accordingly it has three rainy seasons, spring, Kiremt and Automen. Spring is the short rainy season and lasts between March and May. The Kiremt season, which is the longest rainy season, lasts between June and September. More than 75% of the total rain falls during this season and the highest rainfall occurs in July and August. Rain that occurs during the Kiremt season is very intensive. (Behailu, 2009 cited in Kibamo, 2011). Farming system of DLW is mixed farming. The main types of crops grown were Cash and cereal crops such as chat, coffee and teff, barley, maize, sorghum, etc. respectively.
2.1.3. POPULATION
In this Wereda, population change was very fast ; this is because of low socio -economic status of family, limited investment, lack of meaning full education and training, lack of family planning practice in the community, cultural and psychological formation, non expansion of investment and mass media infrastructure to control population dynamics. Therefore, the wereda had rapid population changes which demanded to expand agricultural land, fuel wood consumption and residential area (DLW report.2014).
The wereda had total human population of 364613 of which 186097 (51.04%) are male and 178514.04 (48.96%) are female. Out of the total population, 13.56 % are urban dwellers (CSA, 2015). The wereda had accrued population density of 82.53 persons per square kilometer, and had a total area of 441788.7 hectare (4417.95/km2).
2.1.4. LAND USE PATTERNS OF DLW
With regard to land use pattern of the wereda, Table 3 showed that cultivable land 86.8 %, pasture (1.8%), forest (4.14%) and remaining (7.26%) is considered as mountainous, swampy and otherwise unusable (D LW report, 214).
Table 3: Land use patterns of DLW
|
Land use patterns |
Area in hector |
Percentage |
|
Cultivable land |
383472.59 |
86.8% |
|
Pasture
land |
7952.17% |
1.8% |
|
Forest land |
18290.05 |
4.14% |
|
Unusable land |
34282.8 |
7.76% |
|
Total |
441788.7 |
100 |
Source; DLW, 2014
2.1.5. MAP OF THE STUDY AREA
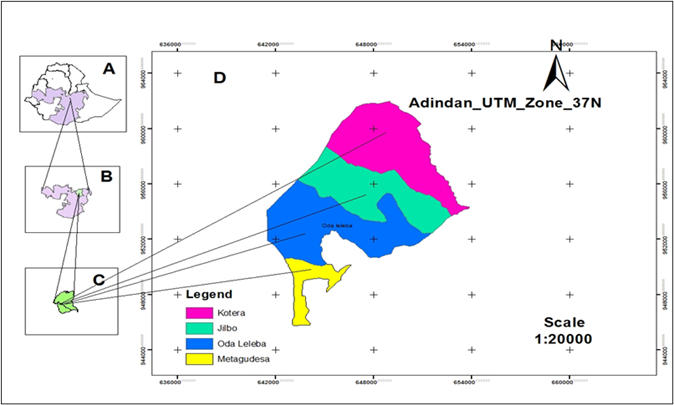
Figure 1: Map of the study area; Source ː Ethio-Gis Lab.
2.2. RESEARCH DESIGN
To achieve the objectives of this study, mixed research method was used. Specifically, triangulation design was used in order to conduct the study. The method was selected because it was helped the researcher to collect and triangulates the quantitative and the qualitative data in this study at the same time.
2.2.1. DATA TYPE
There were two types of data used in this study. It consisted of both qualitative and quantitative data. As to qualitative data, the researcher collected the data from respondents and interpreted and described in words. The quantitative data was used to collect specific numerical data from participants and analyzed by using descriptive statistics.
2.2.2. SOURCE OF DATA
In this study, both primary and secondary source of data were used. Primary sources of data were collected from selected sample households, government and non government workers through questionnaire, interview and FGD.
In order to support primary data, secondary data was relevant to the study, published and unpublished information about the study was collected from the Wereda agricultural development office, Natural Resource Development, land administration and rural development bureaus, and non governmental agencies. Journal, magazines, internet sources, conference reports and reference books were used as secondary source of data.
2.2.3. METHODS OF DATA COLLECTION
Registration, questionnaires, interviews focus group discussion and satellite imagery were employed in this study. Using Focus group discussion with 5 group members of households in each kebeles and individual interviews was conducted to 20 development agents, concerned agricultural professionals and administrative offices workers together at all levels. Enumerators who had completed grade12 and well known local language and study area were employed to collect the data. Brief explanation and training on how to collect data according to the questionnaire were given. There was frequent supervision of the enumerators by the researcher.
2.3. SAMPLE SIZE
Out of 43 kebeles found in DLW, four of them (Kotera, Jilbo, Odaleleba and Metagudesa) which accounts for almost 9.3 % of the total kebeles of the study area) were selected by purposive sampling techniques .This was because the most populous and degraded kebeles which could show the effects of population dynamics on forest resources in which population change leads to deforestation and forest degradation of the study area that four of them represent all other kebeles (DLW report, 2014).
2.4. SAMPLING TECHNIQUES AND SAMPLE SIZE DETERMINATION
Following the identification of kebeles the researcher used to determine the sample size by using the following formula provided by Stoker, (1985 cited in White, 2005).
![]()
Where; n is sample size of total population, N is total households and e is sample error.
Total households of four Kebeles was 4000
then ![]()
![]() Following the determination of sample size, in order to select a
sample (n) of 4000 households, the researcher used systematic random sampling techniques
because the procedure involved in SRS is very easy and can be done internally
and the results are representatives of the population. To determine the sample
size of n number of the sample population through systematic random sampling of
respondents, the sample interval for picking each respondent the following
formula was used.
Following the determination of sample size, in order to select a
sample (n) of 4000 households, the researcher used systematic random sampling techniques
because the procedure involved in SRS is very easy and can be done internally
and the results are representatives of the population. To determine the sample
size of n number of the sample population through systematic random sampling of
respondents, the sample interval for picking each respondent the following
formula was used.
![]()
Where; n is sample size, N is number of total population (households) and k is the skip interval between sampled farmers (households) (Kultar, 2007).
Each sample was taken at the interval of K and the first was drawn using lottery method but the rest sample size was taken with the interval of K. The total population of the four kebeles was 4000 of which 364 of them were selected as sample population.
The sample size interval using the formula ![]() =
= ![]() . Therefore, each sample was taken at the interval of 11 and the
first was drawn using lottery sampling method but the rest sample size was
taken at the interval of 11. Following the identification of households, Wereda’s land administration, Agricultural development
bureaus and development agent workers were identified by purposive sampling.
Because they were expected to read and had information and respond the
questionnaire and interviews that were provided to them.
. Therefore, each sample was taken at the interval of 11 and the
first was drawn using lottery sampling method but the rest sample size was
taken at the interval of 11. Following the identification of households, Wereda’s land administration, Agricultural development
bureaus and development agent workers were identified by purposive sampling.
Because they were expected to read and had information and respond the
questionnaire and interviews that were provided to them.
Table 4: Sampling techniques and sample size determination
|
NO |
Kebeles |
Total households each kebeles |
Sample percentage |
Sample size of each Kebeles |
Sampling technique |
|
1 |
Kotera |
1100 |
9.27 |
102 |
Systematic |
|
2 |
Jilbo |
1200 |
9.33 |
112 |
>> |
|
3 |
Odaleleba |
800 |
8.75 |
70 |
>> |
|
4 |
Metagudesa |
900 |
8.88 |
80 |
>> |
|
|
Total |
4000
|
|
364 |
>> |
Source: Own calculation, 2016
2.5. SATELLITE IMAGERY
To assess the impact of population dynamics on LULC change in past forty years, LULCC was consecutively analyzed using datasets from remotely sensed Land sat imageries of 1973, 1995 (TM) and (Land sat 8 (OLI for 2013). After converting remote sensing data into thematic map, the next step was detecting LULCC. The imageries of each year were classified into a class of bare land, cultivated, forest, grassland, settlement and shrub lands using supervised image classification (figures4,5and 6 and Table 25, 26 and 27)respectively. Then area change between two consecutive study periods was computed using the classified imageries (Table 25, 26 and 27). Post classification comparative analysis of classifications from different dates (map-to-map comparison) and image to image comparison were done (Zewudu, 2011). Imageries from different archives in the different year interval are classified and labeled individually (Eastman, 1999).Accordingly, thematic map of the study area was generated from raster satellite image by supervised image classification algorithm. After recording of the new values for each class, LULC change matrix map between two consecutive years were generated and after reading the matrix Table of each class of each year changed to Tables with percentage. Then, the area coverage of each LULC classes was calculated in unit of hectare by ERDAS IMAGINE software (ERDASː.Imagine-10).
2.6. DATA COLLECTION PROCEDURE
The researcher continued from general to specific research questions so as to make this study more focused in terms of data needed to answer the research questions. And LULC classes identification was based on land sat images of 1973, 1995 and 2013. To this end primary and secondary data collection procedures were used. In primary data collection procedure, questionnaires, interviews, and focus group discussion were used. But in secondary data collection procedure, collecting data from documents, records, land sat and reports of others were undertaken.
2.7. METHODS OF DATA ANALYSIS
The relevant data collected through different instruments were processed and analyzed by both quantitative and qualitative methods of data process and analysis. Accordingly, the data gathered through questionnaire, recorded document and satellite imagery were processed and analyzed quantitatively using descriptive statistics with tables, pie chart, bar graph ,frequency and percentage methods because of its simplicity , clarity and easy to understand by the researcher and the reader. During analysis and interpretation reasonable explanation for the relations and Interpreting tasks was accomplished only after considering relevant factors affecting the problem. In open ended characteristics of respondents, interviews focus group discussion, and document analysis were analyzed by using qualitative method of data analysis through interpretation and conceptual generalization. Finally the results of the data were categorized, presented and interpreted.
3. RESULT AND DISCUSSION
This chapter deals with analysis, presentation, interpretation and discussion of data obtained from different sources through questionnaires, interviews, document records and satellite images. Under this chapter, the characteristics of respondents irrespective of their age, sex, marital status, ethnic origin and migration status, source of livelihood and the analysis of the data collected from the above sources on effects of population dynamics on forest cover in four kebeles of Daro-Labu wereda were analyzed, discussed and interpreted.
3.1. EFFECTS OF POPULATION DYNAMICS ON FOREST COVER
3.1.1. TYPES AND PRACTICES OF DEFORESTATION
As it indicated in Table 9, little greater than 97%of the total respondents practiced deforestation but 2.06% of them did not practice deforestation. Little greater than 38%, 33%, 20%, 6%,1%and1% of the total respondents practiced collecting fuel wood, slash and burn, expansion of farm land charcoaling, timber harvesting and logging respectively. Similarly the majority of FGD respondents decided as there were different types of deforestation in which forest lands were cleared for the purpose of fuel wood, agricultural, settlement and grassing lands in the study area. The result showed that the growth of human population and its interaction with the forest resource resulted in different types of deforestation practices. Therefore; collecting fuel wood, slash and burn and expansion of farm land were the major types of deforestation in the study area. According to (Reusing, 2006), the raise in household family size leads to high demand for fuel wood and farm land in which the forest lands of most farmers have changed from forest land to agricultural, settlement and grazing lands.
Table 9: Effects of population dynamics on forest cover
|
Types and Practices of
deforestation |
Frequency |
percentage |
|
Yes |
357 |
97.94% |
|
No |
7 |
2.06 |
|
Total
|
364 |
100% |
|
Types of deforestation |
|
|
|
Slash and burn |
244 |
31.122% |
|
Timber harvesting |
10 |
1.275% |
|
Grazing |
12 |
1.530% |
|
Collecting fuel wood |
300 |
38.265% |
|
Logging |
8 |
1.020% |
|
Expansion of farm
land |
160 |
20.408% |
|
Charcoaling |
50 |
6.377% |
|
Total |
784 |
100% |
Sourceː Field Survey, 2016
3.1.2. RATE OF POPULATION DYNAMICS ON FOREST COVER EXPLOITATION
In order to show the effect of population dynamics on forest exploitation presented in table 10 below household respondents showed that 65.38% of the respondents claimed that the rate of population pressure on forest resource was fast. Little larger than.80% were with the opinion that it was very fast. Others opinion falls within 8.24% while 1.65% of the sampled population claimed that the rate of population pressure on forest resource exploitation was slow and very slow.
In addition to this almost all of FGD participants responded that the rate of population pressure on forest resources was rapid but a few of them responded saying it was moderate. Likewise; almost the entire of interview participants responded that the rate of population pressure on forest resource was speedy. The result showed that there was significant relationship between Population size and the rate of forest resource exploitation in the study area. According to Ethiopia-UNCED National Report (1992) wide spread deforestation in the highland parts of Ethiopia started around 2500BC.
Table 10: Rate of effects of population dynamics on forest cover exploitation
|
Rate of forest exploitation |
Frequency |
Percentages (%) |
|
Very fast |
84 |
23.08 |
|
Fast |
238 |
65.38 |
|
Moderate |
30 |
8.24 |
|
Slow |
6 |
1.65 |
|
Very slow |
6 |
1.65 |
|
Total |
364 |
100% |
Source; Field Survey, 2016
3.2. MAJOR CAUSES OF FOREST DEFORESTATION
As it is shown in table11, little greater than78% and 21% human encroachment and natural factors were the major causes of forest deforestation in the study area respectively. In addition to this, the majority of the interview participants viewed that human encroachment was the most important underlying causes of forest reduction in plant magnitude and species while limited of them responded that natural factors were fundamental causes in the study area. Likewise greater part of FGD participants emphasized on human activities such as over population, over grazing, over exploitation for (fuel wood, timber and construction materials) and expansion of agricultural land. As result human activities had a great contribution in the reduction of the amount of the forest and areal extent of the forest cove in the study area.
The result showed that high forest removal in the study area was caused by human encroachment in the forest areas of DLW. Human encroachment was an important cause of deforestation in which forests were cutting mainly due to illegal logging and conversion to non-forestry uses (Iftekhar and Hoque, 2003). As result limited land availability and unemployment have been identified as the major proximate causes of human encroachment in the forest areas. Haque (2000) shows that the illegal felling is done by the poor villagers, who usually work for the illegal traders, local influential leaders and forest land encroachers. Ahmed (2002) also finds that illegal felling, theft and encroachment are very significant causes of deforestation and forest degradation
Table 11: Analysis of major causes of forest deforestation
|
Causes of deforestation |
Frequency |
Percentage |
|
Human encroachment |
286 |
78.45% |
|
Natural factors |
78 |
21.55% |
|
Total |
364 |
100% |
Source; Field Survey, 2016
3.3. COMPONENTS OF POPULATION DYNAMICS OF DLW.
The dimension, expansion rate and composition of the population were influenced by the three demographic phenomena, namely fertility (births), mortality (deaths) and migration. However, in DLW the two basic factors in shaping demographic changes were fertility and mortality.
The level of fertility in DLW has been constantly high between 1984 and 2000 and slightly declined there after (Table 23). According to DLW report (2014), the crude birth rate for the wereda was 50 /1000 population and the total fertility rate was about 6 children per woman. The level of fertility slightly declined. This was because people want to have large number of children, start child bearing at younger ages and make much less use of family planning to limit their childbearing.
The level of mortality as measured by the crude death rate, infant mortality rate or expectation of life at birth presented in Table 23 showed a decline over the past two decades. Infant mortality declined from 120 deaths per 1000 births in 1984 to 90 deaths per 1000 births in year 2014. The expectation of life at birth increased from 52 years in 1984 to 54 years in 2014.The majority of FGD and interview participants agreed that as there was high fertility rate. The result showed that as there was high level fertility and declining trend in mortality conditions of DLW indicated the tendency of the population to keep on growing in the next few decades which in turn accelerated deforestation and LULC changes.
In this regard Assefa (1994) pointed out that the reasons for this slow decline in the mortality conditions of Ethiopia are the continuous war as well as the high state of food insecurity prevailed in the 1970s 1980s,1990s and 2000s and the poor health service infrastructure. Overall, the youthful age structure, the high level of fertility and the declining trend in the mortality conditions of Ethiopia indicate the tendency of the population to continue growing.
Table 23: Trends of fertility and mortality conditions of DLW (1984-2014)
|
Year |
CBR |
TFR |
CDR |
IMR |
Life expectancy |
|
1984 |
48 |
7.8 |
9.4 |
120 |
52 |
|
1990 |
49 |
8.1 |
9.4 |
110 |
52 |
|
1994 |
46.8 |
7.6 |
9.4 |
118 |
50.7 |
|
2000 |
43 |
6.7 |
9.1 |
100 |
50.7 |
|
2004 |
43 |
6.7 |
8.5 |
98 |
51 |
|
2010 |
42 |
5.9 |
6.2 |
94 |
52 |
|
2014 |
41.5 |
5.4 |
5.8 |
90 |
54 |
Sourceː Daro Lebu Wereda Document Recorded Report in 2014
3.4. TRENDS OF FOREST DECLINE IN DLW FROM 2000-2016
According to document recorded analysis of Table 25 , DLW had about 26507.32 hectare (6%) of forest land in 2000.This number decreased to 25623.74 hectare (5.8%) in 2001 and to 25181.95 hectare (5.7%) and 24961.06hec (5.65%) in2002and 2003 respectively. The Table showed that the trend of the forest decline in terms of its area coverage continued and reached up to 13253.66 hectare (3%) in 2014.Therefor during 2014 DLW had almost seven times less than forest coverage it had in 2000.
This value showed that area forest coverage decreased rapidly from year to year in the study area for more than one decade but the condition was changed after the year 2014 because the forest areal extent was increased from 13253.66 hectare (3%) to 17671.55 hectare (4%) and24563.45hectare (5.6%) in 2015 and 2016 respectively. According to FGD population growth is inversely related with forest cover in DLW. Both evidences of satellite imagery and document records showed that progressive decline of the forest cover up to 2014 but in DLW document records after 2014 the forest cover was increased in terms of its areal extent
The result showed that the study area had rapid forest decline rate for the last 14 years but after 2014 there was a good beginning of forest conservation program among the farmers of the study area which was resulted in increment of forest coverage in terms of its areal extent for the last two years.
Table 25: Trends of forest decline in DLW from2000-2016
|
Year population |
Forest coverage in hectare |
Forest coverage in percent (%) |
|
2000 239702 |
26507.32 |
6 |
|
2001 247508 |
25623.74 |
.5.8 |
|
2002 255314 |
25181.95 |
5.7 |
|
2003 263120 |
24961.06 |
5.65 |
|
2004 270926 |
24740.16 |
5.6 |
|
2005 278732 |
24475.09 |
5.54 |
|
2006 286538 |
24298.38 |
5.5 |
|
2007 294344 |
23856.59 |
5.4 |
|
2008 302150 |
23724.05 |
5.37 |
|
2009
309956 |
23547.33 |
5.33 |
|
2010 317762 |
22089.44 |
5 |
|
2011 325568 |
20984.96 |
4.75 |
|
2012 333374 |
18466.77 |
4.18 |
|
2013 341180 |
13872 |
3.14 |
|
2014 364613 |
13253.66 |
3 |
|
2015 376792 |
17671.55 |
4 |
|
2016 384613 |
24563.45 |
5.56 |
Sourceː DLW Document recorded reports of Agricultural and Natural Resource conservation Office
4. CONCLUSIONS
Based on the above mentioned findings, the following conclusions were made: The population changes had a great role for forest deforestation and land use land cover change. These forest cover distractions were caused by several factors such as population growth, settlement expansion, poverty, unemployment, corruptions, expansion of farm lands, un wise tree cutting, lack of alternative energy sources, migration and lack of economic transformation from agriculture to industry.
The study area had rapid population growth rate with shorter doubling time. For this matter as population size increases demand for food, fuel wood and wood for housing were increased so people were participated in exploitation of forest cover as sources of energy construction materials, residential and farming land. Therefore; human population and its interaction with the fixed land resource highly influenced the change of one LULC class to the other. As a result, expansion for cultivated and settlement LULC classes were rapidly increased from 1973 to 2013.Cultivated land breathlessly increased from 22.73% in 1973 to 39.9% and 48.8% in 1995 and 2013 respectively. Likewise, settlement LULC class was increased from 10% in 1973 to 15.5% and 17% in 1995 and 2013 respectively. On the contrary, shrub and forest land decreased astonishingly from 29.58% and 6.5% in 1973 to 5.1% and 1.8% in 2013 respectively(Table,27,28,29,30 and 31).
The miss use of the forest plant affected the forest production of most of sloppy areas of the farm lands because the households were clearing sloppy areas to expand agricultural land instead of planting them.. Farming and wood cutting were the major source of livelihood but the size of population was greater than the forest available so that area coverage of the forest declined in which the rate of forest damage was greater than the rate of forest conservation in the study area. Even though most of respondents knew that the damage of the forest had negative impact on socio economic livelihood of the households, they were unable to implement forest conservation as needed because of underlying causes of deforestation and the culture of forest conservation practices were decreased over time.
4.1. RECOMMENDATION
· Population increase should be checked through family planning methods, this would cut down the large family size.
· Proper environmental education should be imparted to the people so that the people can appreciate the importance of sustainable environment.
· The inhabitants should be encouraged to carry out forest cover conservation since almost all of the respondents were using wood as energy source; this has great impact on forest conservation. So, the local and district administration should have take a measures on this activity as they are taking measures on those who have cut the forest for expansion of agricultural land, settlement and energy
· Daro Lebu local government should work on tree planting in the area that concentrates on either hill side (sloppy area) or river bank. This would help to check the rate of forest cover exploitation in the area.
· Selective logging should be encouraged so as to prevent excessive exploitation of the Forest cover in the area
· Households should be visited by Forest development experts so as to conserve the forest cover in and around their farm land.
· Households should be provided by alternative energy resource in DLW
· Economic transformation should be needed from agriculture to industry
· Providing incentives for the model farmers to appreciate a good beginning of forest conservation program among themselves.
· The households should be trained on family planning and different mechanisms of forest conservation methods.
· Indigenous forest conservation culture should be appreciated by the concerned bodies
Appendices
Appendix-I: Questioners
Household Questionnaires to assess the Effect of Population Dynamics on Forest Resourcesː In the case of Darolebu Wereda West Hararghe Zone Oromiya Regional State, Ethiopia Questionnaires designed to assess the effect of population dynamics on forest resources in the Case of Darolebu Wereda.
Dear respondent:
This questionnaire has only intended for research purpose. The result from this research will help to address the effect of population dynamics on forest resources in Darolebu Wereda. Its finalization directs to understand the consequence of population change on the forest resources of the study area. The government, the research community, Stake holders, decision making groups and the local people will use it in their respective concerns. Therefore, I kindly request the respondent to fill this questionnaire. I promise you that all your response will be held confidentially.
Thank you for your cooperation!
Direction: Circle and/or write your answer on the space provided only where it needed. You can choose more than one option when necessary.
Identification:
Name of Kebelle: Kotera________________
Jilbo_________________
Odaleleba_____________
Metagudesa____________
Name of the village_____________________
Part one: Background Information of Sample Households
Household head
1) Age______ II. sex___________
2) Marital status: Married ____.Single ____.divorced_____. Others (specify) ________.
3) Religion: Christian________. Muslim_______. Others (specify
4) Appendix Table 1: Family size by age group and gender in your house hold:
|
Age group |
Male |
Female |
Total |
|
1-14 |
|
|
|
|
15-65 |
|
|
|
|
>65 |
|
|
|
Part Two: Socio- Economic Characteristics of the House hold Head
5) Can you read and write?
I) Yes II) No
6) If yes, what type of education you followed?
I. Formal II) Informal III) Vocational
7) If formal education, what grade did you complete?
I) 1-- 4 II) 5--8 III) 9—10 IV) 11—12 V) Tertiary
8) Ethnic origin of the household head
I) Oromo II) Amhara III) others (specify)
9) Migration status of the household head
I) Migrant II) Non-migrant
10) Source of livelihood of the house hold head
I) Farming II) Wood cutting III) Trading IV) others (specify)
Part Three: Forest property Characteristics of the Household
11) How many hectares of forest land do you own (including house stead)_________
12) Do you have enough Forest land in relation to your family size
I. Yes II. No
13) If your answer for question number 12 is No how do you support your family in terms of energy?
Using solar energy
Using hydro electric power
Collecting fire wood from the common forest
Use of charcoal V. Others specify____________________
Part Fourː Land Holding Characteristics of the Household
14) How many hectares of land do you own (including homestead)?______________
15) How is the proportion of farm land in relation to your family size?
I. Very high II. High III. Medium IV. Low V. Very low
16) If your answer for question number 15 is low how do you support your family ?
I. Agricultural land expansion to nearby the forest area
II. Selling fuel wood for the surrounding urban areas
III. Selling charcoal
IV Migrating from the original place others specify V. __________________
17) Have you lived in the area since birth? II Yes II No
18) If your answer for question number 17 is No, why did you come to this area?
I. Looking for farm land II. Through marriage
III. Through resettlement program IV. Others (specify)
Part Five: Effects of population dynamics on forest resources
19) Would you do deforestation in and around your farm land?
I. Yes II. No
20) If your answer for question number.19 is yes, what are the major types of deforestation do you practice in and around your farm land?
I. Slash and burn
II. Timber harvesting
III. Grazing
IV. Collecting fuel wood
V. Logging
VI. Expansion of farm land (clearing the forest)
VII. Charcoaling
21) How do you evaluate the effect of population dynamics on forest resource exploitation in and around your farm land?
I) Very fast II) Fast III) Moderate V) Slow VI) Very slow
22) Do you observe forest degradation problem in and around your farm land?
I. Yes II. No
23) If your answer for question number 22 is yes, what are the causes?
____________________________________________________________________________________________________
____________________________________________________________________________________________________
_______________________________________________________________________________________________
24) Do you observe that the migrants do more forest deforestation than the non-migrants?
I. Yes II.NO III. Don’t know
25) Which methods of forest resource exploitation do you practice in and around your farm land?
I. Cutting down trees. II. Gathering. III. Trapping IV. Plucking
26) Which consequences of forest exploitation do you observe in and around your farm land?
I. Loss of soil fertility. II. Loss of biodiversity. III. Loss of aesthetic value. IV. Soil erosion.
27) How do you assess implementation of forest conservation practice in and around your farm land?
I, Very high II. High III. Medium IV. low Very low.
28) If your answer for question number 27 is low what types of forest conservation are done in and around your farm land?
_____________________________________________________________________________________________
__________________________________________________________________________________________________________________
29) Have you observed forest cover reduction in and around your farm land?
I. Yes II. No
30) If your answer for question number.29 is yes, what mechanisms do you use to maintain the forest cover?
I). A forestation II). Reforestation III.) Controlling over grazing IV.) Others specify
31) How do you observe the role of perennial crops and trees for forest conservation?
____________________________________________________________________________
32) What technology do you use to cut the forest trees of your farm land?
I. Traditional tools (hand tools like, axe, chain saw)
II. Machine III. Others specify_____________
33) Do you plant trees in sloppy areas of your farm land?
I. Yes II. No
34) How do you perceive about forest removal and mechanism to maintain it?
I. very high II. High V .Very low
III. medium Iv. Low
35) Do you know the forest on your farm land requires conservation?
I. Yes_____________ II. No___________
36) How often does forest development expert visit you in a year? ___________
Appendix- II
Structured Interview for Land Administration, Agricultural and Rural Development Office, Dis trict Administrative Office and Development Agent workers.
1) Do the farmer’s farm lands have the forest resources?
2) To what extent the forest conservation practice program involve the community?
3) Do you give continuous training about forest conservation measures for peasants?
4) Is there land scarcity in this area?
5) To what extent peasant’s farm lands have forest deforestation?
6) How do you evaluate the magnitude of biodiversity of the forest in the study area?
7) 7. How do you evaluate the magnitude of the forest cover over time in terms of its areal size?
8) Who are responsible for forest deforestation and degradation in this area
9) Is there agro forestry practice among peasants in each kebelle of the district?
10) Is there mechanism to control the activities of those farmers who settle or expand their farm land to unprotected forest area?
11) Do you think the conservation of the forest in the district have been effective?
12) Is there illegal tree cutting on communal forest of the study area?
Appendix- III
Focus Group Discussion questions for House Holds
1) Do you observe the problem of population pressure in your kebelle?
2) What are the underlying causes of forest deforestation in your kebelle?
3) What kinds of measurements do you practice to control forest deforestation and degradation in and around your farm land?
4) Is the culture of forest conservation measures increase or decrease gradually from time to time in your locality?
5) What measure did you take when forest per hectare area of your farm land decline?
6) While you plant trees on your farm land, do you grow them lonely or with one another?
7) Do you cut the forest trees in and around your farm land?
8) For what purpose do you cut the forest resources in and around your farm land?
9) 9. Is there any support to sustain the indigenous people forest conservation measures . . .
10) from local and national governmental and non-governmental bodies?
11) 10. What are your limitations to conserve the forest resources in and around your farm .
12) land?
SOURCES OF FUNDING
This research received no specific grant from any funding agency in the public, commercial, or not-for-profit sectors.
CONFLICT OF INTEREST
The author have declared that no competing interests exist.
ACKNOWLEDGMENT
None.
REFERENCES
[1] Adeleke, B. O. and Leong Goh Cheag .1981. Certificate physical and Human Geography. university
press limited, Ibadan.
[2] Ahmed, P. 1991. “Agroforestry: A
viable land use of Alkali Soils. Agroforestry systems. Vol, 14. Pp.23-37.
[3] Ahmed, A. I. Mahbub Uddin,. 2002. Baseline Socio-Economic Survey Phase One Under
Fore stry Sector Project(ADB Project BAN NO.1486). Final Report.
(Dhaka: Kranti Asso ciates Ltd.).
[4] Akagl, H. Castillo, E.S.; Cortes-Maramba, N. Francisco-Rivipa, A.
T., and Timbang, T.D. 2000. “Health Assessment of
resource exposure among school children residing near a goldprocessing and refining plant in Apokon, tagun, Davao del Norve, Philippines. The science of the total environment,
vol. 25, no.9, pp 4-5.
[5] Aklilu
Kidanu .1996. Integration of Population,
Environment Equitable and Sustainable
Development Issues into the Curriculum of the Demographic Training and
Research Center of the Institute of
Development Research at Addis Ababa University. A workshop Proceedings, April
18-19, 1995 Wabe Shebelle Hotel.
[6] Alves,D.S. 2002. Space time dynamics of
deforestation in Brazilian Amazonia.International
Journal of Remote Sensing, 23(14), 2903-2908.
[7] Amare S. M . 2013. Population and
environment interaction: the case of gilgel abbay, cat chment, Northwestern Ethiopia. Journalof
Environmental Research and Management Vol. 4(1). pp. 0153-0162, January, 2013.
[8] Anyadike, R.N.C. 2007.Statistical methods
for the social and environmental sciences. Spectrum, Ibadan.
[9] Anthony and Bruke.
2004. Mixed research design.
[10]
Aplet, G. H.; Johnson, N., Oison,
J.T. and Sample, V.A.1993 Defining sustainable forestry island press, Washington Assefa Hailemariam DC.
[11]
Population
Dynamics and Their Underlying Implications for Development in Ethiopia. In MoPED (1994), Integrating Population and Development Planning. A workshop Proceedings, 5-7 May
1994.
[12]
Atte,
O. D.1994. “Land and forest of Cross River State: A participatory Appraisal of
rural people perception and preference”. Working paper, FDD/CRSEP, pp.3-9.
[13]
BangkokCSA .2001. Population Growth and Environment in
Ethiopia, In-Depth Studies from the 1994 Population and Housing Census in
Ethiopia, Central Statistical Authority (CSA).
[14]
Barbier E.1997.The economic determining of land
degradation in developing countries. philophosical
Transaction of the royal society of London. Series BːBiological
sciences, 352(1356) 891-899.
[15]
Belay
Tegene .1995. Population Pressure and Problems of
Arable land Degradation in Ethiopia.
[16]
Bijendra Basnyat .2009.
Impacts of Demographic Changes on Forests and Forestry in Asia and the
Pacific, Food and Agriculture Organization of the United Nations
Regional Office for Asia and the Pacific, Bangkok.
[17]
Bilsborrow, R,K and stupp,p.1997. Demographic process, land and environment in Guatemala. In. R.Bix
by, ARebley & A.B. Mendez(Rds),Demographic
Diversity and change in the Central American isthmus(pp.581-624).Rand Santa
Monica.
[18]
Berry,
L.2003 .Land Degradation in Ethiopia and Its Extent Impact.
[19]
Bisong, F.E.2001. “Farming systems and forest
biodiversity conservation towards a theory and model for sustainable natural
resource management”, in Bisong F.E. (ed) Natural resource useand
conservation systems for sustainable rural development. Baaj
international company, Calaba, pp.162176.
[20]
Bisong, F.E. and Ajake, A.
O. 2002. “Forest regeneration stages and livelihood security of rural women in
the rainforest of Cross River State, south eastern Nigeria”, Roan. The journal
of conservation (NCF), Vol. 1.1, No.1, pp.94-108.
[21]
Boki, Cross River State. Unpublished Ph.D Thesis, University of Jos. Ola-Adams, B. A.1981.
Strategies for conservation and utilization of forest genetic resources in Nigeria.
Nigeria Journal of Forestry. vol. 71, No. 2, pp.32-40.
[22]
Boserup, E.1965.The Condition of Agricultural Growth
the Economics of Agrarian change under population pressure. New York Aldine
publishing Camp any.
[23]
Breitenbach, F. von .1962. National forestry development
planning: a feasibility and priority study on the example of Ethiopia.
Ethiopian Forest Review 3/4: 41–68.
[24]
Bunker,
S.G.1984.Underdeveloping the Amazonː Extraction, Unequal Exchange and the failure of the modern state. Champaign university
of Illinois Press.
[25]
Carr, D.L.2002a. The role of population change in land use and land cover change in rural Latin.
Americaː Uncovering local process Concealed by macrolevel data.InM,H,Y Himiyama and T. ichinose(Eds) Land use change in comparative perspective,
Enfield, NH and Plymouth, UKːScience
Publishers.
[26]
Carr, D.L. 2000b.Rural-frontier migration and
deforestation in the sierra de. Locandon
National park Guatemala. PH.D. dissertation Department of Geography. Chapel Hill,NCː University of North Carolina.
[27]
Carr, D.L.2004a. Proximate population factors and
deforestation in tropical agricultural frontier. Population and environment,25(6),585-612.
[28]
Carr,D.L.2005.Population,land
use and deforestation in Sierra de Lacandon National
park, peten Guatemala. The professional Geographer,
57(2) 157-168.
[29]
Central
Statistical Office .1985. Report on the Results of the 1981 Demographic Survey
CSA(Central Statistical Authority) .1999.
[30]
The
1994 Population and Housing Census of Ethiopia. Results at Country Level.
Volume II Analytical Report.
[31]
CSA(Central
Statistical Authority) .2001. Ethiopia Demographic and Health Survey 2000.
[32]
CSA(Central
Statistical Authority) .1993. The 1990 National Family and Fertility Survey
Report Collins, W. 1984. Collins Atlas of the world Collins London Glasgow.
[33]
Cunningham,
W. P. and Cunningham, M.A. 2004. Principles of Environment science; Inquiry and application. (2nd edition): McGraw-Hill
company.
[34]
David,K.p.2003.The
major causes of Tropical deforestation international Timber Market in the case of Southeast Asia.
[35]
Dealon, R.T
.1993. Assessing the Relationship
between Government Policy and Definition of closed forest.www.UNep
org/vital forest report/VfG-O1 accessed
august 7, 2016).
[36]
Deforestation,
Journal of Environmental, Economic and Management.
[37]
Deininger,K,&Minten,B.1999.Poverty
policies and deforestationː The case of Mexico
Economic Development and Cultural change 47(2),313-344.
[38]
EMA(Ethiopian Mapping Authority) .1988. National Atlas of Ethiopia.
[39]
EVDSA(Ethiopian
Valleys Development Studies Authority).1990.Aproposal for Collabrative
[40]
Environmental
Studies and Institution Building for Consideration by External Donors.
[41]
FAO.2000.
Global Forest Resources Assessment 2000.FAO Forestry Paper 163. Food and
Agriculture Organization, Rome, Italy.
[42]
FAO.2001.Forest
Resources Assessement 1995ːGlobal Synthesis.FAO Forestry Paper12 (RomeːFAO).
[43]
FAO.2002.Forest
Resource Assessement 1990, FAO Forestry Peper112(RomeːFAO).
[44]
FAO.2006.UNASYCVA,
Vol, 57, no225, Rome.
[45]
FAO.
2007. State of the world’s forests2005. (
RomeːFAO).
[46]
Farooque, Mohiuddin.1997. Law and Custom on Forests
in Banlgadesh: Issues and Remedies.
[47]
(Dhaka:
BELA). Folke.c. Jansson, A, Lesson, J, &
Costanza, R.1997. Ecosystem appropriation by Cities. Ambio
26(3) 167-172.
[48]
Frhon, R,& McGwire K.Cetal.1996.Using
satellite remote sensing analysis to evaluate a socio-economic and ecological
model of deforestation in Rondonia, Brazil.
International Journal of remote sensing 17(16)3233-3255.
[49]
Gain,
Philip.1993a. Forest and Forest Land of Bangladesh. In: Gain, Philip eds.
Bangladesh Land, Forest and Forest People. (Dhaka:
SEHD).
[50]
Geist,
H.J, &Lambin, E.F.2001.What Drivers Tropical
Deforestation Ameta-analysis of Proximate and Underlying causes of
Deforestation Based on Sub-national case study. Evidence louvian-la-
Neuve Belgium LUCC international project Office 116.
[51]
Geist,
H.J, Lambin, E, F.2002.Proximate causes and
underlying driving forces of tropical deforestation. Bioscience, 52(2) 143-150.
[52]
Geist,
H.2005.The causes and progression of desertification Aldeshot,
UK, Burlington, VTːAshgate258.
[53]
Gomez-Pompa, A. and Bursley, F.W.1991.
“The management of natural tropical forests”, in Gomez Pompa,
A. (eds) Rainforest regeneration and management. Man
and Biosphere series,new
jersey, pp.317.
[54]
Headley,
M. 2003. Participatory forest management. The Jamaica forestry department experience”.
UNASLYVA, vol. 54, No.214/215.
[55]
Hecht,
Cockburn A.1989.The Fate of the Forest .New YorkːHarper
Collins.
[56]
Iftekhar, M. S and A. K. F. Hoque.2005.
“Causes of Forest Encroachment: An Analysis of Bangladesh.” Geo Journal 62,(1
-2) (Netherlands: Springer.
[57]
Jepson,P,Jarvie,J.K,Mackinnon,K,&Monk,K.A.2001.The
end of Indonesia’s lowland forests.Science,292, 859-861 Jimoh,
S.C. 2001. “Mangrove degradation in the coastal south east of Nigeria: Causes,
effects and remedies for the future”, in Popoola, L., Abu, J.E. and Oni, P.I.
(eds), Forestry and National Development. FAN publication, Ibadan, pp.17-38.
[58]
Johnson,
R. N. and Libecap, G.D.1982. “Contributing problems
and regulation: The case of the fishery” American Economic review. vol.5,
no.72, pp.1005-1023.
[59]
Malthus,
T.1873.An Essay on the principle of population. New York Random house.
[60]
Markos
Ezra .1997. Population Issues in Rural Development. In Pausewang,
S (eds.): Ethiopia: Options for Rural Development. London.
[61]
Mather,
A.S, and Needle,C.L.1999.Development ,democracy and forest trends. Global Environ
mental Change 9(2), 105-118.
[62]
MatherA.2001.The
transition from deforestation to reforestation in Europeinː
A,A.Kaimowith (Ed),Agricultural
Technologies and tropical Deforestation. Wilgford uk New York NYːCABI
PP.35-52.
[63]
Mayer,
W.B.& Turner II,B.L.1992.Human population growthand
global land use/cover change. Annual review of ecology and systematic,23 39-61.
[64]
Mayers,N,&Kent,J.2001.prevese
subsidiesː How Tax Dollars can undercut the Environment and the Economy. Washington,
D.C ː Island press.
[65]
Mayer,N.1997.Environmental
refugees. Population and Environment,19(2) 167-182.
[66]
Melaku Bekele .1992. Forest history of Ethiopia
from early times to 1974. MSc Thesis, School of
Agricultural and Forest Sciences, University College of North Wales, UK.
[67]
MOA(Ministry
of Agriculture) .1995. Land Use Systems and Soil Conditions of Ethiopia.
[68]
Moran,
E.M.1993.Deforestation and land use in the Brazilian Amazon. Human Ecology,21(1),1-21.
[69]
Morankinyo,T.1994.“ThehistoryofdeforestationinNigeria1400–1990”report
prepared for the Cross River State forestry project. Calabar.
[70]
Murphy,L.L.Marqutte.C,pichon,F.J,&Bilsborrow,R.1999.Landuse
household of research finings 1990-1999.University of Florida, Center for Latin
American studies 48thannual conference. “Patterns and processes of Land use and
forest change in the Amazon” March 23-26 1999,Gainesville,FL.
[71]
Noble,
I.R,&Dirzo, R.1997.Forest as human dominated
ecosystems.Science,277(25),522-525.
[72]
Nyssen,
J, J. Poesen, J. Moeyerson,
J. Deckers, Mitiku Haile
and A. Lang .2004. Human impact on the environment in the Ethiopian and
Eritrean highlands a state of the art. Earth-Science Review 64: 273–320.
[73]
Nwoboshi, L. C. 1987.Regeneration success of natural
management enrichment planting and
plantations of nature species in West Africa. in Mergen,
F. and Vincent, J.R. (eds) Natural management of tropical moist forests. Yale
University, New Haven, Connecticut. Office of the Population and Housing census
Commission .1991.
[74]
The 1984 Population and Housing Census of
Ethiopia. Analytical Report at National Level. Office of the Population and
Housing census Comission .1999.
[75]
The
1994 Population and Housing Census of Ethiopia. Results at Country Level.
Volume II Analytical Report.
[76]
Okonkwo,
M. C., Umar, G. A.; and Nwafor, O. E. 2002.Forest
Resources Depletion and the National
Economy. Proceedings of the 28th annual conference of the Forestry association
in Nigeria, FRIN, Ibadan, 11p.
[77]
Okpiliya, F. I. 2002. Degradation of floral
diversity in the tropical rainforest
ecosystem.
[78]
Oldeman, S.O., Olayemi,
J.K.; and Eweka, J.A. 1989.Tropical rainforest: A hot
and humid issue. in Verwey, W. D. (ed) Nature and sustainable development. No.
105, pp.81-97. Office of the Population and Housing census Comission
.1999.
[79]
The
1994 Population and Housing Census of Ethiopia. Results at Country Level.
Volume II Analytical Report.
[80]
Osemeobo, G. J. 1992. Traditional land use system and
environmental degradation in Nigeria. Proceedings of the 22 nd
Annual conference on the forestry Association of Nigeria.
[81]
Park,
C. C. 1992. Tropical Rainforest. Routledge, London.
[82]
Pickering,
K. T. and Lewis, A. O. 1994. An Introduction to Global environment issues.
[83]
Pichon,F,J.1997.Colonist
land-Allocation decision, Land use and deforestation
in Ecuadorian Amazon frontier. Economic Development and Cultural change,45(4)
707-744.
[84]
Kaimowitz, D.1997.Factors determining low
deforestation .The Bolivian Amazone.Ambio, 26(28) 537-540
[85]
Kates.R.W.2000.Population
and consumption what we know, what we need to know. Environment, 42(3), 10-19
[86]
Kricher, J.1997. A Neotropical Companion. Princeton:
Princeton University Press.
[87]
Kultar, S. 2007. Quantitative Social Research Methods, New Delhi, India.
[88]
Kumarian Press, West Harford. Poore, D. and Sayer, J.
1991.The management of tropical moist forest lands ecological guidelines. IUCN,
United Kingdom.
[89]
Kummer, D, M&Turner11, B.L.1994. The human
causes of deforestation in South east Asiaː the recurrent pattern in that
of large scale logging for exports followed by
agricultural expansion. Bioscience, 44(5) 323-328.
[90]
Lund.2008.
Definition of the forest in FAO .2006a.
[91]
Pankhurst,
R. 1995. The history of deforestation and afforestation in Ethiopia prior to
World War I. Northeast African Studies 2:
119–133.
[92]
Pohjonen, V. & T. Pukkala
.1990. Eucalyptus globulus in Ethiopian forestryː Forest Ecology and
Management 36:19–31.
[93]
Popoola,
C. 1992.Strategies for development of private forestry in Nigeria. Proceedings
of the22nd forest association of Nigeria, FAN, Kano, pp.167-176.
[94]
Ravne, P. 1988. Biological resources and global
stability in Kawano, S., Connell, J. H. and Hidaka (eds),
Evolution and co-adaptation in Biotic communities. University of Tokyo press,
Tokyo, pp.3-27.
[95]
Reusing,
M. 1998.
Monitoring of Forest Resources in Ethiopia. Addis Ababa, Ethiopia.
[96]
Reusing,
M.2000. Change Detection of Natural High Forests in Ethiopia Using Remote Sensing and GIS Techniques: International
Archives of Photogrammetric and Remote Sensing. Vol. XXX III, Part B7.
Amsterdam.
[97]
Robinson,
D., and Brown, I. 2002. The Slimfs initiative: A
Progress Report. Forest Steward Council, Oaxaca Universal Journal of Management
and Social Sciences Vol. 1, No.1; December 201151.
[98]
Rudel, T. 1994. Population, development
and tropical deforestation: A Cross National Study. in Brown, Katrina and Pearce, D.W. (eds). The causes of tropical
deforestation. UBC Press, pp.96-105.
[99]
Saberwal, V. 1996. “Pastoral politics: Gaddi Grazing,
degradation and biodiversity conservation in Himachal Pradesh”. Conservation
Biology, Vol.10, No.3, pp.4O-50.
[100] Salat, E., Love-Joy, T. E.; and Vose, P.B. 1983. Precipitation and water recycling in tropical
forests. Environmentalist, No.3, pp.67-72.
[101] Sayer, J.A.1991.The management of
tropical forest buffer zone. The world conservation Union.
[102] Southgate, D. and
Whitakar,M.1992.Promoting resource degradation in Latin Americaː tropical deforestation, soil erosion, and
coastal ecosystem disturbance in Ecuador. Economic Development and Cultural
Change,35(4),786-807.
[103] Sundberg,J.2003.Strategies for authenticityand space in Maya Biosphere Reserve Pe ten. Guatemala.
In K.S. Zimmerer & T.J.Basett(Eds).Poletical Ecologyː.AninetgrativeAp
proach to Geographyand
Environmental Development Studies (PP.50-69).
[104] Stewart, D.1994.After the
treesː Living on the transamazonian Highway.
Austinː University of Taxes
press.
[105] Switzerland.Schmidt,R.C.1987.Tropical
rainforest management. UNASYLVA, No.156,
Vol.39, pp2- 17, FAO
Rome.
[106] Schreckenberg, K. and Hadley, M. 1991. Economic
and Ecological sustainability of tropical rainforest management, UNESCO,
France.
[107] Schiller,A,de
sherinin,A,Hsieh,w,&pulsipher,A.2001.The vulnerability of Global Cities to
Climate Hazards. Paper presented at meeting of the human dimensions of Global Environmental
change Research Community,4-5 October2001,Rio dejanerio.
[108] Scott, J.C. 1996. Seeing like a
state: How certain modern schemes to improve human condition have failed. Yale
University Press, New Haven.
[109] Shaw, O. and Whealer,
O. 1985. Statistical techniques in geographical analysis. John Wiley and Sons,
Chichester.
[110] Skoup and C.O. 1989. “Report of forest
revenue systems study for Nigeria”. A Report presented to Federal Ministry of
Agriculture water resources and rural development. IbadanPp.206.
[111] Stoker.1985.cited in
White.2005.Samechniques and sample size deter
mination in quantitative research.
[112] Sule, R. O. 2007. Paradigm of
Urbanization and urban planning in Africa Thumbprints Interna tional Company
Calabar, Lagos.
[113] Tewolde Berhan
G.Egziabher.1996. Environmental Policy and population Explosion in Ethiopia.
[114] Udofia, P.E. 2006. Fundamental of social
sciences statistics. Immaculate pub. Ltd, Uyo.
[115] UN(United Nations). 1993. Report
of the United Nations Conference on Environment and development. Rio de
Janeiro, 3-14 June 1992. Volume I. Resolutions Adopted by the Conference.
[116] UNECA(United Nations Economic
Commission for Africa).1993.Relationship between Population and Environment
with Particular Reference to Mortality in Selected ECA Member States.
[117] USGS (United State Geological
Survey) .1976. james r. anderson,
ernest e. hardy, john t. roach, and richard e. WITMER. A Land Use and Land Cover Classification
System for Use with Remote Sensor Data. GEOLOGICAL SURVEY PROFESSIONAL PAPER
964 A revision of the land use classification system as presented in U.S.
Geological Survey Circular 671.
[118] Westley, F. 1995. Governing design
in the management of social systems and ecosystems management. in L. H.
Gunderson; C D., Holling , S.S. Light (eds) Barners and Bridges to
the Renewal of Regional ecosystems. Columbus University Press, New York,
pp.391-42.
[119] WCED (World Commission on
Environment and Development) .1987. Food 2000=Global Policies for Sustainable
Agriculture. A Report of the Advisory Panel on Food Security, Agriculture, Forestry and Environment to the World
Commission on Environment and Development. Zed Books Ltd.
[120] WB (World Bank).1990.Population
Growth and Reproduction in Sub-Saharan Africa. Technical Analyses of Fertility
and its Consequences.
|
|
 This work is licensed under a: Creative Commons Attribution 4.0 International License
© Granthaalayah 2014-2020. All Rights Reserved.