
|
|
|
|
AN EMPIRICAL STUDY ON THE CONROL OF REJECTION RATE IN INSTRUMENT CLUSTER ASSEMBLY LINE BY USING QUALITY CONTROL TOOLS AND KAIZENManoj Govindharaju *1
|
|
|
|


Article Citation: Manoj Govindharaju, and Niresh Jayarajan.
(2020). AN EMPIRICAL STUDY ON THE CONROL OF REJECTION RATE IN INSTRUMENT
CLUSTER ASSEMBLY LINE BY USING QUALITY CONTROL TOOLS AND KAIZEN. International
Journal of Engineering Technologies and Management Research, 7(9), 14-23. https://doi.org/10.29121/ijetmr.v7.i9.2020.774
Published Date: 16 September 2020
Keywords:
Lean manufacturing
Kaizen
Quality control tools
Why-why analysis
ABSTRACT
In today’s competitive world, any organization has to do mass production but mass production has both advantages and disadvantages. More rejection and more waste formation occurs in mass production. Further wastage leads to decreases in productivity and improvements. Lean production leads to minimizing the wastes and also improving the productivity. Hence profits would be considerably increased and further improvements takes place. Lean production has several benefits over mass production. It reduces the storage area and also helps in cost savings. Quality control tools played an important role in industrial engineering. They use 7 different tools to find the root cause for the defects and also prioritize it. Why – why analysis used to find the causes for the problem in accurate manner. Lot of questions arises which paved the way for the solutions to solve the problems. Kaizen culture should be encouraged. We must conduct Kaizen event weekly to motivate the workers by providing increments and gifts and also share the new ideas among our industrial peoples. Lean manufacturing brings less inventory, less material wastage than other methods. Flow of materials should be properly maintained. This paper discuss about how to control the rejection rate in instrument cluster assembly line by using the seven Quality control tools and the famous Kaizen (Lean technique).
1. INTRODUCTION
Now a days, business became more and more competitive. All industries are involved in continuous effort to improve their productivity and becomes in top position. In order to maximize the benefits, we need to understand the current manufacturing techniques. We must develop new ways for our firm that should be suitable and easily understandable one. Industrial people believe in customer satisfaction, so we have to hire new innovative peoples and also the hiring process must be in tough manner. We must provide learning sources which must be available to all the staffs and workers. Mass production must be replaced by Lean production. Single piece flow should be encouraged. We have to maintain the workplace in neat and clean manner. Workplace organization must be followed by all the industrial peoples. 5s workplace utilization culture must be developed. Industrial peoples involved in finding new techniques in order to reduce the rejection rate. We must conduct ‘share and learn’ session which will results in better understanding of the workers and also our firm. Here how to find the problems along with its solution in industries should be discussed. And also how improvements made in the industry in short span and how to utilize the materials and machineries in proper way are discussed here.
2. LITERATURE SURVEY
2.1. REDUCING REJECTION RATE IN SMALL SCALE MACHINING
This paper aims to identify the problem related to different products and probable solutions based on that problem. They use 7 Quality control tools to identify the causes for the problem and then they reduce it. They believe in Reduction in rejection is indirectly improving productivity and profitability of the organization [1].
2.2. REJECTION RATE REDUCED BY IMPLEMENTATION OF ROOT CAUSE ANALYSIS METHOD
First of all they developed a process flow and a full plan to move faster to find where the improvement gets ceased. After they find the root cause for the problems and develop solutions for that particular problems [2].
2.3. REDUCTION OF REJECTION OF AN AUTOMOBILE PART USING SIX SIGMA APPROACH
They tried to implement the six sigma methodology in a honing process. The Six Sigma DMAIC (define – measure – analyze – improve – control) approach has been used to find the better results. The rejection level can be reduced by implementing the step-by-step approach of Six Sigma in a manufacturing process. This will result reduce the rework and rejection rate [3].
2.4. A REVIEW ON LEAN MANUFACTURING IMPLEMENTATION TECHNIQUES
For lean implementation, A.N.Balaji and R. Sundar developed a plan which comprises buying raw materials from sellers to final finished product. They study the principles of lean manufacturing. They tried to upgrade the industrial manufacturing environment. They use Kaizen and Poka-Yoke lean concepts for waste reduction and also understood that this concepts will leads to the less inventory, increased productivity and overall organization profits becomes doubled. The production plan generated by scheduling decides service order, allocation of resources and manages queue of service request [4].
3. IDENTIFICATION OF PROBLEM
· This rejection control process is carried out at instrument cluster assembly line.
· Due to human error, machine error and also 7 wastes that generates during production process may often leads to higher rejection rate and also product quality becomes highly disappointed in nature.
· So with intent to eliminate the above problems and to improvise the production quantity and product quality, We’re dealt with this paper based on lean techniques and by using Quality control tools.
4. OBJECTIVES
· To identify major and minor errors that occurs during production line.
· To identify the root cause for rejection of products.
· To eliminate the rejection rate and to improve the product quality and hence increase the product quantity by using Lean techniques and Quality control tools.
· To control the scrap and rework.
· To provide accurate solution for process improvements.
· To make the products standardized using quality control tools.
· To increase the profit ratio and productivity ratio.
5. METHODOLOGY
· First of all, this paper begins with discussing the 7 Quality control tools and Kaizen techniques.
· Then finding the root cause for the problem based on Fish Bone Diagram and Flow chart.
· Why-why analysis is also used for finding the defects along with its causes.
· Then we have to provide suitable solution for the respective problems based on lean techniques.
The diagrammatic representation of rejection control is shown in figure 1.

Figure 1: Block diagram of Rejection control
5.1. SEVEN QUALITY CONTROL TOOLS
Flow Chart
Flow chart is one of the basic tool used to study the process in each and every flows. It shows process in step wise manner. Flow chart of material to product is discussed here. Graphical representation of the data makes it easier to understand [7].
The diagrammatic representation of flow chart is shown in figure 2.
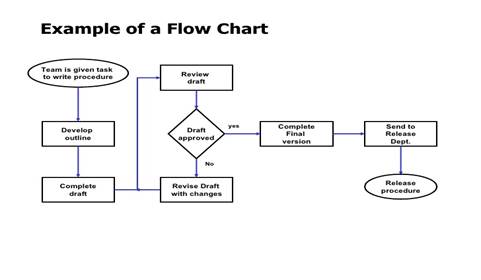
Figure 2: Example of a Flow chart
Pareto Diagram
A Pareto diagram, named after Vilfredo Pareto, an Itali1an economist, is a special type of bar graph that can be used to show frequency distribution of several relative events in cumulative manner. It is also known 80/20 rule [8]. The Pareto diagram is shown in figure 3.

Figure 3: Pareto diagram
Histogram1
Histogram is also known as frequency distribution diagram. The bar charts shows the distribution of events. Histograms are much useful in studying patterns [9]. Histograms used to compare the density distribution. It is used in various industries. Histogram is a special type of bar chart for data measurements. It is used to chart the frequency of events occurrence. The diagrammatic representation of Histogram is shown in figure 4,

Figure 4: Histogram
Check Sheet
It is a collection of data and periodically checked for maintenance purpose. The check sheet is represented in the following Table 1.
Table 1: Check sheet

Cause and Effect Diagram
This diagram used to find the several causes which leads to serious defect. It is also known as Fish Bone Diagram.
The following figure 5 represents the Cause and effect diagram.

Figure 5: Cause and Effect Diagram
Control Charts
Control charts used for studying the process which changes over time. After analyzed the results this tool is used to find out whether our product is within controlled limit or not. The control chart is shown in figure 6.

Figure 6: Control charts
Scatter Diagram
It is uses to find the relation between two variables. Two relations are exists,
• Positive relation
• Negative relation
The scatter diagram is shown in figure7.

Figure 7: Scatter Diagram
5.2. KAIZEN
Kaizen is a Japanese word which means ‘Continuous improvements’, used to reduce the rejection rate by continuous effort.
5S of KAIZEN
The below figure 8 represents the 5S concept of Kaizen.
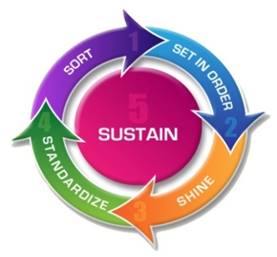
Figure 8: 5s concept of kaizen
6. PROCESS FLOW DIAGRAM
The Process flow is shown in figure 9.

Figure 9: Process Flow Diagram
7. ACTION
7.1. MAJOR DEFECTS IN INSTRUMENT CLUSTER ASSEMBLY LINE
1) Fuel Gauge not return
2) Fuel Gauge not work
3) Odometer jerky
4) Fuel Gauge sticky
5) LED not glow
• The above defects are identified by collecting data from the quality engineer.
• And also brain storming conducted from the industrial workers.
• From the above we separate major and minor errors and we have to find root cause for the errors/defects.
• Quality control tools played an important role in finding the causes for the respective defects.
7.2. ROOT CAUSE IDENTIFICATION
Why –Why Analysis Diagram
Here five different types of why arises, which critically analyze all the defects. Hence deeper the question arises we easily find the causes for the respective defects. The diagrammatic representation of why-why analysis is shown in the following figure 10.

Figure 10: Why-why analysis diagram
Fish Bone Diagram
It is used for finding various causes which associated with the respective defects. Kaizen techniques used to find the suitable causes. Further continuous effort leads to find the maximum possible causes for the problems.
IC –Instrument cluster
The Fish Bone Diagram is shown in figure 11.

Figure 11: Fish Bone Diagram
8. RESULTS AND DISCUSSIONS
Hence, we find the defects with its respective causes. Now we have to provide suitable solution for the particular defects.
The defects and solutions are listed in Table 2 as shown below,
Table 2: Defects and Solutions
|
DEFECTS |
SOLUTIONS |
|
Fuel gauge not return |
·
Damping level must be appropriate. ·
Must be dust free. |
|
Fuel gauge not work |
·
Check the resistors (broken or good one) and also check whether Fuel
Gauge is magnetised properly or not. ·
Also check the windings. ·
Ensure all the parts are assembled because human errors are inevitable |
|
LED not glow |
·
To check the connections. ·
Check the resistors. ·
Check the parts whether it is good or broken |
|
Fuel gauge sticky |
Here also we have to maintain proper damping and dust free condition. |
|
Odometer jerky |
·
Check the shafts. ·
Ensure idle gear is in good condition and free from burrs. ·
Rotor play must be in correct manner otherwise leads to vibration. ·
Also, spring tension must be in appropriate level. Drag play also
taken into consideration. |
• From the above solutions, We can reduce the rejection rate in greater amount and 90% problems are solvable in rework station itself.
• Kaizen implementation is done here and it further leads to nearly zero rejection rate.
• Here rejection rate decreases further improves the productivity ratio and cost savings in huge difference occurs.
• Better utilization of machineries and man power leads to the firm becomes in top position.
9. CONCLUSION
Quality control tools are easy to understand and easy to use. If we understood the lean techniques and Quality control tools in proper manner then we could able to solve the problem arises in each and every assembly line and easily control the rejection rate, which in turn generates a greater revenue for any organizations and productivity increases in better manner. In any organizations, continuous improvement helps in accelerated benefits to the entire people who put all their efforts to maintain the single piece flow of work. We must develop new manufacturing concepts which should be easily understandable and readily available to all the workers and higher authorities. Instead of routine work, Industrial people will try to encourage and extract new innovations from any individual person who works in the organization. The above things which leads to minimize the rejection rate and maximize the organization’s overall profits.
SOURCES OF FUNDING
None.
CONFLICT OF INTEREST
None.
ACKNOWLEDGMENT
None.
REFERENCES
[5]
P.J.
Shah and S. Makwana (2014), Application of Quality Control Tools in Taper Shank
Drills Manufacturing Industry: A Case Study.
[6]
Quality
control and Statistical Techniques used to improve Productivity and to reduce
Rejections due to Casting Defects: A Review, 2018
|
|
 This work is licensed under a: Creative Commons Attribution 4.0 International License
© IJETMR 2014-2020. All Rights Reserved.