
|
|
|
|
MODIFIED EFFECTIVE AREA APPROACH TO ESTIMATE MOTORCYCLE EQUIVALENT UNITS IN AHMEDABAD CITYKeval
D. Vyas *1
|
|
|
|


Article Citation: Keval D. Vyas, Jeel A. Anovadia, and Dr. Ashutosh K. Patel. (2021). MODIFIED
EFFECTIVE AREA APPROACH TO ESTIMATE MOTORCYCLE EQUIVALENT UNITS IN AHMEDABAD
CITY. International Journal of Engineering Technologies and Management Research,
8(4), 6-16. https://doi.org/10.29121/ijetmr.v8.i4.2021.904
Published Date: 12 April 2021
Keywords:
Motorcycle
Equivalent Unit
Mixed Traffic
Urban Road
Effective Area
Ahmedabad City
ABSTRACT
This paper presents a methodology for estimation of Motorcycle Equivalent Units (MEU) in mixed traffic flow for motorcycle dominated traffic with increased accuracy by considering dynamic characteristics of subject vehicles, like speed and effective area. Besides, this increased accuracy is the result of the inclusion of speed of adjacent motorcycles in the form of speed ratios to estimate the effective area required by the subject vehicle at a particular speed. The effective area for each sample is computed with consideration of the effective dimensions and speed of that subject vehicle and its adjacent motorcycles on both sides in the proposed methodology. Two mid-block sections of urban roads in Ahmedabad city were selected for field data collection by videography method in this case study. The collected field data was analysed through Speed Estimation from Video Data (SEV) software. A table of classified speed ratios is also presented to derive an idea regarding the magnitude of change in lateral clearances of subject vehicles. The MEU values obtained for cars, motorcycles, rickshaws, buses, Light Commercial Vehicles (LCV), and bicycles were 3.02, 1.00, 1.84, 9.82, 6.2, and 1.9 respectively. Further, the proposed model was compared with a previously developed model to justify the increase in accuracy and to observe the variations in MEUs. The values estimated can be used to establish speed-flow relations, measure roadway capacity in urban roads, analyse the level of service in order to plan suitable traffic control and regulatory measures.
1. INTRODUCTION
In
Ahmedabad, total registrations of the two-wheeler vehicles (since 2005) as of
November 2020 were recorded 1,948,844 units as opposed to cars recorded as only
594,679, wherein motorcycles being more than thrice the number of cars. The
growth rate in registrations of two-wheelers in 2019-2020 was 14.93% and that
of cars was -0.94%, which indicates the rise in ownership of two-wheeler
vehicles in Ahmedabad city.[1]It
has been observed that registrations of two-wheeler vehicles in the city are
increasing annually since the year 2000. Reasons contributing to this are its
affordability, high mileage, economical maintenance, manoeuvrability, etc. In
general, total traffic in Ahmedabad comprises about 70% of two-wheeler
vehicles. The concept of Passenger Car Equivalent (PCE) was introduced in
Highway Capacity Manual in 1965 and since then, a lot of research has been
conducted for estimating PCE or Passenger Car Unit (PCU) values for different
roadway conditions. However, PCU values are not suitable in Indian urban roads
due to the heterogeneous mix of traffic, absence of lane discipline, and
predominance of two-wheelers.
Traffic
condition in India is very different from the
developed countries. The latter is dominated by passenger cars which can be
termed as almost homogeneous traffic, whereas the former is composed of
different classes of vehicles, particularly in urban roads, dominated by
motorcycles (a majority in the range of 100cc to 150cc). In this context, the
category of motorcycles is comprised of geared bikes, electric bikes,
non-geared scooters, geared scooters, and mopeds. There exists a wide range of
static and dynamic characteristics in vehicles on roads occupying the same
right of way; thus, resulting in an “unsynchronized movement” (Sai Kiran and
Verma 2016). Most of the studies are carried out in developed countries, and
there exist fewer studies taking into consideration the mixed nature of traffic
as observed in India. While dealing with traffic comprising of different
vehicle types such as motorized two wheelers, motorized three wheelers and
non-motorized vehicles, it is thus essential to include area of the vehicle to
represent the realistic traffic behaviour (Mallikarjuma
and Rao 2006). Very little research work has been done
to include the influence of adjacent vehicles in the estimation of area
occupancy of subject vehicles.
It appears more relevant to use a motorcycle as the
base vehicle for equivalency factors. The dominance of motorcycles in a traffic
flow affects the traffic condition differently than passenger cars. Due to
their easy maneuverability, “motorcycles may reduce
the speed of other modes and make the traffic congested owing to their
superiority in numbers” (Minh et al. 2005). Further, the smaller size of
motorcycles reflects “gap-filling” behaviour rather than the “car-following”
behaviour. The problem of measuring the traffic capacity of roads with mixed
nature of traffic is often resolved by converting all classes of vehicles into
a common equivalent unit.
The objective of this study is to propose a modified
methodology for the estimation of motorcycle equivalent units for all the
classes of vehicles for mixed traffic flow with speed and effective area
parameters. Effective area is the area required by a vehicle to maintain its
desired speed on a road. Moreover, this study also compares the results with an
existing method that does not consider the speed of adjacent motorcycles in its
model.
1.1. LITERATURE
REVIEW
Passenger car equivalents have been determined by
various methods, like the headway method, the multiple linear regression
method, the simulation method, the modified density method, etc. Nevertheless,
there is no “correct” method to estimate PCUs, but each method helps in
understanding the effects of the subject vehicle on traffic from a different
perspective (Sai Kiran and Verma 2016). Moreover, The Indian Road Congress IRC
106-1990 recommends PCU factors for various types of vehicles on urban roads in
India, which are widely adopted in Indian urban road conditions.
Chandra and Kumar (2003) estimated the
values of PCU for various classes of vehicles in mixed traffic conditions in
India. Mean speed and their respective projected area on the ground were used
in their model for estimating PCU values. PCU values for different vehicles
under mixed traffic situations are directly proportional to the speed ratio and
inversely proportional to the space occupancy ratio with respect to passenger
cars (Chandra and Kumar 2003).
![]() (1)
(1)
Where, Vc and
Vi = mean speed for cars and type i
vehicles respectively, and Ac and Ai = their
respective projected rectangular areas (length
×width) on the road. Nonetheless,
projected areas here are static values, but in the actual scenario, the area
requirement by each vehicle on road depends on several factors such as speed of
the subject vehicle, speed of the surrounding vehicles, driver characteristics,
etc.
Lan and Chang (2003) developed a particle-hopping
model with Cellular Automata to describe the motorcycles’ behaviour in a mixed
traffic flow with cars and motorbikes on 2.5m and 3.75m lanes in Taipei. In
their findings, the motorbike equivalents ranged from 2.63 to 5.27 for 10%~100%
of car mixes. For motorcycle equivalent units, Minh et al. (2005) provided a
thorough analysis of motorcycle behaviour and operation by videography method
on a few of the roads having significant motorcycle proportion in Hanoi,
Vietnam; even so, the limitations of this study were the same as in Chandra and
Kumar (2003). Moreover, Cao et al. (2007) studied the impacts of effective
spaces on speeds of various vehicles. The effective space approach is used here
instead of the projected area to estimate Dynamic Motorcycle Unit (DMCU)
values. The relationship between speed and effective space for each class of
vehicle is established for three locations in Hanoi city, Vietnam. Nguyen and
Montgomery (2007) applied the concept of Motorcycle Units (MCU) at
signalized intersections in Hanoi city, Vietnam. They examined the variation of
saturation flow and vehicle equivalency factors in motorcycle dominated traffic
conditions.
Furthermore, Asaithambi and
Mahesh (2016) adopted a similar methodology for urban roads in India using the
effective space approach. The study was conducted on mid-block sections of
four-lane divided urban roads in Chennai and Mangalore and these values were
validated with previously developed methods. Prahara
et al. (2018) analysed the traffic in Jakarta for MCU values with
the effective space approach similar to Asaithambi and Mahesh (2016).
Cao and Sano (2012) modified the method for
estimating more accurate values of MEUs in mixed traffic flow considering the
characteristics of moving vehicles, such as speed and effective space. It was
suggested that the effective space is affected by size of the subject vehicle
and motorcycles on its left and right side; hence, it was assumed that the
lateral width of subject vehicle is a function of the lateral width of
motorcycles and the total physical size of subject vehicle and motorcycles.
Pooja et al. (2018) adopted the effective area approach to estimate
dynamic PCU values for mixed traffic conditions in India. Six distinct cases
were considered on a roadway for estimation of effective areas. Lateral
clearance between the subject vehicle and adjacent vehicles was distributed
using the similar method as in Cao and Sano (2012) i.e. by size ratio. Srikanth (2019) used space occupancy
method to estimate dynamic PCUs in Ongole city. The
space headway obtained for each vehicle for a particular speed range was added
to the length of the vehicle to obtain effective length of the vehicle;
however, 1.1 times the width of the vehicle was assumed to be the effective
width.
As of above, these methods for estimation of MEUs use
a similar equation that is modified from the model of Chandra and Kumar (2003)
for estimation of PCU values which considers the area occupancy criteria
in its model. Nevertheless, efforts have been made previously to determine the
area occupancy with different approaches with a view to estimating it
accurately to the corresponding speed of the vehicle. Therefore, this paper
will support the estimation of the effective area of the subject vehicle with
the inclusion of the speeds of adjacent motorcycles to the subject vehicle and
compare the parameters obtained with previous method by Cao and Sano (2012)
employed in the estimation of MEUs for mixed traffic conditions dominated by
motorcycle traffic as in Indian urban roads.
2.
MATERIALS
AND METHODS
“The definition of an MEU is the number of motorcycles
that can be displaced for one vehicle of a specified type running at the speed
of that vehicle” (Cao and Sano 2012). The modified equation adopted by Cao and
Sano (2012) was adopted here to estimate MEUs.
![]() (2)
(2)
Where, MEUk =
MEU of type k vehicle; ![]() mc,
mc, ![]() k= mean speed of motorcycles and type k vehicle
respectively in (m/s) and
k= mean speed of motorcycles and type k vehicle
respectively in (m/s) and ![]() mc,
mc, ![]() k= mean effective area for motorcycles and type k
vehicle respectively in (m2).
k= mean effective area for motorcycles and type k
vehicle respectively in (m2).
The
effective area required by a vehicle moving at a certain speed is assumed to be
an imaginary rectangle formed around the subject vehicle in
order to maintain its speed. This area is considered
to be dynamic, and it depends on the speed and size of the subject
vehicle and adjacent motorcycles, driver characteristics, etc. The effective
area of a subject vehicle is illustrated with a bold line in figure 1, where
surrounding vehicles are considered as motorcycles.
From figure 1,
Effective area Sk = Le
× We
Where,
Effective length, Le=
Length of subject vehicle L + Head clearance Hc
Effective width, We
= Dk(L) + Dk(R) + Width of subject vehicle W
Dk(L) = Part of
lateral clearance on left side for subject vehicle
Dk(R) = Part of
lateral clearance on right side for subject vehicle
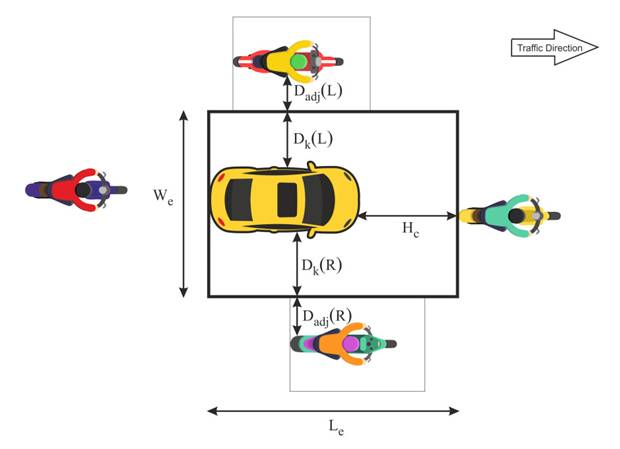
Figure 1 : Effective Area of a Subject Vehicle
Effective length (Le)
can be calculated simply by addition of head clearance (Hc) to the average
length of the subject vehicle, whereas the measurement of effective width poses
a problem as it differs for each vehicle under consideration because there are
certain factors making it dynamic. Particularly, the values of Dk(L) and Dk(R) are variable factor for
each sample. “In fact, the occupied space of a vehicle is affected by the size
of the subject vehicle and the motorcycles on its right and left side” (Cao and
Sano 2012). In addition to the size ratio, the speeds of adjacent
motorcycles of the subject vehicle have been considered in this methodology by
incorporating speed ratio (Vk/Vadj).
Only those samples with motorcycles as surrounding vehicles have been
considered because the traffic is motorcycle dominated; further, consideration
of other categories as adjacent vehicles will disrupt the uniformity in
effective area calculation by changing the size ratio for distribution of
lateral clearance. It is assumed that the lateral clearance of a subject
vehicle is the function of lateral clearance of the adjacent motorcycle and the
physical sizes of subject vehicle and adjacent vehicles along with their
corresponding speeds. Therefore, the equation to determine the lateral
clearances is obtained as follows:
![]() (3)
(3)
Where,
Dk = Part of lateral
clearance for the subject vehicle from the total lateral clearance.
Dadj = Part of lateral clearance for adjacent motorcycle
from the total lateral clearance.
Lk, Wk = Physical length
and width as projected area of subject vehicle.
Ladj, Wadj = Physical length
and width as projected area of adjacent motorcycle.
Vk, Vadj = Speed of
subject vehicle and adjacent motorcycle respectively.
D = Overall lateral
clearance
From figure 1,
![]() (4)
(4)
Substituting equation (3) in (4),
![]() (5)
(5)
Substituting equation (5) in (4),
![]() (6)
(6)
Equation (6), is applied to
calculate the values of lateral clearances for subject vehicle i.e. Dk(L) and Dk(R). The average vehicle
dimensions of various categories of vehicles are adopted from Chandra and Kumar
(2003) since they have been used in the studies of various developing
countries with mixed traffic and are suitable to Indian conditions. Traffic in
Ahmedabad city is mixed in its nature; it is imperative to identify all the
classes of vehicles present at the study location in considerable proportion.
Hence, the mentioned classes and types of vehicles in table 1 were recognized
after the classified volume study and only those classes were included for data
analysis.
Table 1: Average
Vehicle Dimensions
|
|
Vehicle Classes |
Types Included |
Lk (m) |
Wk (m) |
|
1 |
Bicycle |
Bicycles |
1.9 |
0.45 |
|
2 |
Bus |
Buses |
10.1 |
2.43 |
|
3 |
Car |
Cars, Vans, Jeeps |
3.72 |
1.44 |
|
4 |
LCV |
Tempos, Mini-buses |
6.1 |
2.1 |
|
5 |
Motorcycle |
Motorcycles, Mopeds, Scooters |
1.87 |
0.64 |
|
6 |
Rickshaw |
Rickshaws, 3-Wheeler tempos |
2.7 |
0.95 |
2.1. DATA COLLECTION
Primarily, the site selection criteria were determined and the ideal sites were selected based on
compliance with these criteria. Following criteria were used to identify
appropriate road stretch in Ahmedabad city:
·
Both the ends of trap length fairly
away from any intersection or diversion.
·
Presence of a high building to mount video camera
setup.
·
Minimum obstruction to traffic flow due to speed
breakers, parking, bus stops etc.
·
Major urban road with high traffic volume during peak
hours.
·
Considerably mixed traffic with adequate percentage of
motorcycles.
·
Plain gradient and fairly straight
road.
Two mid-block sections were selected in Kalupur and Nikol, Kalupur Road (Kalupur Railway
Station to Kalupur Darwaja) and Nikol
Road (Thakkarbapa Nagar Flyover to Nikol Lake). Both of these road
stretches were two-lane roads in the direction of traffic being studied. The
data was collected by adopting videography method in dry weather and during
evening peak hours i.e. 5:45-8:15 p.m. on a working weekday.
Motorcycles were found to be dominating in their proportion in the traffic flow
at both sites. The data collection was performed by use of a video camera
mounted on a tripod on the fourth floor of a building in the vicinity of the
road. A trap length of 25m was considered on the road stretch. The data
required for further analysis consists of classified volume count of traffic,
speed and effective area of various samples, and road measurements.
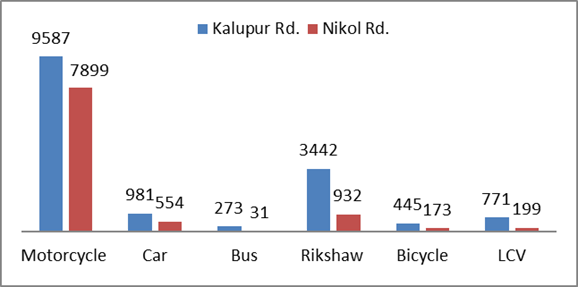
Figure 2 : Traffic
Composition at both study locations
2.2. DATA ANALYSIS
To analyse the traffic data collected in the video
format, software namely SEV.exe was utilized. This software was developed in
the traffic laboratory for this specific purpose as described in Minh et al.
(2005) Four base points i.e. four corners of the
trap length on the road stretch are to be marked; it gives readings for speed
and distance co-ordinates for each sample vehicle. Also, it easily converts
screen co-ordinates into roadway co-ordinates, which are useful in calculating
effective area around the subject vehicle. Any reading can be measured several
times; thus, it can be verified. The speed of each sample vehicle was
calculated at 0.5 sec interval.
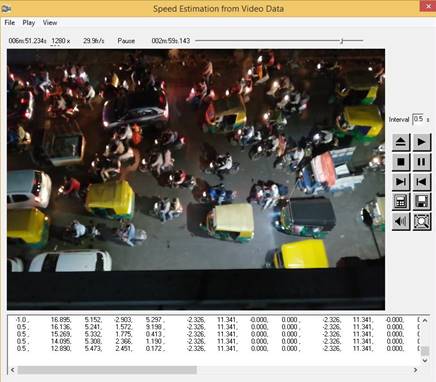
Figure 3: SEV
software screen
3.
RESULTS
AND DISCUSSIONS
From the data of speeds and effective areas of each
category of vehicles, a graph showing the relationship between these two
variables has been plotted. Non-linear equations with coefficients of
determination between these variables are also expressed by non-linear
regression analysis for all the categories of vehicles at both locations.
Further, there are two graphs plotted for each category of vehicles to compare
the existing method by Cao and Sano (2012) to the proposed method
for estimating effective areas.
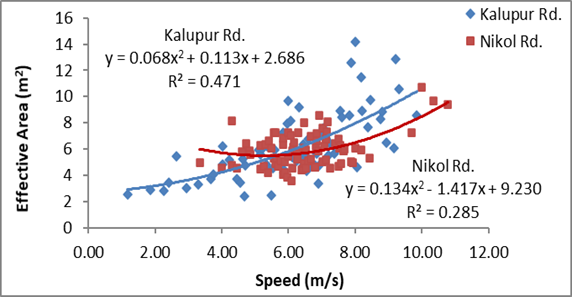
Figure 4: Relation
between speeds and effective areas for motorcycles by existing method
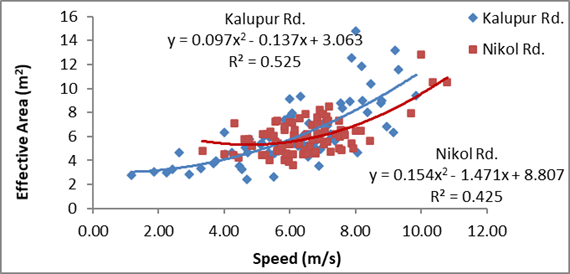
Figure 5: Relation
between speeds and effective areas for motorcycles by proposed method
The association of speeds of motorcycles with their
corresponding effective areas has increased when effective areas are estimated
with inclusion of speeds of adjacent motorcycles, from figure 4 and 5. This
increase in their relationship can be noted by the increase in the coefficient
of determination by the proposed method. The R2 value for Nikol road is comparatively less and the reason for this
can be seen in figures 4 and 5; there is a scattered cluster of readings of
effective areas in a small range of speeds unlike in Kalupur
road, where the readings of effective areas are distributed in a comparatively larger range of speeds.
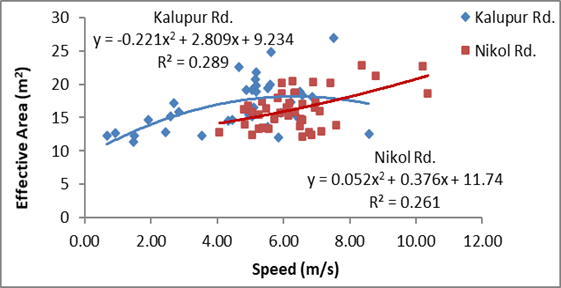
Figure 6: Relation
between speeds and effective areas for cars by existing method
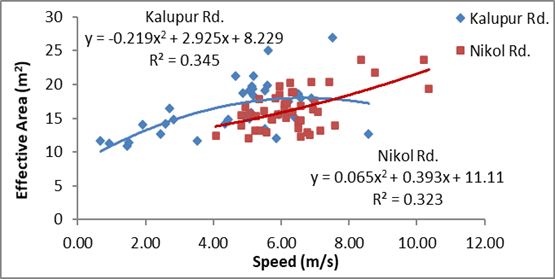
Figure 7: Relation
between speeds and effective areas for cars by proposed method
From figures 6 and 7, similar to
motorcycles, there is a fair increase in the correlation between both variables
by proposed method. Further, the variation in average prevailing speed of cars
at both locations can be noticed from the graphs.
There is a significant increase in R2
values for rickshaws by proposed methodology, from figures 8 and 9. Also, the
high number of rickshaws at Kalupur road can be
attributed to the presence of a major railway station and high population
density at the location. The gap in speed range of rickshaws at Nikol road can be observed in the figure. The reason for
this may be attributed to the time at which the samples were observed i.e. peak hour and off-peak hour.
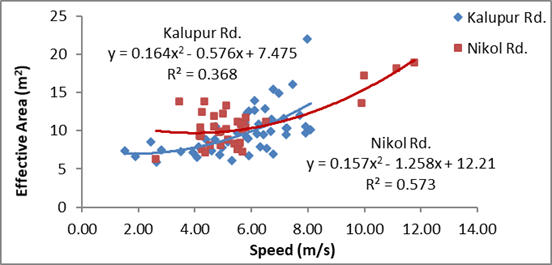
Figure 8: Relation
between speeds and effective areas for rickshaws by existing method
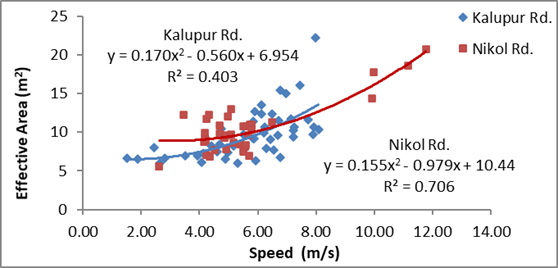
Figure 9: Relation
between speeds and effective areas for rickshaws by proposed method
Table 2: Relationship
summary of bus, LCV, and bicycle
|
Class |
Location |
Non-linear
relation |
R2
Value |
R2
Value* |
|
Bus |
Kalupur Road |
y = -0.253x2
+ 7.429x + 20.36 |
0.449 |
0.439 |
|
Bus |
Nikol Road |
y = 1.367x2
- 10.60x + 73.17 |
0.597 |
0.565 |
|
LCV |
Kalupur Road |
y = 1.276x2
- 12.08x + 56.05 |
0.485 |
0.479 |
|
LCV |
Nikol Road |
y = 1.084x2
- 7.350x + 42.30 |
0.659 |
0.613 |
|
Bicycle |
Kalupur Road |
y = -0.634x2
+ 4.078x - 1.452 |
0.251 |
0.150 |
|
Bicycle |
Nikol Road |
y = 0.24x2
+ 0.538x + 2.122 |
0.268 |
0.217 |
*By existing
methodology of Cao and Sano (2012)
Figures of the relationship between the speeds and the
effective areas for buses, LCVs, and bicycles are not illustrated in this
paper. Therefore, a brief summary of their
relationship by the proposed method is given in table 2. From these
relationships, it can be observed that there is a fair increase in R2
values in every category by the proposed methodology, which indicates that the
association of speeds with effective areas has increased by this method and
that the speed of adjacent motorcycles affect the
effective area, and it should be taken into account for estimation of dynamic
MEUs. Even a minor increase in accuracy would result in significant variation
in traffic capacity when estimated with these modified equivalency factors.
Table 3 indicates the speed variations between the subject vehicle and its
adjacent motorcycles by the speed ratios for each class of vehicles at both
study locations. With these speed ratios, a notion of the approximate magnitude
of change in lateral clearance for a subject vehicle (Dk) can be interpreted. An increase or decrease in
effective areas, by the proposed method, is a result of an increase or decrease
respectively in speed ratios from the numerical value ‘1’.
Table 3: Speed
Ratios (Vk/Vadj)
|
Class |
Speed Ratios for Kalupur Rd. |
Speed Ratios for Nikol Rd. |
||||
|
Max. |
Min. |
Avg. |
Max. |
Min. |
Avg. |
|
|
Car |
1.56 |
0.31 |
0.81 |
2.11 |
0.42 |
1.01 |
|
Motorcycle |
1.95 |
0.45 |
1.01 |
2.02 |
0.42 |
1.06 |
|
Rickshaw |
1.97 |
0.43 |
0.88 |
1.97 |
0.54 |
0.86 |
|
Bus |
2.46 |
0.35 |
1.08 |
1.71 |
0.38 |
0.86 |
|
LCV |
2.48 |
0.45 |
0.95 |
3.80 |
0.55 |
1.00 |
|
Bicycle |
0.87 |
0.15 |
0.49 |
2.58 |
0.39 |
0.72 |
The MEU values are estimated from the mean speed and
mean effective area by equation (2). Table 4 depicts the values of MEUs for
each category of vehicles at both the study locations. Also, the final MEU
column presents the MEU values obtained by combining the data obtained from
both locations. MEU1 and MEU2 indicate the values obtained by the existing
model and proposed model respectively.
Table 4: Comparison
of results of MEUs by existing and proposed model
|
Class |
Total Samples |
Kalupur Rd. |
Nikol Rd. |
Final |
|||
|
MEU1 |
MEU2 |
MEU1 |
MEU2 |
MEU1 |
MEU2 |
||
|
Car |
80 |
3.55 |
3.44 |
2.82 |
2.77 |
3.09 |
3.02 |
|
Motorcycle |
160 |
1.00 |
1.00 |
1.00 |
1.00 |
1.00 |
1.00 |
|
Rickshaw |
84 |
1.74 |
1.69 |
2.11 |
2.01 |
1.91 |
1.84 |
|
Bus |
39 |
8.64 |
8.61 |
11.92 |
11.64 |
9.97 |
9.83 |
|
LCV |
44 |
5.36 |
5.32 |
7.42 |
7.27 |
6.29 |
6.20 |
|
Bicycle |
28 |
2.15 |
1.62 |
2.42 |
2.21 |
2.29 |
1.90 |
Interestingly, the MEU values for bicycles are greater
than that of the motorcycles. This is because the bicyclists usually travel
near the edge of the road; therefore, the influence of motorcycles on their
effective area is minuscule. In addition, when the mean speed of any subject
vehicle is less and the mean effective area is more, there will be a greater
MEU value. A decrease in the effective area ratio, as compared to the effective
area ratio computed without consideration of speed of adjacent motorcycles,
would result in a decrease in the MEU value and vice versa, from equation (2).
The same explanation can be used to comprehend the extensive variation of MEU
values of buses at both locations. According to the proposed method, the
effective area of a subject vehicle will decrease (when compared to the
existing method) if the speed of adjacent motorcycles is higher than that of
the subject vehicle and vice versa; if the speed of the adjacent motorcycle is
greater than the speed of the subject vehicle, it would result in a lower speed
ratio (less than 1), consequently reducing the effective area, as per the
proposed model, which otherwise would have been invariable to the effect of
speed of adjacent motorcycles. Also, the effective area of a subject vehicle
changes in the proposed model only due to a change in lateral clearance of the
subject vehicle (Dk),
which would depend ultimately on overall lateral clearance (D), the size ratio, and the speed ratio,
from equation (6). In the case of vehicles of same class, the size ratio would
be constant and a higher effective area would imply
lower speed of adjacent motorcycles and/or greater overall lateral clearance (D).
Driver characteristics, traffic volume, road geometric
characteristics, and other local traffic conditions may also affect the
effective areas of subject vehicles, but they are not included in the scope of
this study. Thus, the model can be modified further to consider these aspects so as to increase the accuracy forward. More data from
different spots and a larger dataset can be incorporated for increasing the
accuracy pertaining to the location under consideration.
4.
CONCLUSION
The model of estimating PCU in mixed traffic
conditions was modified in previous studies to estimate the MEU of various
classes of vehicles in mixed traffic conditions on urban roads. Hence, the
fundamental objective of this paper is to propose a model to estimate these
equivalency factors with increased accuracy by the inclusion of speeds of
adjacent motorcycles around the subject vehicle. These MEU values determined
can be used to estimate the capacity of urban roads with mixed traffic
conditions like in Ahmedabad city by converting different classes of vehicles
into a unique factor in terms of motorcycles.
There is a fair increase in the R2 value for each class when effective areas are computed with the inclusion of speed of adjacent motorcycles; hence, it should be considered while estimating effective areas of a subject vehicle. The MEU values obtained from this study for cars, motorcycles, rickshaws, buses, LCVs, and bicycles were 3.02, 1, 1.84, 9.83, 6.2, and 1.9 respectively. The MEU values obtained here by the proposed model are smaller than the previous model of Cao and Sano (2012); which reveals that the ratios of mean effective area are necessarily smaller and the variation in the effective area of each sample is a direct result of speed ratios included in the model. A major limitation of the proposed methodology is that it can only be applied when the subject vehicle and the surrounding motorcycles are in motion. Moreover, the values of speeds and effective areas have been calculated from a video using SEV software and it is arduous to measure the actual values of every sample to its exactness; therefore, the relative error or the percentage error is unknown and not mentioned.
RESEARCH DATA
Vyas, Keval; Anovadia, Jeel (2021), “Effective Area Parameters”,
Mendeley Data, V1, http://dx.doi.org/10.17632/v5mgr25w2n.1
SOURCES OF FUNDING
This research received no specific grant from any funding agency in the public, commercial, or not-for-profit sectors.
CONFLICT OF INTEREST
The author have declared that no competing interests exist.
ACKNOWLEDGMENT
We express our humble gratitude to Dr. Chu Cong Minh for providing us access to the SEV software. We are immensely thankful to Dr. Gaurang J. Joshi, Dr. Harish R. Varia, Prof. Rahul R. Sharma, and Prof. Krunal S. Patel for guiding us with their valuable feedbacks and suggestions. We also appreciate the assistance of Ahmedabad Regional Transport Office, Government of Gujarat by supporting us with the vehicle registration data of Ahmedabad city.
REFERENCES
[1] Asaithambi, G., & Mahesh, A. (2016, January
12). Estimation of Motorcycle Unit for Motorcycle Dominated Mixed Traffic on
Urban Roads in India. Transportation Research Board 95th Annual Meeting,
Washington DC.
[2] Cao, N. Y., & Sano, K. (2012).
Estimating Capacity and Motorcycle Equivalent Units on Urban Roads in Hanoi,
Vietnam. Journal of Transportation Engineering, 138(6), 776–785.
https://doi.org/10.1061/(ASCE)TE.1943-5436.0000382
[3] Cao, N. Y., Sano, K., & Minh,
C. C. (2007). Dynamic Motorcycle Unit and Mean Stream Speed Under Mixed Traffic
Conditions on Urban Roads. Journal of the Eastern Asia Society for
Transportation Studies, 7, 2439–2453. https://doi.org/10.11175/easts.7.2439
[4] Chandra, S., & Kumar, U.
(2003). Effect of Lane Width on Capacity under Mixed Traffic Conditions in
India. Journal of Transportation Engineering, 129(2), 155–160.
https://doi.org/10.1061/(ASCE)0733-947X(2003)129:2(155)
[5] Lan, L., & Chang, C.-W.
(2003). Motorbike’s moving behaviour in mixed
traffic: Particle-hopping model with Cellular Automata. Journal of the Eastern
Asia Society for Transportation Studies, Vol. 5, Pp. 23-37.
[6] Mallikarjuna, C., & Rao, K. R. (2006).
Area Occupancy Characteristics of Heterogeneous Traffic. Transportmetrica,
2(3), 223–236. https://doi.org/10.1080/18128600608685661
[7] Minh, C. C., Sano, K., & Matsumoto,
S. (2005). The Speed, Flow and Headway Analyses of Motorcycle Traffic. Journal
of the Eastern Asia Society for Transportation Studies, 6, 1496–1508.
https://doi.org/10.11175/easts.6.1496
[8] Nguyen, H., & Montgomery, F.
(2007). Different Models of Saturation Flow in Traffic Dominated by
Motorcycles. Journal of the Eastern Asia Society for Transportation Studies, 7,
2381–2395. https://doi.org/10.11175/easts.7.2381
[9] Pooja, R., Shahana,
A., Asaithambi, G., & Ravi Shankar, A. (2018,
January). An Approach for Estimation of Passenger Car Unit Values of Vehicles
Based on Influence of Neighboring Vehicles. Transportation Research Board
Annual Meeting, Washington D.C., USA.
[10]
Prahara, E., Nataatmadja,
A. D., & Harviani, L. (2018). Analysis of
motorcycle unit (MCU) for motorcycle- dominated traffic with effective space
approach (case study: Jalan Raya Lenteng Agung Barat
dan Jalan Teuku Nyak Arief). IOP Conference Series: Earth and Environmental
Science, 195, 012014. https://doi.org/10.1088/1755-1315/195/1/012014
[11]
Sai
Kiran, M., & Verma, A. (2016). Review of Studies on Mixed Traffic Flow:
Perspective of Developing Economies. Transportation in Developing Economies,
2(1), 5. https://doi.org/10.1007/s40890-016-0010-0
[12]
Srikanth,
S. (2019). Space Occupancy Method for Estimation of PCUs of Vehicles at
Different Speed and Flow Ranges on Urban Road. SAMRIDDHI : A Journal of
Physical Sciences, Engineering and Technology, 11(02), 77–84.
https://doi.org/10.18090/samriddhi.v11i02.1
[13]
The
Indian Road Congress. (1990). Guidelines for Capacity of Urban Roads in Plain
Areas, IRC: 106-1990. IRC: 106-1990.
[14]
Transportation
Research Board. (1965). Highway Capacity Manual, Special Report, 87.
[1] As
per the traffic data
acquired from the Ahmedabad Regional Transport Office (ARTO), Government of
Gujarat
|
|
 This work is licensed under a: Creative Commons Attribution 4.0 International License
© IJETMR 2014-2020. All Rights Reserved.