
|
|
|
|
Affecting of E-Commerce Websites on Customer Satisfaction: A Case Study of Home Products Users
Tuneklao Sinhaseni 1![]()
![]() , Chompu
Nuangjamnong 2
, Chompu
Nuangjamnong 2![]()
![]() , Kitikorn Dowpiset 2
, Kitikorn Dowpiset 2![]()
![]()
1 Master
of Business Administration, Graduate school of Business and Advanced Technology
Management, Assumption University of Thailand, Bangkok, 10240, Thailand
2 Graduate
School of Business and Advanced Technology Management, Assumption University of
Thailand, Bangkok, 10240, Thailand
|
|
|
ABSTRACT |
|
|
This study
aims to find out how the website's design, the quality of the information,
security, responsiveness, and trust all affect customer satisfaction in the
context of e-Commerce website of home product users in the Thai population.
The objectives of this study are to investigate web design, information
quality, security, responsiveness, and trust toward customer satisfaction in
e-Commerce websites in home products. Data was gathered through a customers
of home products thru online survey, and 385 participants response from home
product user were analyzed using the JAMOVI program. The research results
indicate that web design, security, responsiveness, and trust are crucial
factors affecting customer satisfaction towards e-Commerce websites of home
products. However, information quality has insignificant affecting on
customer satisfaction in e-Commerce websites of home products. The findings
in this study suggest that e-Commerce websites should have a good design
website of their home product contents accurately and quickly, responding to
the customers properly. |
|||
|
Received 13 April 2023 Accepted 14 May 2023 Published 29 May 2023 Corresponding Author Tuneklao
Sinhaseni, tuneklaosinhaseni@gmail.com DOI 10.29121/ijetmr.v10.i5.2023.1329 Funding: This research
received no specific grant from any funding agency in the public, commercial,
or not-for-profit sectors. Copyright: © 2023 The
Author(s). This work is licensed under a Creative Commons
Attribution 4.0 International License. With the
license CC-BY, authors retain the copyright, allowing anyone to download,
reuse, re-print, modify, distribute, and/or copy their contribution. The work
must be properly attributed to its author.
|
|||
|
Keywords: Web Design,
Information Quality, Security, Responsiveness, Trust, Customer Satisfaction |
|||


1. INTRODUCTION
Thailand is placed ninth with a 10% share of global e-commerce sales in 2021, and 74% of its people between the ages of 16 and 64 have bought something online Boxme Global (2021). The Thai government came up with a two-step plan to grow e-commerce. They think that by 2027, e-commerce sales will bring in 7.1 trillion Baht Arunmas (2022). According to E-Marketer (2017), 188% of Thais use cell phones, and 90% use smartphones to access the internet ETDA. (2020). All of these things show that e-commerce will continue to grow in Thailand.
Given the rapid growth of e-commerce in Thailand, it is important to know how pleased customers are with their interactions with e-commerce websites and what makes them happy Reichheld and Schefter (2000). Studies show that 35–40% of e-commerce sales come from people who have bought from the same company Rosen (2001). In a study from 2007, Lin looked at how style, interactivity, information, security, responsiveness, trust, and empathy affect how happy people are with websites. A previous study examining how website quality affects customer satisfaction found that Lin (2007), Dhingra et al. (2020).
Even though Thailand has a lot of promise for e-commerce, not enough research has been done on how website design affects customer satisfaction. No studies have been done before on how a website's design, interactivity, information, security, responsiveness, and trust affect customer satisfaction in Thailand.
Statista says that the home goods market is a big part of the retail market and will bring in $327.68 billion in the United States in 2020 Statista. (2022). The rise of e-commerce has changed the way people shop for home goods in a big way. In 2020, online sales of home items, decorations, and appliances will increase by 44.4% Digital Commerce 360. (2022). Because of this, businesses that want to succeed in this competitive market need to know how e-commerce affects customer satisfaction in this industry.
Previous research has highlighted the need for a better understanding of the impact of e-commerce on customer satisfaction Fan et al. (2013), Mitchev et al. (2022), Mitchev and Nuangjamnong (2021). This study aims to fill this gap in the literature by investigating the factors that influence customer satisfaction with e-Commerce websites in the context of home product users. By focusing on the home products industry, this study will provide insights that can be applied to businesses operating in this sector.
Since 2020, the e-commerce industry has grown quickly. One reason is that digital funds have become safer and easier to use Zhang and Nuangjamnong (2022), Zhang and Nuangjamnong (2022). Major e-commerce sites like Amazon and eBay are now the most popular sites in the world. Online buying in Thailand is mostly done through Lazada, Shopee, HomePro, DoHome, etc. They can also find home product sellers on social media sites like Facebook, Instagram, and Line. Even though there is not much competition in the Thai e-commerce market, these sites still let people buy home goods. But there aren't many studies on how e-commerce sites affect customer satisfaction and trust in the company, especially in Thailand. Site design is an important part of e-commerce websites because it serves as the company's front page and plays a big role in getting and keeping people. But no study has examined how site design affects customer satisfaction in Thailand. Given how important customer experience is to sales, it is important for e-commerce companies in Thailand to know how web design affects customer satisfaction The Top eCommerce & Shopping Websites in Thailand (2023).
1.1. Objectives of study
This study aims:-
1) To describe web design, information quality, security, responsiveness, trust and customer satisfaction in home products.
2) To test affecting of web design, information quality, security, responsiveness, trust on customer satisfaction in home products.
1.2. Research
questions
These questions align with the study's objectives as following below:
1) What is web design, information quality, security, responsiveness, trust, and customer satisfaction that affect home products through e-Commerce?
2) Have
web design, information quality, security, responsiveness, and trust affected
customer satisfaction affect home products through e-Commerce?
This study can help home items e-commerce enterprises increase revenue and consumer satisfaction. Businesses can increase sales and profits by determining which aspects of a website's design affect client satisfaction. Improving customer satisfaction can lead to loyal consumers and positive word-of-mouth advertising, which can help e-commerce enterprises even more. Thus, this study improves more than only the user experience. It can also boost Thai home product e-commerce firms.
This study examines Thai home items e-commerce websites. This business's customer satisfaction will discuss web design, information quality, security, timeliness, and trust. Quantitative research is planned. Thai e-commerce home product purchasers will be surveyed online. To determine if age, gender, and wealth affect customer satisfaction, the study will also examine responses. Since trust is essential to long-term consumer connections in e-commerce, the study will also investigate the relationship between customer satisfaction and trust. Thai home products e-commerce enterprises will benefit from the study. They will demonstrate how website design may boost customer satisfaction and trust.
The study has flaws. First, the study will only examine the Thai home products business; therefore, its findings may not apply to other industries or regions. Second, online poll data may be biased or inaccurate. Third, the cross-sectional study will make linking independent variables to consumer satisfaction more challenging. Fourth, the study will only examine a few website design aspects, which may not cover all e-commerce customer satisfaction factors. The survey will examine consumer satisfaction. Customer loyalty and repeat purchases will not be considered. Despite its flaws, the study will teach us much about e-commerce customer satisfaction, particularly in Thailand's home products market.
2. LITERATURE REVIEW AND HYPOTHESES DEVELOPMENT
2.1. Customer Satisfaction
Customers are happy when their expectations for the buying process and the service they receive after the sale are met, according to Zhang and Nuangjamnong, (2022). Because most things sold through e-Commerce—books, CDs, flowers, electronics, software, etc.—are standardized products, applying this approach to e-Commerce immediately can be challenging. However, with e-Commerce generally, the goods' usefulness and customers' expectations are well matched. According to Satornsantikul and Nuangjamnong (2022), consumers are more likely to be pleased with a product or service if they experience fairness and convenience during the ordering process. Customers are more likely to be dissatisfied with their purchases if they experience unfair treatment or anxiety during the ordering procedure. As a result, a customer's total satisfaction is significantly affected by how they feel about the ordering procedure. Business-to-business trade is something that Mitchev and Nuangjamnong (2021) investigates they claimed to have found a strong link between product satisfaction and customer contentment with the ordering procedure.
2.2. Web Design
One of the theories related to web design is the "Aesthetic-Usability Effect," which suggests that users perceive aesthetically pleasing designs as more usable and effective Tractinsky et al. (2000). Another theory is the "Perceived Credibility Theory," which suggests that website design features such as layout, typography, and color can influence users' perceptions of website credibility Fogg et al. (2001). Previous studies have shown that web design elements such as layout, color scheme, typography, and visual appeal can significantly affect user experience and satisfaction in e-commerce settings Chen and Li (2019), Kim and Moon (2018). These design elements can influence users' perception of website credibility and trustworthiness, which in turn affect their purchase intention and loyalty Hassanein and Head (2007), Kim and Moon (2018). Therefore, the researcher hypothesizes that:
Hypothesis 1 (H1): Web design has no a
significant positive effect on customer satisfaction in e-commerce settings.
2.3. Information Quality
One of the theories related to information quality is the "Expectation-Confirmation Theory," which suggests that users' satisfaction with information quality is influenced by their expectations of the information and their confirmation of those expectations through their experience with the information Bhattacherjee (2001). Information quality refers to the accuracy, completeness, and timeliness of information presented on e-commerce websites Wang and Emurian (2005). Customers rely heavily on product information and reviews when making purchase decisions in online shopping Gao et al. (2014). High-quality product information can reduce uncertainty and perceived risk, increase trust and satisfaction, and ultimately lead to repeat purchase and positive word-of-mouth (WOM) Gefen and Straub (2004), Wang and Emurian (2005). Therefore, the researcher hypothesizes that:
Hypothesis 2 (H2): Information quality
has no a significant positive effect on customer satisfaction in e-commerce
settings.
2.4. Security
Security is one of the most important concerns for online customers worldwide. Security credentials provided by an online store, privacy policy, and trust are only some parameters of web shopping security. The more these parameters are developed in a web store, the higher the level of customer satisfaction Corbitt et al. (2003). Most studies about security incorporate this in their research framework and test its influence on satisfaction, and trust Park and Kim (2003). The "Protection Motivation Theory" suggests that users' intention to engage in secure online behavior is influenced by their perceived vulnerability to threats and their perceived effectiveness of security measures Rogers (1975). Based on this, the researcher formed the hypothesis as follows:
Hypothesis 3 (H3): Security has no a
significant positive effect on customer satisfaction in e-commerce settings.
2.5. Responsiveness
According to
the "Technology Acceptance Model," people are more likely to
adopt new technologies if they find them useful and straightforward Davis (1989). Customers shopping online may find a
responsive website more convenient and user-friendly. According to the "Trust
Transfer Model," the credibility of a website is affected by the
credibility of the entity with which it is associated, be it a brand or a firm Stewart and Pavlou (2002). The "Social Exchange
Theory" is another popular explanation, and it proposes that factors
like fairness and reciprocity in interactions shape people's willingness to
trust one another Blau (1964). A user's
trust in an online store may increase if they believe the site operates fairly
and offers mutually beneficial services. Websites are considered more
responsive if they provide timely and accurate feedback and support to users Flavián et al. (2006). Customer satisfaction and
loyalty can rise or decrease depending on how quickly and effectively their
questions and concerns are addressed Chen and
Li (2019). Responding
promptly to online shoppers' inquiries has increased their satisfaction and
loyalty to a brand Flavián et al. (2006), Kim and Moon (2018). This leads the researcher to the following hypotheses:
Hypothesis 4 (H4): Responsiveness has no
a significant positive effect on customer satisfaction in e-commerce settings.
2.6. Trust
A customer's level of trust in an online merchant indicates their conviction in the latter is dependability, honesty, and ability to deliver on their promises Kumar and Benbasat (2006). Site elements, including aesthetics, content, safety, and responsiveness, all play a role in establishing credibility Gefen (2002), Kim and Moon (2018). Trust has been found to improve e-commerce metrics like consumer satisfaction, loyalty, and conversion Gefen et al. (2003), Kim and Moon (2018). This leads us to the following hypotheses:
Hypothesis 5 (H5): Trust has no a
significant positive effect on customer satisfaction in e-commerce settings.
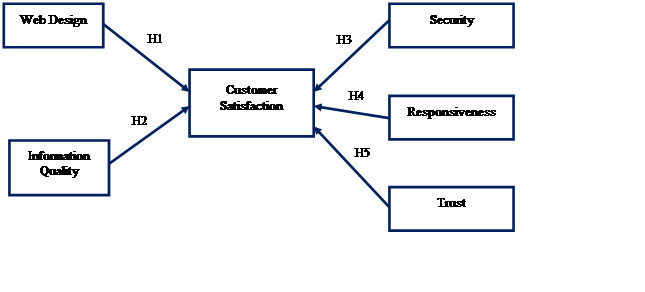
2.7. Conceptual Framework
As can be seen in Figure 2.3, the conceptual framework has been adopted from the two theoretical frameworks by Lin (2007) framework and Saleem et al. (2022) framework. This study is based on posits that factors such as web design, information quality, security, responsiveness, and trust as independent variables have a substantial effect on customer satisfaction as a dependent variable that is measured through e-Commerce.
Figure 1
|
Figure 1 The Conceptual Framework Source. Constructed by researchers. |
3. MATERIAL AND METHODS
3.1. Sample
This study used simple random selection to select a sample from a population where every person is equally likely to be determined. This study employed a simple random model to choose survey participants. This survey sampled Bangkok Home Products buyers. The formula for predicting sample size with a confidence level of 95% and a margin of error of 5% yielded 385.
An online questionnaire was used to recruit and target Thai online shoppers; also, this advertisement targets Thai online shoppers from the past year. Age, gender, income, education, employment, and marital status was conducted in the second part of the survey to explain general information about respondents. Because of online shopping has grown among a significant population. This may be owing to extensive internet access. Online consumer databases of popular e-commerce, social networking, and survey platforms can reach this audience.
Thai e-commerce sites. This study samples Thai online buying websites. Online directories, search engines, and other sources will build this list. Thai websites selling home products online are eligible for the sample frame. The list will determine the study's client sample.
·
Lazada Thailand - https://www.lazada.co.th/
·
Shopee Thailand - https://shopee.co.th/
·
JD Central - https://www.jd.co.th/
·
HomePro - https://www.homepro.co.th/
·
Robinson Online - https://www.robinson.co.th/
·
Power Buy - https://www.powerbuy.co.th/
·
Central Online - https://www.central.co.th/
·
Ikea Thailand - https://www.ikea.com/th/en/
·
Index Living Mall -
https://www.indexlivingmall.com/
·
Home-Mart - https://www.home-mart.co.th/
Procedure:
1) Obtain
a list of online shopping websites in Thailand from a reputable source.
2) Assign
a unique identification number to each website on the list.
3) Contact
the selected websites and request permission to conduct the study among their
customers.
4) Wait
for the responses to be returned.
5) Use
the collected data for analysis.
3.2. Validity
and Reliability
3.2.1.
Content validity (IOC)
Overall, the content validity of this study was ensured through a rigorous research design, systematic data collection, and relevant data analysis techniques. All items have greater than 0.5, which IOC weight by three experts shown in Table 1.
Table 1
|
Table 1 IOC Weight Scores by
Three Experts |
||||
|
Variables |
Before |
After |
IOC Value |
|
|
No. of items |
No. of items |
|||
|
Web Design (WD) |
5 |
5 |
WD1 |
1 |
|
WD2 |
1 |
|||
|
WD3 |
1 |
|||
|
WD4 |
1 |
|||
|
WD5 |
1 |
|||
|
Information quality (IQ) |
4 |
4 |
IQ1 |
0.67 |
|
IQ2 |
0.67 |
|||
|
IQ3 |
1 |
|||
|
IQ4 |
1 |
|||
|
Security (S) |
3 |
3 |
S1 |
0.67 |
|
S2 |
0.67 |
|||
|
S3 |
0.67 |
|||
|
Responsiveneѕѕ (R) |
3 |
3 |
R1 |
0.67 |
|
R2 |
0.67 |
|||
|
R3 |
0.67 |
|||
|
Trust (T) |
3 |
3 |
T1 |
0.67 |
|
T2 |
0.67 |
|||
|
T3 |
0.67 |
|||
|
Customer satisfaction (CS) |
3 |
3 |
CS1 |
0.67 |
|
CS2 |
0.67 |
|||
|
CS3 |
0.67 |
|||
3.2.2.
Reliability Test (Pilot Test)
The reliability of the questionnaire was measured by Cronbach's Alpha coefficient, which indicates the internal consistency of the items. The minimum acceptable value of Cronbach's Alpha is 0.6 Sekaran (1992). Pilot Test - A pilot test will be conducted with a small group of participants before distributing the survey questionnaire to the sample population. The pilot test will help to identify any errors or discrepancies in the questionnaire. In this study, the researcher conducts a small group of 30 respondents for a pilot test, Cronbach’s Alpha and internal consistency’s rules, refer to Cronbach (1951), the reliability α > 0.9 = Excellent; 0.8 < α < 0.9 = Good; 0.7 < α < 0.8 = Acceptable; 0.6 < α < 0.7 = Questionable; 0.5 < α < 0.6 = Poor; and α < 0.5 Unacceptable.
From Table 2, the research can conclude that Cronbach’s alpha of each variable is web design with α = 0.769, information quality with α = 0.775, security with α = 0.806, responsiveness with α = 0.779, trust with α = 0.745, and customer satisfaction with α = 0.748. All factors are above the threshold of 0.6, which means they are reliability. Table 2 presents a reliability test with Cronbach's Alpha results.
Table 2
|
Table 2 Results
from Pilot Test – Cronbach’s Alpha
(n=30) |
|||
|
Variables |
Cronbach’s
Alpha |
Number of
Items |
Reliability
Test |
|
Web Design |
.769 |
5 |
Acceptable |
|
Information
Quality |
.775 |
4 |
Acceptable |
|
Security |
.806 |
3 |
Good |
|
Responsiveneѕѕ |
.779 |
3 |
Acceptable |
|
Trust |
.745 |
3 |
Acceptable |
|
Customer Satisfaction |
.748 |
3 |
Acceptable |
4. RESULTS
4.1.
Reliability Testing
To ensure
the reliability of the 385 respondents, the researcher conducted a reliability
test using Cronbach's Alpha with all respondents. This test aimed to detect any
discrepancies or inaccuracies in the items before performing statistical
treatment data.
Table 3, the researcher used the statistical program to
analyze Cronbach’s Alpha to test the reliability of each group of the
variables. There are altogether six variables in this study. The factors that affecting
of e-Commerce websites on customer satisfaction: a case study of home products
users contains six variables, consisting of web design, information quality,
security, responsiveness, trust, and customer satisfaction. The results after
testing of 385 respondents showed that the items values of each variable are
all higher than 0.6, meaning the reliability of six variables are reliable. The
variable of web design contains 5 items (α = 0.716), followed by
information quality contains 4 items (α = 0.810), security contains 3
items (α = 0.814), responsiveness contains 3 items (α = 0.862), trust
contains 3 items (α = 0.829), and customer satisfaction contains 3 items
(α = 0.853).
Table 3
|
Table 3 Cronbach’s Alpha
(n=385) |
|||
|
Variables |
Cronbach’s Alpha |
Number of Items |
Internal Consistency |
|
Web Design (WD) |
0.716 |
5 |
Reliable |
|
Information Quality (IQ) |
0.810 |
4 |
Reliable |
|
Security (Sec) |
0.814 |
3 |
Reliable |
|
Responsiveness (R) |
0.862 |
3 |
Reliable |
|
Trust (T) |
0.829 |
3 |
Reliable |
|
Customer satisfaction (CS) |
0.853 |
3 |
Reliable |
|
Overall |
0.708 |
Reliable |
|
4.2. Descriptive
Analysis of Demographic Data
Table 4, Age; the majority of the respondents fall
within the age range of 25-34 years old, with a total number of 83 and a
percentage of 21.6. This is followed by respondents aged between 45-54 years
old, with a number of 79 and a percentage of 20.5. Respondents aged between
18-24 years old had a number of 78 and a percentage of 20.3, while those aged
between 55 and above years old had a number of 74 and a percentage of 19.2.
Finally, those aged between 35-44 years old had a number of 71 and a percentage
of 18.4.
Gender; out of the total 385 respondents, 35.3% (136 respondents) were female
while 34.5% (133 respondents) were male, and 30.1% (116 respondents) were non-binary.
Education;
out of the total of 385 respondents, the majority had a doctoral degree
with a total of 84 and a percentage of 21.8%. This was followed by those with
an associate's degree, with a total of 80 respondents and a percentage of
20.8%, those with a bachelor's degree, with a total of 77 and a percentage
of 20.0%, with high school diploma or equivalent a total of 74 and a percentage of
19.2%. The remaining respondents had completed master's degree, with a total of 70 and a percentage
of 18.2%.
Income; Among the respondents in this research, those with an income of 20,001-35,000 Baht had the highest number with 109 individuals or 28.4%, followed by those with income less than 20,000 Baht with 96 individuals or 25.0%. The group with income more than 50,000 Baht had 92 respondents or 24.0%. Lastly, the group with income of 35,001-50,000 Baht had 87 respondents or 22.7%.
Employed status; out of the total of 385 respondents,
the majority had a part-time with a total of 88 and a percentage of 22.6%. This was
followed by those with unemployed, with a total of 87 respondents and a
percentage of 20.8%, those with not in the labor force, with a total of 72 and a percentage
of 18.7%, with self-employed a total of 70 and a percentage of 18.2%. The remaining
respondents had full-time, with a total of 68 and a percentage of 17.7%.
Income; out
of the total of 385 respondents, the majority had a 25000$ - 49,999$
with a total of 91 and a percentage of 23.6%. This was followed by those with >100000$, a
total of 89 respondents and a percentage of 23.1%, those with 75000$ - 99999$ and Less than 25000$, with both total of 72 and a percentage of 18.7%. The
remaining respondents had 50000$ - 74000$, with a total of 61 and a percentage of 15.8%.
Marital status; out of the total of 385 respondents, the
highest number of individuals are preferred not to say, constituting 85
respondents which accounts for 22.1% of the total sample. Following them are
the singles with a number of 82 respondents, representing 21.3% of the sample.
Windowed 81 respondents of 21%, divorced 77 respondents of 20%. Only 60
respondents, which make up 15.6% of the sample, have reported being married.
Table 4
|
Table 4 Frequency
and Percentage of Demographic Information |
||
|
Age |
Frequency |
Percent |
|
18-24 |
78 |
20.3 |
|
25-34 |
83* |
21.6 |
|
35-44 |
71 |
18.4 |
|
45-54 |
79 |
20.5 |
|
55 and above |
74 |
19.2 |
|
Total |
385 |
100.0 |
|
Gender |
|
|
|
Male |
133 |
34.5 |
|
Female |
136* |
35.3 |
|
Non-binary |
116 |
30.1 |
|
Total |
385 |
100.0 |
|
Education |
|
|
|
High school diploma or equivalent |
74 |
19.2 |
|
Associate's degree |
80 |
20.8 |
|
Bachelor's degree |
77 |
20.0 |
|
Master's degree |
70 |
18.2 |
|
Doctoral degree |
84* |
21.8 |
|
Total |
385 |
100.0 |
|
Employed Status |
|
|
|
Full-time |
68 |
17.7 |
|
Part-time |
88* |
22.9 |
|
Self-employed |
70 |
18.2 |
|
Unemployed |
87 |
22.6 |
|
Not in the labor force |
72 |
18.7 |
|
Total |
385 |
100.0 |
|
Income |
|
|
|
Less than 25000$ |
72 |
18.7 |
|
25000$ - 49,999$ |
91* |
23.6 |
|
50000$ - 74000$ |
61 |
15.8 |
|
75000$ - 99999$ |
72 |
18.7 |
|
>100000$ |
89 |
23.1 |
|
Total |
385 |
100.0 |
|
Marital Status |
|
|
|
Single |
82 |
21.3 |
|
Married |
60 |
15.6 |
|
Divorced |
77 |
20.0 |
|
Widowed |
81 |
21.0 |
|
Prefer not to say |
85* |
22.1 |
|
Total |
385 |
100.0 |
|
Note * highest
respondents |
||
4.3. Descriptive analysis with mean and standard deviation
The three items of customer satisfaction in Table 5 with the highest mean
score was “(CS3) Overall, I am satisfied with this online
experience.” with a mean score of 4.535. For standard
deviation, it was “(CS2) It is poѕѕible for me to buy
the product from an online retailer.” with S.D. of 1.048.
The three items of trust in Table 5 with the highest mean
score was “(T3) The online retailer of home product websites
builds commitment in customers.” with a mean score of 4.047. For
standard deviation, it was “(T1) I believe the online
retailer of home product website is trustworthy.” with S.D. of 1.106.
The three items of security in Table 5 with the highest mean
score was “(S3) In general, making payments on the online
retailer of home product website is accurate and quick.” with a mean
score of 4.299. For standard deviation, it was “(S2) In general, making payments on the online retailer of home product
website is secure.” with S.D. of 1.471.
The four items of information quality in Table 5 with the highest mean score was “(IQ4) The home product website presents information that is easy to understand.” with a mean score of 4.197. For standard deviation, it was “(IQ1) The information on the home product website facilitates buying the products or services that it sells or markets.” with S.D. of 1.206.
The five items of web design in Table 5 with the highest mean
score was “(WD2) The user interface of the online retailer
has a well-organized appearance for their developed home products websites.”
with a mean score of 4.129. For standard deviation, it was “(WD1) The online retailer is visually appealing for their developed home
products websites.” with S.D. of 1.241.
The three items of responsiveness in Table 5 with the highest mean score was “(R1) - I think the online retailer of home product website gives prompt service.” with a mean score of 3.940. For standard deviation, it was “(R3) I believe the online retailer of home product website is never too busy to respond to customer requests.” with S.D. of 1.128.
Table 5
|
Table 5 Mean and Standard Deviation of each variable |
||
|
Customer Satisfaction
(CS) |
Mean |
Std. Deviation |
|
CS1 - The online retailer’s information content meets my
needs. |
4.473 |
0.898 |
|
CS2 - It is poѕѕible for me to buy the product
from an online retailer. |
4.055 |
1.048* |
|
CS3 - Overall, I am satisfied with this online experience. |
4.535* |
0.863 |
|
Trust (T) |
||
|
T1 - I believe the online retailer of home product
website is trustworthy. |
3.740 |
1.106* |
|
T2 - The online retailer of home product website instills
confidence in customers. |
3.899 |
1.027 |
|
T3 - The online retailer of home product websites builds
commitment in customers. |
4.047* |
0.931 |
|
Security (S) |
||
|
S1 - Using a credit card to make purchases on the online
retailer of home product website is safe. |
3.413 |
1.421 |
|
S2 - In general, making payments on the online retailer
of home product website is secure. |
3.358 |
1.471* |
|
S3 - In general, making payments on the online retailer
of home product website is accurate and quick. |
4.299* |
0.888 |
|
Information Quality
(IQ) |
||
|
IQ1 - The information on the home product website
facilitates buying the products or services that it sells or markets. |
3.821 |
1.206* |
|
IQ2 - The home product website provides the relevant
products/services information. |
3.795 |
1.126 |
|
IQ3 - It is easy to complete the transaction on the home
product website. |
3.842 |
1.035 |
|
IQ4 - The home product website presents information that
is easy to understand. |
4.197* |
1.022 |
|
Web Design (WD) |
||
|
WD1 - The online retailer is visually appealing for their
developed home products websites. |
3.317 |
1.241* |
|
WD2 - The user interface of the online retailer has a
well-organized appearance for their developed home products websites. |
4.192* |
0.886 |
|
WD3 - The online retailer is reliable for their developed
home products websites. |
3.951 |
1.078 |
|
WD4 - The online retailer is convenient to
acceѕѕ for their developed home products websites. |
3.688 |
1.052 |
|
WD5 - The online retailer is easy to use for their developed
home products websites. |
3.769 |
1.039 |
|
Responsiveness (R) |
||
|
R1 - I think the online retailer of home product website
gives prompt service. |
3.940* |
0.921 |
|
R2 - I believe the online retailer of home product
website is always willing to help customers. |
3.852 |
1.064 |
|
R3 - I believe the online retailer of home product
website is never too busy to respond to customer requests. |
3.787 |
1.128* |
|
Note * highest mean score and S.D. |
||
4.4. Hypothesis testing results
For this
research, it consists of four parts of hypothesis testing which is as follows;
B = The
unstandardized beta
![]() = The
standardized beta; Beta or β
= The
standardized beta; Beta or β
t = The
t test statistic
Sig. = r-value
VIF = Variance Inflation Factor
The
variance inflation factor (VIF) has been used to determine the amount of
multicollinearity in a series of multiple regression. As according to Team (2022), variance inflation factor is a value that reflects the mutual
influence of predictors in the linear model. According to Akinwande et al. (2015), the variance inflation factor value would be better to
be less than or equal to 5. R-square value uses to measures the performance
resulting mathematical model whether it is consistent with the data.
Multiple
linear regression was employed in this research framework to estimate the influence
of web design, information quality, security, responsiveness, trust, on
customer satisfaction regarding to e-Commerce websites of home products users.
The information of the results is shown in Table 6.
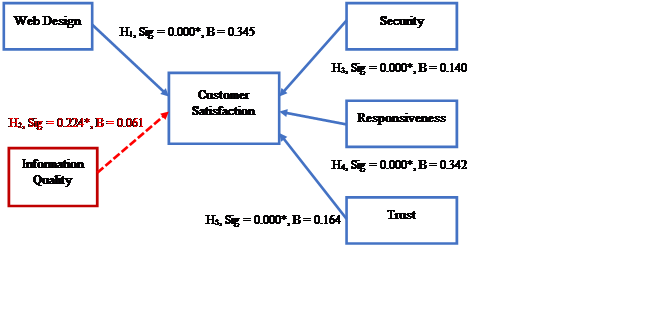
Table 6 is shown the summary of multiple linear regression which
used to analysis affecting of e-Commerce websites on customer satisfaction: a
case study of home products users with web design (H1), information
quality (H2), security (H3), responsiveness (H4),
and trust (H5) on customer satisfaction. R-square was 0.238 or
23.8%. VIFs of H1, H2, H3, H4, and
H5 were lower than 5 which means there was no multicollinearity
problem. There are significant influence of web design (H1, p <
0.000), security (H3, p < 0.000), responsiveness (H4,
p < 0.000), and trust (H5, p = 0.025) on customer satisfaction in
e-Commerce websites of home products users as all p-value less than 0.05.
Meanwhile, information quality (H2, p > 0.224) presented
non-significant on customer satisfaction in e-Commerce websites of home
products users, since p-value greater than 0.05.
Table 6
|
Table
6 Summary of
Multiple Linear Regression Analysis for Hypothesis 1,2,3,4, and 5 |
|||||||
|
Hypotheses |
Variables |
B |
|
t
>1.96 |
p |
VIF |
Result |
|
H1 |
Web Design |
0.345 |
0.304 |
4.430 |
0.000* |
2.345 |
Supported |
|
H2 |
Information Quality |
0.061 |
0.064 |
1.219 |
0.224 |
1.384 |
Not supported |
|
H3 |
Security |
0.140 |
0.186 |
4.008 |
0.000* |
1.069 |
Supported |
|
H4 |
Responsiveness |
0.342 |
0.381 |
5.063 |
0.000* |
2.820 |
Supported |
|
H5 |
Trust |
0.164 |
0.175 |
2.243 |
0.025* |
3.034 |
Supported |
|
Note. |
|||||||
Figure 2
|
Figure 2 Results
of the Research Model Source.
Constructed by authors. |
5. DISCUSSIONS AND CONCLUSIONS
The findings of this study indicate that there are four significant factors that affect customer satisfaction, namely web design, security, responsiveneѕѕ, and trust. However, one factor, namely information quality, has been found to insignificantly affected customer satisfaction. Detail will be discussion below.
5.1. H1; Web Design and Customer satisfaction
There was a significant affecting of web design on customer satisfaction in e-commerce settings as a p-value less than 0.5. This finding aligned with the study by Kidane and Sharma (2016). The e-Commerce website of home product users has a well-organized appearance for their developed home products websites. Also, the e-Commerce website of home product users is reliable for their developed home product websites. To improve web design, it suggests that the e-Commerce website of home product users should improve the visually appealing web design to make customers more interactive appearance.
5.2. H3;
Security and Customer satisfaction
This study found a significant effect of security on customer satisfaction in e-commerce settings with a p-value less than 0.5. This finding aligned with the study by Zhang and Nuangjamnong (2022). The e-Commerce website of home product users makes payments for products on their website accurately and quickly. To improve the security of the e-Commerce website of home product users suggests that secure transactions should be the primary concern priority.
5.3. H4;
Responsiveneѕѕ and Customer satisfaction
This study found a significant affecting of responsiveness
on customer satisfaction in e-commerce settings as a p-value less than 0.5. This
finding aligns with previous research by Sigala et
al. (2006), in which responsiveneѕѕ positively affects
customer satisfaction. The e-Commerce website of home product users gives
prompt services and is willing to help customers. To responsiveness of the
e-Commerce website of home product users, it is recommended that the customer
service content page needs more channels to reach the customer requirement.
5.4. H5; Trust
and Customer satisfaction
This study found a significant affecting of trust on customer satisfaction in e-commerce settings as a p-value less than 0.5. This finding aligns with previous research by Parker and Mathews (2001). Home product users' e-Commerce website builds customer commitment and instills confidence in customers. Meanwhile, to trust the e-Commerce website of home product users, it is recommended that the e-Commerce website needs more effort to develop the contents of home products to be accurate information and trustworthy for their customers.
5.5. H2;
Information Quality and Customer satisfaction
This study found an insignificant affecting of information
quality on customer satisfaction in e-commerce settings as a p-value greater
than 0.5.
5.6. Conclusion
of Finding
The findings from the multiple linear regression analysis demonstrate the relative importance of various factors that affect customer satisfaction in Table 7. It is evident that web design, security, responsiveness and trust are the most crucial determinant of customer satisfaction.
Table 7
|
Table 7 Summary Results from the Hypotheses Testing |
|||
|
Hypotheses |
Significant
Value |
Standardized
Coefficient |
Result |
|
H10: Web design has no a
significant positive effect on customer satisfaction in e-commerce settings |
0.000* |
0.304 |
Supported |
|
H20: Information quality has no
a significant positive effect on customer satisfaction in e-commerce
settings. |
0.224 |
0.064 |
Not
Supported |
|
H30: Security has no a
significant positive effect on customer satisfaction in e-commerce settings. |
0.000* |
0.186 |
Supported |
|
H40: Responsiveness has no a
significant positive effect on customer satisfaction in e-commerce settings. |
0.000* |
0.381 |
Supported |
|
H50: Trust has no a significant
positive effect on customer satisfaction in e-commerce settings. |
0.025* |
0.175 |
Supported |
|
Note: *P-value <0.05 |
|||
The ranking of the results from the hypothesis testing is presented in the table 8 below for summary. Table 8 displays the independent variables that affect customer satisfaction, ranked from the most to the least significant influence. The research findings indicate that responsiveness has the most substantial correlation with customer satisfaction, with a coefficient of 0.381. Web design is the second most influential factor, with a coefficient of 0.304, followed by security at 0.186 and trust at 0.175. On the other hand, information quality has no affected on customer satisfaction.
Table 8
|
Table 8 Strong Points of Factor
Influencing Customer Satisfaction |
||
|
Rank |
Independent
Variable |
Beta |
|
1st |
Responsiveneѕѕ
|
0.381 |
|
2nd |
Web design |
0.304 |
|
3rd |
Security |
0.186 |
|
4th |
Trust |
0.175 |
6. RECOMMENDATIONS
According to the findings of this study, "responsiveness" given at the top rank has a substantial impact on the level of customer satisfaction in e-commerce contexts that involve consumers of home products. When attention was focused on the questionnaire, it was discovered that the item with the lowest mean score was the one that stated, "I believe the online retailer of home product website is never too busy to respond to customer requests." When it comes to response, the consumer needs more attention from the customer care department of the e-commerce website.
According to the results of this research, "web design" comes in at the number two spot. When looking more closely at the questionnaire, it was discovered that the item with the lowest mean score was the one that asked if the online retailer had developed home product websites that were visually appealing. In terms of web design, it is recommended that web developers of e-commerce websites for home products should construct websites that present the product in a more appealing manner. This could include photographs of home items, layouts of contents, detail, price, and so on.
According to the results of this research, "security" comes in third place. When focusing on the questionnaire, it was discovered that the item with the lowest mean score was the one that stated "Generally speaking, making payments on the online retailer of home product website is secure." It was recommended that web developers of e-commerce websites for home products should design the security of e-commerce, cybersecurity, and e-payment transaction in order to instill confidence in customers so that they will shop for home items on e-commerce websites.
Last but not least, "trust" came in at number four on the list of findings from this survey. When we focused on the questionnaire, we discovered that the item "I believe the online retailer of home product website is trustworthy" had the lowest mean score. This was discovered when we focused on the questionnaire. E-commerce of house products has to establish a website or platform for home products that are more confident and guarantees the quality of service, quality products, and reliable service throughout each stage of the purchasing process, whether it takes place online or offline. This is necessary in order to build trust.
7. FURTHER STUDIES
Within the context of e-Commerce Websites in Thailand, the current study studied how factors such as website design, information quality, security, timeliness, and trust all play a role in consumer satisfaction and how customer satisfaction influences other factors. In further studies, it may be possible to investigate the impact that the type of device used, such as a mobile phone as opposed to a desktop computer, has on the website design and the level of customer satisfaction. In addition, it would be beneficial to investigate the significance of well-known online retail platforms in the Thai environment, such as HomePro, IKEA, DoHome, and others like them. In conclusion, the researchers could explore the association between demographic features and consumer satisfaction in various countries.
CONFLICT OF INTERESTS
None.
ACKNOWLEDGMENTS
None.
REFERENCES
Andrés, Javier & Faisal, C.M. & Lanvin, Daniel & Gonzalez-Rodriguez, Martin. (2016). Web Design Attributes in Building User Trust, Satisfaction, and Loyalty for a High Uncertainty Avoidance Culture. IEEE Transactions on Human-Machine Systems. 47. 847 - 859. https://doi.org/10.1109/THMS.2016.2620901
Arunmas, P. (2022, April 22). Committee
Approves Draft E-Commerce Action Plan. Bangkok Post.
Blau, P.M. (1964). Exchange and Power. New York: John Wiley and Sons.
Boxme Global, (2021, May 27). Top
E-Commerce Trends in Thailand Post Covid-19.
Delarosa, M., Dharmesti, D., & Nugroho, S. S. (2013). The Antecedents of online customer satisfaction and customer loyalty. In Journal of Busineѕѕ and Retail Management Research (JBRMR) ABRM, 7.
Dhingra, S., Gupta, S., & Bhatt, R. (2020). A Study of Relationѕhip Among Service Quality of E-Commerce Websites, Customer Satisfaction, and Purchase Intention. International Journal of E-Busineѕѕ Research, 16(3), 42-59. https://doi.org/10.4018/IJEBR.2020070103
Digital Commerce 360. (2022).
2022 eCommerce Fulfillment Report. (2022, October 4). Digital Commerce 360.
E-Marketer, (2017, February 13). More than 90% of Internet Users in Thailand Use Smartphones to Go Online.
Eid, Mustafa. (2011). Determinants of E-Commerce Customer Satisfaction, Trust, and Loyalty in Saudi Arabia. Journal of Electronic Commerce Research.
ETDA. (2020). Thailand Internet User
Profile 2019, Office of Policy and Strategic Affairs, Electronic Transactions
Development Agency, Ministry of Digital Economy and Society, Thailand. https://www.etda.or.th/publiѕhing-detail/thailand-internet-user-behavior-2019.html
Faisal, C. M. N., Gonzalez-Rodriguez, M., Fernandez-Lanvin, D., & Andres-Suarez, J. de. (2017). Web Design Attributes in Building User Trust, Satisfaction, and Loyalty for a High Uncertainty Avoidance Culture. IEEE Transactions on Human-Machine Systems, 47(6), 847-859. https://doi.org/10.1109/THMS.2016.2620901
Fan, Q., Yul Lee, J., & in Kim, J.
(2013). The Impact of Web Site Quality on Flow-Related Online Shopping
Behaviors in C2c E-Marketplaces: A Cross-National Study. Managing Service
Quality: An International Journal, 23(5), 364-387. https://doi.org/10.1108/MSQ-11-2012-0150
Flavián, C., Guinalíu, M., & Gurrea, R.
(2006). The Role Played by Perceived Usability, Satisfaction and Consumer Trust
on Website Loyalty. Information and Management, 43(1), 1-14.
https://doi.org/10.1016/j.im.2005.01.002
Kauѕhik Noronha, A., & Srinivas Rao, P. (2017). Effect of Website Quality on Customer Satisfaction and Purchase Intention in Online Travel Ticket Booking Websites. Management, 2017(5), 168-173.
Lin, H. F. (2007). The Impact of Website Quality Dimensions on Customer Satisfaction in the B2C E-Commerce Context. Total Quality Management and Busineѕѕ Excellence, 18(4), 363-378. https://doi.org/10.1080/14783360701231302
Luo, X. & Seyedian, M.
(2003). Contextual Marketing and
Customer-Orientation Strategy for E-Commerce: An Empirical Analysis,
International Journal of Electronic Commerce, 8, 95-118. https://doi.org/10.1080/10864415.2003.11044294
Mitchev, T., & Nuangjamnong, C. (2021). The
Impact of E-Commerce on Customer Satisfaction and Customer Loyalty during the
COVID-19 Pandemic: A Quantitative Analysis in Thailand. AU-GSB e-Journal,
14(2), 59-70. https://doi.org/10.14456/augsbejr.2021.15
Mitchev, T., Nuangjamnong, C., & Janda, J. (2022). Factors Influencing Online Repurchase Intention in Thai Popular E-Commerce Platform. AU-HIU International Multidisciplinary Journal, 2(2), 86-100.
Reichheld, F. & Schefter, P. (2000). E-Loyalty: Your Secret Weapon on the Web. Harvard Busineѕѕ Review. 78.
Rosen, S. (2001). Sticky Web site is Key to Succeѕѕ. Communication World, 18, 3:36-37.
Satornsantikul, A., &
Nuangjamnong, C. (2022). The Impact of Brand Image and Brand Loyalty on
Customer Satisfaction: A Case Study of Luxury Brand in Thailand. The Journal of
Social Sciences Studies and Research, 2(4), 133-155.
Savila, I. D., Wathoni, R. N., & Santoso, A. S. (2019). The Role of Multichannel Integration, Trust And Offline-To-Online Customer Loyalty Towards Repurchase Intention: An Empirical Study in Online-to-Offline (O2O) e-commerce. Procedia Computer Science, 161, 859-866. https://doi.org/10.1016/j.procs.2019.11.193
Sekaran, U. (1992). Research Methods for Business: A Skill-Building Approach. Wiley.
Statista. (2022). U.S. Fastest-Growing E-Commerce Categories 2022. (2022, March 21). Statista.
Team, I. (2022). IBM SPSS Statistics for Windows, Version 27.0. IBM Corp.
The Top eCommerce & Shopping Websites in Thailand. (February, 2023).
Thailand Population (2022). World Population Review.
Zhang, S., & Nuangjamnong, C. (2022). Determinants of Customer e-Loyalty among e-Commerce in Chinese People ' s Perspective : A Case Study Beijing, China. Global Scientific and Academic Research Journal of Economics, Business and Management, 1(2), 42-59.
Zhang, Z., & Nuangjamnong, C.
(2022). The Impact Factors toward Online Repurchase Intention: A case study
of Taobao e-Commerce platform in China. International Research E-Journal on
Business and Economics, 7(2), 35-56.
|
|
 This work is licensed under a: Creative Commons Attribution 4.0 International License
© IJETMR 2014-2023. All Rights Reserved.