
|
|
|
|
Inter-State Disparities in Healthcare Costs, Health Insurance Coverage and Financial Protection in India: A Comparative Analysis of National Sample Surveys for 1986-87, 1995-96, 2004 and 2014
Anil Gumber 1![]()
![]() ,
N. Lalitha 2
,
N. Lalitha 2![]()
![]() , Biplab Dhak 3
, Biplab Dhak 3![]()
![]()
1 Senior
Health Economist at Faculty of Health and Wellbeing, Sheffield Hallam
University, Sheffield, UK
2 Retired
from a Professorial position at Gujarat
Institute of Development Research, Ahmedabad, India
3 Assistant Professor, A N Sinha Institute of Social Studies, Patna, India
|
|
|
ABSTRACT |
|
|
By
analysing data from the National Sample Survey for
four rounds (1986–87, 1995–96, 2004 and 2014) this research focuses on
changes in people's health seeking behaviour, the
cost of treatment, and principal factors affecting health insurance premium
payments by BPL and APL families. With variations between states, it is
discovered that over time, less people sought care from public providers and
more people preferred private providers. Despite the fact
that both men and women are now more likely to seek treatment for
their illnesses, a sizeable portion of the population (more in rural than in
urban areas), still refuses treatment because they believe their illness is
not serious enough to warrant it. Whilst the cost of healthcare has gone up
over time, the difference between public and private costs of treatment has
shrunk, possibly as a result of the higher recurring
cost in public health facilities and imposing of user fees and cutting on the
delivery of free medication. Since the middle of the 2000s, public insurance
companies have offered low-cost hospitalisation
insurance programmes like the Jan Arogya Bima
Policy and Rashtriya Swasthya
Bima Yojana (RSYB) to help with the healthcare needs of the underprivileged
sector of society. According to the insurance premiums, more households that
paid premiums in 2004 and 2014 belonged to groups with higher Monthly Per
Capita Expenditures (MPCE) and were not economically in the poorest tier. The
inter-quintile MPCE differential (between the top and bottom quintile) also
reveals significant inter-state disparities in terms of the percentage of
households that paid a premium and the percentage of households that had
health insurance. The factors that determine whether a family enrols in health insurance imply that increasing
enrolment from the poor households got coverage through RSBY. At the national
level, BPL/APL households with insurance reported, on average, higher hospitalisation costs than non-insured households, with
the difference being significantly higher for urban households. This finding
suggests the prevalence of insurance collusion and moral hazard, particularly
in the cities from developed states of Punjab, Haryana, Gujarat, and Maharashtra.
Further, BPL households, particularly from rural India, have received very
little financial relief as a result of the
insurance. |
|||
|
Received 27 March 2023 Accepted 28 April 2023 Published 13 May 2023 Corresponding Author Anil Gumber, A.Gumber@shu.ac.uk DOI 10.29121/ijetmr.v10.i5.2023.1315 Funding: This research received
no specific grant from any funding agency in the public, commercial, or
not-for-profit sectors. Copyright: © 2023 The
Author(s). This work is licensed under a Creative Commons
Attribution 4.0 International License. With the
license CC-BY, authors retain the copyright, allowing anyone to download,
reuse, re-print, modify, distribute, and/or copy their contribution. The work
must be properly attributed to its author.
|
|||
|
Keywords: Health
Insurance Coverage, Financial Protection, Healthcare Costs |
|||


1. INTRODUCTION
Healthcare
system in India is a typical mix of public and private providers with wide
inter-state disparities in terms of their spread and coverage. The total health
expenditure (THE) for India is estimated to be 3.16% of Gross Domestic Product
(GDP) of which public sector contributed 40.61%, household out-of-pocket (OOP)
48.21%, the Private Health Insurance 6.57% and the remainder by Social Security
and External Donors (National Health Accounts 2018-19, Government of India. (2022). Since the inception of National
Health Accounts, the total health expenditure as percentage of GDP has
continuously declined from 4.2% in 2004-05 to 3.8% in 2015-16 and further to
3.2% in 2018-19. It is interesting to note that the contribution of government
has increased from 22.5% in 2004-05 to 40.6% in 2018-19, that of the household
OOP decreased from 69.4% to 48.2% whilst that of private health insurance
increased from 1.6% to 6.6% during the same period. The Central and State
governments’ health expenditure together account for just 1.3% of GDP which is
drastically below the 5% norm required to support the Universal Health Coverage
mission.
Several
evidences both quantitative and qualitative have consistently demonstrated that
the high level of household OOP health expenditure on treatment including
private health insurance premium is responsible for pushing people into poverty
Gumber (2000); World (2001); Van et al. (2006); Selvaraj and Karan (2009); Berman et al. (2010). It may be noted that private
health expenditure is higher than public expenditure across all major states.
The burden of OOP expenditure falls on a quarter or a third of the households
with incomes below the poverty line Deolalikar et al. (2008), which has impacted the reduction
in consumption expenditure on food and other essential items, increased
indebtedness, and growing untreated illness; and which could further lead to
gender bias in health-seeking behaviour Sen (2003).
Although
public health system has not equally spread-out geographically and has several
shortcomings in terms of providing both quantity and quality of services in India,
even then it has been evident from the previous National Sample Survey
Organisation (NSSO) Survey Rounds on Healthcare Utilisation that public health
services are the preferred option, particularly, for inpatient care Gumber (2002), Gumber (2021). Moreover, health outcomes,
especially, infant mortality, respond more to public health and local clinical
interventions than to hospital care Deolalikar et al. (2008), and these may vary across states.
This
paper presents the health and morbidity scenarios prevalent in India at four
time points using the NSSO surveys for 1986-87, 1995-96, 2004 and 2014 and thereby
examines the trends in the use of healthcare services separately for rural and
urban residents by public and private providers and their associated expenditure
on treatment as inpatient and outpatient. It further explores inter-state disparities in health
insurance enrolment/coverage and the extent of financial protection received by
insured households. These four survey rounds depict three important periods of
growth, namely the liberalization period of the 1980s, the period of fiscal
contraction in the 1990s that saw the decline in social spending Bhat and Jain (2006), Selvaraj and Karan (2009), the phase of globalization and the
launch of National Rural Health Mission in 2005. The paper also discusses
whether the states have made a notable progress towards achieving Universal
Health Coverage (UHC) goals in terms of improving equity in accessing
healthcare services and reducing financial hardship to meet the catastrophic
hospital treatment cost.
The
analysis took into account 17 of India’s largest
states; however, the computation of “All-India” averages included all major and
smaller states and union territories. There have been a few splits in states after
November 2000; hence we have added back Chhattisgarh to Madhya Pradesh,
Uttaranchal to Uttar Pradesh and Jharkhand to Bihar (which depicts a
pre-bifurcation scenario) in order to compare statistics
between NSSO Rounds. Furthermore, to account for inflation between survey
rounds we converted the cost of treatment in real terms by deflating the OOP
expenditure by the wholesale price index of pharmaceutical products at 1993-94
prices. Pharmaceutical prices are a significantly better reflection of the
actual rising cost of Indian healthcare services than the deflator based on
consumer price/wholesale price index for all commodities. The inflation rate of
pharmaceutical products has turned out to be higher than those for all commodities.
The wholesale price for pharmaceutical product is estimated to have increased
by 318 per cent against 240 per cent for prices of all commodities during the
period 1994-95 to 2011-12 (This is computed from RBI report on Wholesale Price
Index for various years under sub-category - Manufacture of
Pharmaceuticals, Medicinal Chemical and Botanical Products). Since much of the household’s
recurring health expenditure is incurred on purchasing the necessary drugs as
an inpatient/ outpatient, the use of price index for pharmaceutical items than
any other price index is more appropriate to demonstrate the financial burden of
rising healthcare expenditure on people seeking treatment in India.
The paper
is structured in five sections, including the introduction. Section 2 presents
a summary health scenario for India. The
healthcare utilisation pattern and associated cost of treatment for inpatient
and outpatient care for rural and urban residents are examined in Section 3. The
amount of household financial and health insurance protection is shown in
Section 4 for the major states. The summary and conclusions are presented in
the final section.
2. Health Scenario in India
With the
increasing attention towards achieving better population health, India has
significantly improved its health in terms of higher life expectancy and lower
levels of mortality over the last 50 years. According to health indicators provided
by the Central Bureau of Health Intelligence, Government of India. (2018), the birth rate decreased from 25.8
in 2000 to 20.4 in 2016 and the crude death rate decreased from 8.5 to 6.4
during the same period. Other health metrics, such as the infant and maternal
mortality rates, have also decreased over time as a result of the numerous
programmes included in previous Five Year Plans.
Between the 1970s and 2015, the infant mortality rate dropped from 120 per
1,000 live births by more than a third to 37. Similarly, the maternal mortality ratio decreased
from 400 maternal deaths per 100,000 live births in 1997-98 to 167 in 2011-13. In spite of these improved health outcomes, substantial disparities
in these health indicators continue to prevail among the states Balarajan et al. (2011).
In
contrast to other Asian nations like China, Indonesia, Thailand, Malaysia, the
Republic of Korea, and Sri Lanka, India's progress has lagged
behind. Due to the continuous epidemiological transformation and the
explosive increase of non-communicable diseases, the nation is also dealing
with the new challenge of a "double burden of disease." Even though
India has made tremendous progress in containing communicable diseases, their disease
burden on the nation is still significant. The prevalence of chronic
non-communicable diseases (NCDs), such as cardiovascular disease, diabetes,
chronic obstructive pulmonary disease, malignancies, common mental disorders,
and accidents, has gradually increased along with the drop in morbidity and mortality
from communicable diseases. The National Health Policy 2015 states that
communicable diseases still account for 24.4% of all disease burden while
maternal and neo-natal ailments contribute to 13.8%. The NCDs (39.1%) and
injuries (11.8%) now constitute the bulk of the country’s disease burden.
The
government health spending in India must significantly grow in
light of the prevalent disease burden. The supply and financing of
various health services between the federal government and the states are
clearly demarcated. The financing and provision of curative healthcare are both
regarded as state matters. The Employees' State Insurance Scheme (ESIS),
primary healthcare facilities, and hospital services are entirely funded by the
state. The federal government fully
funds programmes for family welfare and medical education. The
majority of national disease control programmes are funded on a 50:50
share basis by the federal government and the states. However, the state's
contribution to the overall cost of these programmes turns out to be around
three-fourths, i.e., only basic inputs are shared equally. The state has to bear all the administrative cost including salaries
of the staff. The centre and states share equally the capital investment. The federal
government’s share is little over 40% in the total expenditure on medical
education and research, Broadly, thus the states fully manage and fund all
curative care services. This implies that State’s economic and financial conditions
as well as human resources have a direct impact on people’s health outcomes.
Table 1
|
Table 1 Key Health Financing Indicators for
India across NHA Rounds |
||||
|
|
NHA 2004-05 |
NHA 2013-14 |
NHA 2014-15 |
|
|
1 |
THE
as % of GDP |
4.2 |
4 |
3.9 |
|
2 |
THE
per capita (Rs) |
1201 |
3638 |
3826 |
|
3 |
CHE
as % of THE |
98.9 |
93 |
93.4 |
|
4 |
Total
Govt. Health Exp. As % of THE |
22.5 |
28.6 |
29 |
|
5 |
OOPE
as % of THE |
69.4 |
64.2 |
62.6 |
|
6 |
Social
security expenditure on health as per cent of THE |
4.2 |
6 |
5.7 |
|
7 |
Private
Health Insurance as a % THE |
1.6 |
3.4 |
3.7 |
|
8 |
External/Donor
Funding for health as per cent of THE |
2.3 |
0.3 |
0.7 |
|
|
Note: THE, CHE, and OOPE refer to Total Health Expenditure, Current Health
Expenditure, Out-of-Pocket Expenditure, respectively. Source: Government of India, 2017a,
National Health Accounts, 2014-15, p.11. |
|
||
Four key
facts emerge from key indicators presented in the NHA 2014-15 Table 1: (1) the increase in the share of
total government health spending to 29%; (2) the decline in OOP expenditure
from 69.4% in 2004-05 to 62.6%; and (3) 0.3% increase in the private health
insurance in 2014-15 and decrease by
the same amount in the social security expenditure compared to NHA 2013-14, but
with a notable increase compared to NHA 2004-05.
Against
this general backdrop, we examine in the following section the pattern of
health care utilisation across 17 major states over four survey rounds.
3. Pattern of Healthcare Utilisation and Cost of Treatment
3.1. Health Seeking Behaviour
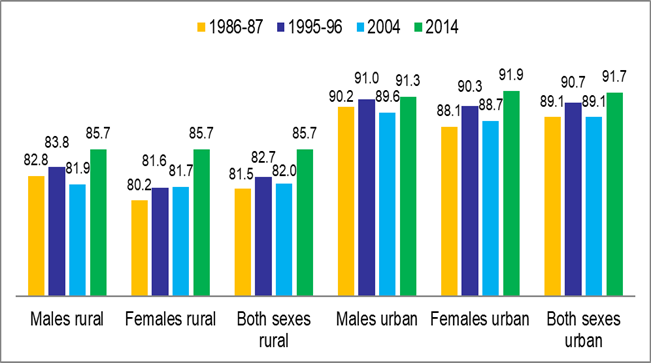
The share
of illness episodes treated following on a medical advice is more an indicator of
the health-seeking behaviour of
consumers rather than of morbidity alone. The gender differences in the number
of illnesses treated, as shown in Figure 1, highlight the disparities between
rural and urban residents’ patterns of health-seeking behaviour. It
demonstrates that over the all-India, the proportion of illnesses treated in
urban regions for both genders continuously remained greater than those in rural
areas in all four rounds. This might be primarily because urban areas have
better access to medical facilities. In 2014, the rural-urban divide is found
to be smaller than that was in 1986–1987. Additionally, the gender difference
favouring men that was evident in the prior three rounds disappeared by 2014.
However, there are significant differences in health seeking behaviour between
men and women and between rural and urban areas and within select states
indicating positive and negative trends
over the four rounds.
Figure 1
|
Figure
1 Share of treated illnesses by sex and rural-urban
residence (%) |
When
compared to 1986–1987, there has been a little improvement in health seeking
behaviours across all-India for both sexes in 2014. Compared to 1986–1987,
rural areas of Andhra Pradesh, Madhya Pradesh, Maharashtra, Odisha, Rajasthan,
and Tamil Nadu saw a noticeable improvement in health seeking behaviour in 2014
but Assam, Bihar, and West Bengal saw a decline. To our surprise, urban regions
in Assam, Bihar, Jammu & Kashmir, Odisha, and Punjab saw a decline in
health seeking behaviour whereas Andhra Pradesh and Maharashtra saw a notable
improvement. In numerous states, particularly in rural areas, significant
gender disparities in ailment treatment have been noted (for more information,
see Gumber et al. (2017).
Despite
the diagnosis of illness, not everyone seeks medical help/assistance due to underlying
various socio-economic and cultural reasons. One of such reasons could be
because “respondents are known to underestimate both latent illness and chronic
illness and the perception of being ill is known to be dependent on cultural
factors, health awareness and access to care” Sundarraman and Muraleedharan (2015). The NSS surveys had collected
responses on the underlying reasons for ‘not seeking treatment’ for their ailments,
which could be due to: (a) non-availability of medical facility nearby; (b)
lack of faith; (c) lengthy waiting period; (d) financial reasons; (e) ailment
not regarded as serious; and (f) all other remaining reasons. In rural and
urban India, 15.4% and 1.3% of ailments respectively were not treated due to
lack of medical facility in 2014. The access to a nearby medical facility in
rural areas is a cause of concern. This suggests that a particular segment of
the population is denied access to basic primary healthcare.
The cost and
affordability of seeking care also plays a significant role in whether or not the poor and vulnerable individuals seek
medical attention. The number of respondents from rural and urban areas who
stated that they were unable to receive medical treatment during the NSS rounds
increased, which suggests that the gap in access to healthcare is expanding. It
has been noted that when there is an illness, the poor are more prone to
mention financial costs as justifications for skipping care. Both rural and urban
areas have seen an increase in this tendency over time Balarajan et al. (2011). According to a previous survey,
approximately half of those in the lowest quintile of spending avoid medical
care due to cost Gumber (1997). In some of the poorest states, the
main barrier to receiving treatment was financial. The proportion of untreated
illnesses in rural versus urban areas was significantly correlated, according
to state-level data, and the size of the correlation coefficient grew over
time, going from 0.643 in 2004 to 0.815 in 2014. This demonstrates unequivocally
that both rural and urban populations are impacted by state-level socioeconomic
conditions and the size of health infrastructure.
3.2. Public and Private Healthcare Providers
The
health of the impoverished is significantly influenced by access to public
health services. People might be forced to pay exorbitant fees or decide not to
use any health services at all if they don't have a choice Sen et al. (2002). It is critical to comprehend the
role played by public health providers in both inpatient and outpatient care in
a nation where private health spending hovers around 60% on average. The
private sector's involvement in the delivery of health care is expanding
quickly. The government actively promotes the entry of new private players by
offering tax breaks and subsidising land and capital for the construction of
hospitals. The inter-state examination of private health providers' growth
through time could not be done in this paper since there are no official records
for keeping track of hospitals, nursing homes, and clinics in rural and urban
locations. However, Hooda (2015) compiled the estimates from various
sources including NSSO Enterprise Surveys and estimated that there were 1.04
million private health enterprises in India in 2010-11 (See Table 2). Their number expanded
considerably in the post-liberalisation phase of 1990s which further got accelerated
exponentially in the 2000s specifically in urban locations (the share of
private health enterprises in rural locations in 2010-11 was just 18%).
The
public health sector has grown throughout time as well, although in the last 10
years the expansion of number of hospitals and beds increased substantially. This
was primarily motivated by the need to promote institutional births and lower
maternal and newborn mortality rates in order to achieve the global sustainable development
objectives agenda. The improvement indicator of people served per hospital bed
between 2004 and 2014 reflects some of these developments. It's interesting to
note that the expansion of the public health sector in rural areas has received
a much fairer allocation than the expansion of the private health sector, which
dominated in urban areas in the 2000s. According to the MoHFW's
National Health Profile, which is shown in Table 2 for the period 2004–14, the
quantity of public hospital beds in rural areas actually grew
at a much faster pace from 111,872 to 183,602 (64% rise) than in urban areas
from 357800 to 492177 (38% rise).
However,
the rate of growth of government hospital beds in rural areas varied greatly by
state; Jammu and Kashmir showed the largest decadal growth (222%), followed by
Rajasthan (182%), Tamil Nadu (176%), and Uttar Pradesh (172%). On the other hand,
during the same time period, Punjab and Gujarat saw a
decline in the number of hospital beds in rural areas. The National Rural
Health Mission financing has resulted in the misclassification or
reclassification of several urban hospitals as rural hospitals over time, and
some states have classified CHCs or upgraded PHCs as rural hospitals. As a
result, these results should be evaluated with caution. Because of this, we
have seen negative or insignificant growth rates in the number of government
hospital beds in urban areas during 2004-14 in various states, including Bihar,
Andhra Pradesh, and Rajasthan.
In Jammu
and Kashmir (196%), Uttar Pradesh (89%), Assam (81%) and Madhya Pradesh (72%),
there was a noticeable increase in the number of government rural and urban
hospital beds between 2004 and 2014. The population served per government
hospital bed increased in Gujarat, Andhra Pradesh, and Bihar between 2004 and
2014 due to a decline in the number of government hospital beds in these
states. Bihar, Andhra Pradesh, and Uttar Pradesh's public health
infrastructure, as measured by the population served per hospital bed, remained
deficient in 2014. On the other end of the spectrum, Himachal Pradesh, Kerala,
and West Bengal provided better health infrastructure.
3.3. Reliance on Public Health Services for Inpatient Care
The
information in Table 3 demonstrates that at all-India
level, the share of public providers in inpatient care for rural residents though
declined from 59.7% in 1986-87 to 41.7% in 2004 but exhibited improvement to 50.3%
in 2014. During 1986 to 2014, the decline in the share of public providers for
rural people is relatively less, compared to the decline witnessed for urban people
at all-India level. The share of public providers in urban India fell from
60.3% in 1986-87 to 35.5% in 2014. If we consider only 2004-2014 period, in
contrast to increase in utilisation for rural residents, the share of public
providers decreased slightly from 38.2% to 35.5% for urban residents.
At the
state level, the situation is more or less comparable
to that of all-India, where a general reduction between 1986–1987 and 2014 is
visible, although an increase in the share of public providers is noted between
the years of 2004 and 2014. Haryana,
Himachal Pradesh, Madhya Pradesh, Odisha, Punjab, Rajasthan, Tamil Nadu, and
Uttar Pradesh all adhere to this pattern.
Even
while a few states recorded a decrease in the proportion of public providers in
1995–96 compared to 1986–1987, they subsequently consistently improved. This
group includes Madhya Pradesh and Assam. Public providers for inpatient
treatment for rural people have consistently decreased in Andhra Pradesh,
Gujarat, Karnataka, Kerala, and Maharashtra from 1986 to 1987. This is
concerning, as the percentage is lower than the 2014 average for all-India.
Andhra
Pradesh, Gujarat, Haryana, Karnataka, Kerala, Rajasthan, Maharashtra, and West
Bengal are the states that exhibit a constant fall in the share of public
providers for inpatient treatment in urban areas, similar to
the situation for all-India. The share of public providers in other
states—aside from Rajasthan and West Bengal—is lower than the national average.
Assam, Bihar, and Punjab are states that have experienced a revival over the
past ten years (2004–2014). While Uttar Pradesh's ranking stayed stable, Madhya
Pradesh's standing somewhat worsened in 2014 compared to 2004.
In rural
areas the increase in availability of government hospital beds over time
directly altered the healthcare utilisation pattern for rural residents. First of all, the inter-state correlation coefficient
between population served per government hospital bed with percentage share of
treated illnesses in 2014 was highly significant (-0.720 for rural and -0.611
for urban areas). Further, the population served per government hospital bed
was also significantly correlated (-0.619) with percentage change in share of
treated illnesses between 2004 and 2014 in rural areas; thus
signifying improvement in the access to government health facilities in a state
leads to better health seeking behaviour for their rural residents.
The
improvement (reduction) in reliance on public health facilities for inpatient
care particularly by rural populations in various states during 2004-14 is
directly associated with the expansion (contraction) of government health
infrastructure. Assam, Madhya Pradesh, Punjab, and Uttar Pradesh exhibited an
upward directional relationship, while Andhra Pradesh and Gujarat showed a
downward directional association. Haryana, Himachal Pradesh, and Kerala showed
a stable position, while the remaining states showed a mixed association. The
percentage share of public providers for inpatient care and variations in the
number of government hospital beds were generally shown to be positively
correlated at the state level (0.532 for 2004; 0.500 for 2014). We also
discovered a negative correlation between the number of private enterprises per
100,000 people (as shown in Table 2) and the percentage share of public
providers in inpatient care (-0.536 for 2004 and -0.593 for 2014) for 17 major
states. Hooda (2015) observed that the expansion of
private health enterprises at the state level was negatively correlated with
the reliance on public hospitals.
3.4. Share of Public Providers for Outpatient Care
For both
rural (28.3%) and urban (21.2%) people across all of India, the reliance on
public providers for outpatient care in 2014 was found to be significantly
lower than that for inpatient care. It is interesting to note that compared to
1986–1987, the proportion of public providers providing outpatient care to
rural households has improved in 2014. Assam, Kerala, Madhya Pradesh, Odisha,
Punjab, Tamil Nadu, Uttar Pradesh, and West Bengal are the states that are
following this trend, whereas the other nine states have experienced a fall.
Since 1986–1987, only Haryana has had a continuous fall. We have seen that two
of those nine states—Bihar and Maharashtra—restored reliance on public providers
between 2004 and 2014.
Even in urban
India, the percentage of public providers for outpatient treatment has
decreased from 1986–1987, though stagnation was seen between 1995–1996 and
2004. Since 1986–1987, the share of public providers in urban Karnataka and
West Bengal areas has consistently decreased. Since 2004, a few states,
including Assam, Kerala, Maharashtra, Punjab, and Uttar Pradesh, seem to have
resumed relying on public services. In urban areas of Andhra Pradesh, Bihar,
Gujarat, Haryana, Himachal Pradesh, Jammu and Kashmir, Madhya Pradesh, Odisha,
and Rajasthan, the proportion of public providers providing outpatient care has
decreased since 2004.
To some
extent in 2014, the public providers in outpatient care has played a dominant
role for either rural or urban or in both populations of hilly states of India
(Assam, Himachal Pradesh, and Jammu and Kashmir) and in Odisha. Additionally,
between 2004 and 2014, states that expanded their public health infrastructure
also saw an improvement in how many people used outpatient treatments. We
discovered a strong negative association (-0.521) between the percentage share
of public providers in outpatient care for urban areas in 2014 (as shown in Table 2) for 17 major states and the
population served by a government hospital bed.
Table 2
|
Table 2 Distribution of Government Hospital
Beds in Rural and Urban areas (2004 and 2014) and Private Health Enterprises
(2010-11) by Major States |
||||||||||||
|
Major States |
Government Hospital Beds** |
Population served per Govt. Hospital Bed** |
Private Health Enterprises* (2010-11) |
|||||||||
|
Rural Areas |
Urban Areas |
All Areas |
||||||||||
|
2004 |
2014 |
% Annual Change |
2004 |
2014 |
% Annual Change |
% Annual Change |
2004 |
2014 |
% Annual Change |
Number |
Per 100,000 population |
|
|
Andhra
Pradesh |
3005 |
7380 |
14.56 |
32106 |
12468 |
-6.12 |
-4.33 |
2297 |
4381 |
9.07 |
74603 |
88 |
|
Assam |
3000 |
7504 |
15.01 |
4382 |
5877 |
3.41 |
8.13 |
3800 |
2369 |
-3.77 |
7109 |
23 |
|
Bihar* |
4440 |
10129 |
12.81 |
23468 |
6837 |
-7.09 |
-3.92 |
4419 |
8130 |
8.40 |
79322 |
58 |
|
Gujarat |
11893 |
8945 |
-2.48 |
23163 |
18983 |
-1.80 |
-2.02 |
1564 |
2196 |
4.04 |
46111 |
76 |
|
Haryana |
1068 |
2454 |
12.98 |
6050 |
5210 |
-1.39 |
0.77 |
3185 |
3481 |
0.93 |
36312 |
143 |
|
Himachal
Pradesh |
2388 |
3328 |
3.94 |
5398 |
5448 |
0.09 |
1.27 |
817 |
795 |
-0.27 |
4302 |
63 |
|
Jammu
& Kashmir |
1820 |
5867 |
22.24 |
1475 |
3893 |
16.39 |
19.62 |
3212 |
1245 |
-6.12 |
4953 |
39 |
|
Karnataka |
7320 |
9884 |
3.50 |
33984 |
43138 |
2.69 |
2.84 |
1343 |
1154 |
-1.41 |
48178 |
79 |
|
Kerala |
7771 |
18082 |
13.27 |
18068 |
20318 |
1.25 |
4.86 |
1299 |
918 |
-2.93 |
34846 |
104 |
|
Madhya
Pradesh* |
10398 |
11542 |
1.10 |
12869 |
28657 |
12.27 |
7.28 |
3553 |
2532 |
-2.87 |
65779 |
67 |
|
Maharashtra |
11460 |
12398 |
0.82 |
30593 |
39048 |
2.76 |
2.23 |
2409 |
2277 |
-0.55 |
95684 |
85 |
|
Odisha |
4721 |
7099 |
5.04 |
8425 |
9584 |
1.38 |
2.69 |
2971 |
2505 |
-1.57 |
19782 |
47 |
|
Punjab |
4590 |
2900 |
-3.68 |
4383 |
8904 |
10.31 |
3.16 |
2824 |
2420 |
-1.43 |
40489 |
146 |
|
Rajasthan |
7465 |
21088 |
18.25 |
24615 |
10760 |
-5.63 |
-0.07 |
1910 |
2229 |
1.67 |
40490 |
59 |
|
Tamil
Nadu |
3318 |
9150 |
17.58 |
40249 |
55093 |
3.69 |
4.75 |
1498 |
1069 |
-2.86 |
43605 |
60 |
|
Uttar
Pradesh* |
9900 |
27146 |
17.42 |
25963 |
40764 |
5.70 |
8.94 |
5796 |
3472 |
-4.01 |
245662 |
117 |
|
West
Bengal |
10946 |
19684 |
7.98 |
47570 |
58882 |
2.38 |
3.43 |
1447 |
1170 |
-1.91 |
112470 |
123 |
|
All |
111872 |
183602 |
6.41 |
357800 |
492177 |
3.76 |
4.39 |
2336 |
1833 |
-2.15 |
1035497 |
86 |
|
Source: * NSS 2010-2011 (67th Round),
Unincorporated Non-Agricultural Enterprises; Hooda (2015: p14). ** National Health Profile for
various years, Centre Bureau of Health Intelligence, DGHS, MoHFW, Govt. of India, New Delhi. Notes: For a couple of states data
for government rural/urban hospital beds were not available for 2004 or 2014;
these were replaced by later years. |
||||||||||||
Table 3
|
Table 3
Share of Public Providers in Treated Illnesses, 1986-87 to 2014 |
||||||||||||||||
|
State |
Inpatient Care |
Outpatient Care |
||||||||||||||
|
Rural |
Urban |
Rural |
Urban |
|||||||||||||
|
1986- 87 |
1995- 96 |
2004 |
2014 |
1986- 87 |
1995- 96 |
2004 |
2014 |
1986- 87 |
1995- 96 |
2004 |
2014 |
1986 -87 |
1995- 96 |
2004 |
2014 |
|
|
Andhra Pradesh |
30.8 |
22.2 |
27.4 |
26.7 |
41.7 |
35.4 |
35.8 |
23.7 |
21.6 |
22.0 |
22.3 |
15.6 |
22.6 |
19.0 |
20.4 |
12.2 |
|
Assam |
89.8 |
69.2 |
75.0 |
91.7 |
82.4 |
63.0 |
55.2 |
62.6 |
53.0 |
29.0 |
35.6 |
84.3 |
29.6 |
22.0 |
29.1 |
44.6 |
|
Bihar |
50.1 |
24.1 |
21.7 |
56.1 |
46.8 |
31.9 |
26.5 |
49.1 |
16.9 |
13.0 |
7.8 |
13.9 |
18.0 |
33.0 |
16.9 |
12.3 |
|
Gujarat |
56.0 |
31.4 |
31.3 |
27.5 |
61.8 |
36.3 |
26.1 |
24.5 |
35.1 |
25.0 |
22.0 |
23.7 |
19.6 |
22.0 |
18.0 |
15.0 |
|
Haryana |
54.1 |
30.3 |
20.6 |
39.9 |
56.7 |
37.0 |
29.0 |
23.2 |
16.9 |
13.0 |
12.0 |
10.6 |
21.7 |
11.0 |
19.9 |
8.5 |
|
Himachal Pradesh |
88.0 |
86.5 |
78.1 |
77.3 |
78.9 |
91.3 |
89.7 |
75.5 |
60.7 |
39.0 |
68.6 |
43.3 |
47.7 |
48.0 |
86.1 |
79.4 |
|
Jammu & Kashmir |
96.5 |
97.7 |
91.2 |
94.0 |
96.1 |
95.9 |
86.4 |
82.2 |
59.8 |
44.0 |
53.8 |
48.4 |
47.4 |
28.0 |
50.9 |
41.0 |
|
Karnataka |
59.8 |
45.0 |
40.0 |
37.3 |
50.0 |
29.3 |
28.9 |
23.2 |
36.4 |
26.0 |
34.6 |
26.1 |
31.3 |
17.0 |
16.7 |
14.5 |
|
Kerala |
43.6 |
39.5 |
35.6 |
34.4 |
56.3 |
37.3 |
34.6 |
33.0 |
34.0 |
28.0 |
38.0 |
36.3 |
34.8 |
28.0 |
24.0 |
31.1 |
|
Madhya Pradesh |
80.4 |
40.4 |
57.2 |
67.4 |
79.0 |
54.7 |
48.7 |
48.2 |
27.1 |
23.0 |
22.7 |
29.5 |
25.9 |
19.0 |
24.8 |
24.0 |
|
Maharashtra |
45.8 |
30.9 |
28.7 |
26.9 |
49.4 |
30.7 |
28.0 |
24.4 |
36.5 |
16.0 |
17.4 |
20.2 |
35.3 |
17.0 |
11.7 |
14.6 |
|
Odisha |
90.7 |
84.2 |
79.1 |
84.2 |
82.2 |
77.9 |
73.1 |
61.4 |
52.7 |
38.0 |
56.8 |
75.5 |
47.9 |
34.0 |
58.3 |
54.4 |
|
Punjab |
49.2 |
37.7 |
29.4 |
36.1 |
52.0 |
26.5 |
26.4 |
31.7 |
13.4 |
7.0 |
17.6 |
16.8 |
15.6 |
6.0 |
18.9 |
22.5 |
|
Rajasthan |
81.0 |
63.3 |
52.1 |
65.6 |
86.5 |
72.1 |
63.7 |
58.0 |
56.1 |
36.0 |
45.5 |
44.1 |
57.5 |
41.0 |
53.9 |
29.1 |
|
Tamil Nadu |
56.9 |
40.4 |
40.8 |
45.4 |
58.2 |
34.2 |
37.2 |
32.6 |
38.7 |
25.0 |
30.7 |
42.3 |
35.5 |
28.0 |
22.1 |
28.6 |
|
Uttar Pradesh |
58.3 |
46.1 |
27.8 |
43.9 |
61.1 |
39.0 |
31.5 |
31.6 |
10.4 |
8.0 |
11.7 |
14.6 |
17.2 |
9.0 |
15.3 |
16.1 |
|
West Bengal |
91.9 |
79.9 |
78.7 |
77.5 |
75.9 |
71.3 |
65.4 |
55.1 |
19.6 |
15.0 |
21.1 |
22.5 |
25.3 |
19.0 |
21.4 |
14.8 |
|
All-India |
59.7 |
43.8 |
41.7 |
50.3 |
60.3 |
41.9 |
38.2 |
35.5 |
25.6 |
19.0 |
24.1 |
28.3 |
27.2 |
20.0 |
20.0 |
21.2 |
3.5. Provision of Free Health Services by the Public Sector
In the
delivery of free healthcare services for both inpatient and outpatient care,
private sector organisations have a very little role. As a result, free medical
care is available to people who use government facilities. Table 4 gives data on the proportion of
patients who got free hospital beds (as a proxy for free inpatient care) and
free medicine (as a proxy for free outpatient care) in order
to capture this element.
Similar to
the share of public providers in rural areas, free provision of beds in
inpatient care has decreased from 60.7% in 1986-87 to 37% in 2004 and then
improved to 47.3% in 2014 at the all-India level. In urban areas across all-India,
a same trend is also evident, but the percentage rise from 2004 to 2014 is just
2.6. However, as pointed out by Sundarraman and Muraleedharan
(2015), this pattern shows how public
health care consumption is geared towards the poor. Most states, particularly
for rural residents, follow this tendency, including Bihar, Haryana, Jammu and
Kashmir, Kerala, Madhya Pradesh, Maharashtra, Punjab, Rajasthan, Tamil Nadu,
Uttar Pradesh, and West Bengal. No state has a steadily rising trend in its
free hospital bed offerings. While free bed provisions in Assam and Himachal
Pradesh continue to fall, they have stagnated in Odisha since 2004. In terms of
providing free beds for rural inhabitants, Assam outperformed all other states
in 1986–1987 with a 95.5% share; however, by 2014, this percentage had dropped
to just 50.6.
As was
already mentioned, in 2014, all of India saw a slight improvement in the free
availability of beds in urban areas. This pattern is seen in the urban areas of
Assam, Bihar, Gujarat, Haryana, Kerala, Madhya Pradesh, Maharashtra, and
Punjab. The number of free beds available to the urban population in some
states has consistently decreased between 1986–1987 and 2014; these states
include Andhra Pradesh, Jammu & Kashmir, Odisha, Rajasthan, Tamil Nadu, and
West Bengal. Even lower than the national average of 34.6% is the proportion of
free bed providing in urban Andhra Pradesh, Gujarat, Haryana, Karnataka,
Maharashtra, and Punjab. Again, no state exhibits a rising trend in the
provisioning of free beds.
Table 4
|
Table 4 Percentage of Patients Receiving Free Hospital Bed and Free Medicine
1986-87 to 2014 |
||||||||||||||||
|
State |
Free Hospital
Bed (Inpatient care) |
Free
Medicines (Outpatient care) |
||||||||||||||
|
Rural
Inpatient |
Urban
Inpatient |
Rural
Outpatient |
Urban
Outpatient |
|||||||||||||
|
1986- 87 |
1995- 96 |
2004 |
2014 |
1986- 87 |
1995- 96 |
2004 |
2014 |
1986- 87 |
1995- 96 |
2004 |
2014 |
1986- 87 |
1995- 96 |
2004 |
2014 |
|
|
Andhra Pradesh |
33.3 |
21.9 |
31.1 |
32.8 |
41.3 |
36.8 |
33.9 |
30.1 |
20.8 |
20.1 |
10.3 |
9.3 |
24.2 |
8.5 |
6.9 |
7.5 |
|
Assam |
95.5 |
76.5 |
60.2 |
50.6 |
76.1 |
58.0 |
41.3 |
42.9 |
31.0 |
12.6 |
2.7 |
2.6 |
10.5 |
6.0 |
5.6 |
3.9 |
|
Bihar |
47.7 |
20.0 |
22.4 |
48.2 |
56.5 |
38.9 |
30.4 |
41.8 |
5.2 |
1.5 |
0.2 |
1.1 |
26.6 |
10.4 |
3.7 |
0.4 |
|
Gujarat |
40.0 |
26.1 |
27.7 |
26.3 |
39.4 |
25.4 |
18.7 |
22.8 |
21.5 |
9.5 |
8.6 |
15.0 |
13.9 |
10.2 |
11.7 |
8.8 |
|
Haryana |
54.0 |
29.6 |
11.6 |
32.8 |
53.3 |
16.7 |
20.1 |
22.2 |
8.2 |
3.7 |
1.3 |
0.4 |
12.2 |
1.7 |
3.2 |
2.0 |
|
Himachal Pradesh |
86.5 |
79.0 |
74.1 |
70.0 |
77.3 |
71.0 |
80.5 |
48.3 |
24.1 |
4.5 |
3.6 |
0.9 |
8.8 |
6.8 |
9.0 |
0.5 |
|
Jammu &
Kashmir |
93.4 |
96.8 |
83.2 |
91.1 |
91.6 |
88.1 |
78.5 |
75.2 |
20.3 |
5.1 |
3.6 |
1.1 |
12.7 |
5.2 |
2.8 |
0.4 |
|
Karnataka |
58.8 |
37.8 |
38.2 |
32.9 |
36.6 |
25.3 |
28.2 |
20.8 |
26.5 |
16.3 |
14.6 |
4.9 |
25.4 |
8.2 |
4.8 |
3.4 |
|
Kerala |
45.1 |
37.5 |
33.6 |
35.4 |
45.2 |
31.7 |
29.5 |
31.3 |
29.8 |
9.3 |
11.1 |
14.4 |
25.4 |
8.7 |
6.6 |
9.3 |
|
Madhya Pradesh |
77.2 |
39.2 |
49.1 |
64.6 |
73.3 |
49.1 |
41.6 |
47.0 |
24.5 |
3.3 |
2.9 |
12.2 |
17.9 |
7.8 |
7.7 |
8.2 |
|
Maharashtra |
42.8 |
28.7 |
22.5 |
25.3 |
39.7 |
28.6 |
20.6 |
23.1 |
17.0 |
8.6 |
6.3 |
11.4 |
21.9 |
8.8 |
4.5 |
7.0 |
|
Odisha |
88.7 |
83.1 |
78.8 |
78.8 |
88.0 |
75.2 |
65.1 |
55.2 |
25.0 |
8.0 |
7.8 |
4.9 |
24.6 |
5.0 |
5.1 |
4.2 |
|
Punjab |
46.3 |
26.8 |
11.5 |
30.5 |
46.1 |
18.7 |
10.7 |
16.8 |
6.5 |
0.6 |
1.2 |
1.8 |
7.6 |
2.3 |
1.6 |
4.0 |
|
Rajasthan |
81.8 |
65.8 |
50.8 |
66.9 |
84.9 |
70.5 |
61.3 |
56.0 |
15.6 |
0.1 |
3.2 |
24.5 |
17.5 |
9.8 |
7.5 |
17.8 |
|
Tamil Nadu |
59.5 |
42.9 |
42.5 |
52.0 |
57.8 |
38.9 |
37.8 |
36.8 |
37.3 |
27.8 |
25.7 |
35.3 |
34.3 |
25.1 |
20.6 |
24.4 |
|
Uttar Pradesh |
59.1 |
39.8 |
16.8 |
39.8 |
56.1 |
32.6 |
21.8 |
34.7 |
6.0 |
1.8 |
2.2 |
3.0 |
10.5 |
4.0 |
4.5 |
6.7 |
|
West Bengal |
90.4 |
79.6 |
71.8 |
72.6 |
69.4 |
64.5 |
51.9 |
48.7 |
15.4 |
3.7 |
4.0 |
2.6 |
18.5 |
8.2 |
4.9 |
1.5 |
|
All-India |
60.7 |
41.6 |
37.0 |
47.3 |
55.2 |
38.2 |
32.0 |
34.6 |
17.5* |
7.7 |
6.4 |
9.4 |
19.7* |
9.3 |
6.8 |
9.3 |
|
Note: * denotes the All-India average based on the weighted average of 17
major states (states are weighted according to their share in the total
estimated hospitalised / ill persons). |
||||||||||||||||
3.6. Provision of Free Medicines
People
become prone to debt when they purchase medications, especially when they do so
frequently for a chronic illness. Provision of free medications would
significantly lessen this vulnerability. The NHA 2014–15 estimates that the
overall pharmaceutical spending in 2014–15 was Rs. 171025 crores, or 37.9% of
the current health expenditures (CHE). According to the NHA 2014–15,
pharmaceutical spending includes money spent on prescription drugs used in
medical interactions, money spent on self-medication (often referred to as
over-the-counter products), and money spent on pharmaceuticals used in
inpatient and outpatient care from prescribing physicians (Government of India,
2017a, p. 10). Prescription drugs made up Rs. 128887 crores, or 28.6%, of the
total Rs. 451286 crores of the CHE (Government of India, 2017a, p. 22).
Overall,
provision of free medicines during 1986-87 to 2014 decreased to 9.4% and 9.3%
in rural and urban areas at all-India level. Tamil Nadu is the only state where
more than 25% of rural patients have received free medicines; whilst this
percentage is lower for urban patients. Tamil Nadu and Rajasthan are the two
states where the percentage of patients reporting free medicines in 2014 is
high for both rural and urban populations, thanks to the drug procurement model
adopted in both the states.
According
to reports, more than 20% of rural patients in 10 states received free
medications in 1986-87. In 1995–96, there were only two states left (Andhra
Pradesh and Tamil Nadu), and by 2004 there was only one state left (Tamil
Nadu). However, Rajasthan and Tamil Nadu both appear on this list in 2014. In
Haryana, Himachal Pradesh and Jammu and Kashmir, less
than 1% of rural patients have reported getting free medicines and in another
seven states this was less than 5%.
In the
urban areas also, free provisioning of medicines which was at 19.7% in 1986-87
has decreased to 9.3% in 2014 (though better than the 6.3% in 2004). All the
states, including Tamil Nadu that is hailed as the model for other states to
follow in provisioning of medicines Lalitha (2009) have recorded steep decline in the
free provisioning of medicines in 2014 compared to 1986-87.
The fact
that the share of medications in inpatient and outpatient treatment is higher
than that of other components shows how much of a burden this is on the
population. According to Berman et al. (2010)'s analysis, the OOP expenditure to
cover healthcare expenditures, particularly those brought on by the lack of
free drugs, will further bankrupt the poor. Additionally, we observe a
discrepancy between the states that have improved urban services and those that
have improved rural services. Concerningly, "among various components,
highest expenditure was incurred on medicine both in public and private health
care institutions and this varied within a range of 38-66 percent" (p.31),
according to the National Health Accounts for 2004–2005. In public health care
facilities, around 66% of expenditures were made on medicine for the rural
population, compared to a slightly lower 62% for the urban population (Table 5). The cost of medicines in the
public sector has increased as a result of the lack of
medications for inpatient care.
Table 5
|
Table 5 Components of Inpatient Care Expenditure in
Public and Private Sector (%) |
||||||||
|
Type of
Hospital |
Sector |
Doctor's fee |
Diagnostic Test |
Bed etc. |
Medicine |
Blood etc. |
Food |
Total |
|
Private |
Rural |
26 |
9 |
17 |
40 |
3 |
5 |
100 |
|
Urban |
27 |
11 |
17 |
38 |
4 |
3 |
100 |
|
|
Public |
Rural |
4 |
12 |
4 |
66 |
4 |
9 |
100 |
|
Urban |
5 |
15 |
6 |
62 |
5 |
8 |
100 |
|
|
Source:
Government of India. (2005): Table 4.3, National Health Accounts,
2004-05. |
||||||||
3.7. Cost and Burden of Treatment
Without a
question, cost is the main factor to take into account
when deciding between a public and private institution, particularly for the
treatment of chronic and serious illnesses. The National Health Policy 2015
states that 60% of inpatient care and 80% of outpatient care are provided by
the private sector. The statistics in Table 6 show how much more expensive
private hospitals are as compared to public hospitals. Between 1986–1987 and
2014, the ratio of the cost of treatment for inpatient care at constant prices
nearly quadrupled (from 1.6 to 4.5) for rural residents and nearly doubled
(from 2.4 to 4.1) for urban residents at the national level in India. It is interesting
to note that the gap in inpatient costs between private and public providers in
rural and urban areas is narrowing down. Alternatively, it implies that the
cost of treatment between private and public hospitals is closing in the 2000s.
This could be due to the following factors:
(1) severe competition within the private sector has brought down prices for
their services; (2) public sector has started levying user charges in several
states which in turn increased their cost of treatment, almost equivalent to the
private sector; and (3) user fees has been implemented for the services
provided by the private sector under the scheme of public-private partnership. User fees for hospital
services were first instituted in Karnataka in 1996, followed by Odisha, Madhya
Pradesh, 1998, Uttar Pradesh, 2000, West Bengal, and Rajasthan in 2001 Shariff and Mondal (2009).
It would
be interesting to examine the cost trend for both rural and urban residents in
various states. Assam, Kerala,
Rajasthan, and Tamil Nadu all had an increase in the private-public cost ratio
for inpatient care for rural population during the course of
the four-year period (1986–87 to 2014). Implicitly, it shows the growing cost
difference between private and public hospitals in these states, which may be
related to the public hospitals' superior performance in these states. Does the
relative cost of therapy for rural individuals decrease over time in any
states? Several states reported lower costs in 1995–96 than in 1986–87, but
then increased costs in 2004 and 2014.
These
include West Bengal, Bihar, Gujarat, Jammu and Kashmir, Karnataka, Odisha,
Tamil Nadu, and Uttar Pradesh. For rural inhabitants requiring inpatient care,
we have observed an increase in costs between private and public providers in
14 of the 17 states since 2004. Kerala, Madhya Pradesh, Rajasthan, and Tamil
Nadu have the largest cost ratio differences, with the private sector becoming
much more expensive. The Tamil Nadu situation is really odd.
Tamil Nadu has the greatest private-public cost ratio across all years. Only
Tamil Nadu has recorded a double-digit ratio, specifically in 2004 and 2014,
demonstrating the stark contrast between public and private providers for both
rural and urban populations (24.8 and 17.9, respectively). In contrast, these
ratios have remained stable throughout all four periods only in Gujarat for
both rural and urban populations
(ranged between 2.1 and 2.9 only).
Between
1986–1987 and 2014, the cost ratios for urban people increased in Andhra
Pradesh and Assam while being stable in Gujarat, Madhya Pradesh, Punjab, Uttar
Pradesh, and West Bengal. The majority of states have seen an increase in the cost of
inpatient care for urban inhabitants over the past ten years (2004–2014)
between private and public providers. The ratio across all of India increased
to 4.1 in 2014 from 3.1 in 2004, but it stayed below the norm in eight states
(Bihar, Haryana, Gujarat, Himachal Pradesh, Madhya Pradesh, Punjab, Rajasthan,
and Uttar Pradesh). In contrast, the
cost ratio in Himachal Pradesh decreased from 3.4 in 2004 to 1.1 in 2014,
showing that the price of inpatient care for urban patients ended up being the
same at public and private hospitals.
Table 6
|
Table 6 Ratio of Cost of Treatment
between Private and Public Provider, 1986-87 to 2014 |
||||||||||||||||
|
State |
Inpatient |
Outpatient |
||||||||||||||
|
Rural |
Urban |
Rural |
Urban |
|||||||||||||
|
1986- 87 |
1995- 96 |
2004 |
2014 |
1986- 87 |
1995- 96 |
2004 |
2014 |
1986- 87 |
1995- 96 |
2004 |
2014 |
1986- 87 |
1995- 96 |
2004 |
2014 |
|
|
Andhra Pradesh |
2.2 |
3.8 |
2.5 |
4.0 |
5.2 |
5.4 |
9.1 |
8.4 |
1.8 |
4.1 |
1.8 |
2.4 |
4.2 |
2.3 |
2.6 |
1.8 |
|
Assam |
0.6 |
1.0 |
1.9 |
4.5 |
3.4 |
3.2 |
7.5 |
5.7 |
0.8 |
0.6 |
1.5 |
1.6 |
0.4 |
0.9 |
0.9 |
5.5 |
|
Bihar |
1.3 |
1.2 |
1.6 |
3.6 |
1.6 |
1.6 |
0.9 |
3.5 |
0.6 |
1.2 |
0.6 |
0.4 |
1.7 |
3.0 |
0.8 |
0.7 |
|
Gujarat |
2.3 |
2.2 |
2.8 |
2.1 |
2.9 |
2.2 |
2.6 |
2.9 |
1.6 |
2.3 |
1.6 |
3.1 |
1.5 |
1.7 |
2.7 |
1.5 |
|
Haryana |
1.5 |
1.3 |
0.5 |
2.7 |
1.9 |
0.6 |
0.6 |
2.7 |
1.6 |
0.8 |
1.4 |
1.1 |
1.9 |
0.5 |
1.1 |
1.6 |
|
Himachal
Pradesh |
1.8 |
1.1 |
2.4 |
2.2 |
3 |
3.2 |
3.4 |
1.1 |
0.8 |
NE |
0.7 |
0.9 |
1.3 |
NE |
1.7 |
0.9 |
|
Jammu &
Kashmir |
2.1 |
1.0 |
2.3 |
6.2 |
5.5 |
2.6 |
5.5 |
4.3 |
0.8 |
NE |
1.2 |
1.3 |
1.0 |
NE |
0.6 |
2.5 |
|
Karnataka |
2.8 |
2.3 |
3.1 |
5.2 |
3.3 |
2.9 |
6.2 |
6.4 |
1.8 |
2 |
2.1 |
1.4 |
1.4 |
1.4 |
1.8 |
1.5 |
|
Kerala |
1.6 |
1.7 |
2.1 |
7.4 |
2.6 |
1.5 |
1.9 |
6.8 |
1.5 |
1.6 |
1.3 |
1.9 |
1.6 |
1.6 |
1.2 |
1.9 |
|
Madhya Pradesh |
1.7 |
1.6 |
1.8 |
8.8 |
2.8 |
2.3 |
3.5 |
2.5 |
1.7 |
1.7 |
1.0 |
1.1 |
1.9 |
0.5 |
1.8 |
2.3 |
|
Maharashtra |
2.9 |
2.5 |
3.2 |
6.1 |
5.1 |
3.7 |
3.8 |
7.6 |
1.2 |
2.0 |
1.3 |
2.9 |
1.3 |
1.6 |
2.7 |
2.5 |
|
Odisha |
2.0 |
1.5 |
2.6 |
5.6 |
0.9 |
5.5 |
2.3 |
5.3 |
0.7 |
1.2 |
1.0 |
1.0 |
1.9 |
0.9 |
0.6 |
2.1 |
|
Punjab |
1.3 |
1.7 |
1.4 |
3.4 |
2.1 |
1.1 |
2.2 |
2.5 |
0.8 |
1.2 |
0.8 |
1.1 |
1.0 |
0.8 |
0.3 |
0.7 |
|
Rajasthan |
1.1 |
1.5 |
1.7 |
6.6 |
1.2 |
1.9 |
1.8 |
3.4 |
0.9 |
0.8 |
0.4 |
2.2 |
1.0 |
1.3 |
1.1 |
0.8 |
|
Tamil Nadu |
9.0 |
5.8 |
13.4 |
24.8 |
12.4 |
6.2 |
10.5 |
17.9 |
5.1 |
7.5 |
4.0 |
4.1 |
4.1 |
5.0 |
13.6 |
2.4 |
|
Uttar Pradesh |
1.4 |
1.1 |
1.2 |
4.1 |
1.5 |
1.3 |
2.4 |
2.2 |
0.7 |
0.6 |
2.1 |
1.0 |
0.7 |
0.9 |
1.54 |
0.8 |
|
West Bengal |
6.0 |
2.1 |
4.3 |
3.6 |
5.6 |
5.8 |
4.0 |
5.5 |
1.4 |
0.8 |
1.1 |
1.4 |
1.9 |
1.9 |
1.1 |
1.4 |
|
All-India |
1.6 |
2.1 |
2.8 |
4.5 |
2.4 |
2.4 |
3.1 |
4.1 |
0.7 |
1.4 |
1.3 |
1.2 |
0.9 |
1.2 |
1.44 |
1.4 |
For both
rural and urban populations, the private-public cost ratio for outpatient
treatment is not as high as it is for inpatient care. The increase in the cost
gap between rural and urban areas in India as a whole has
been slower during the time period under examination. It's interesting to note
that in 2014, the cost difference for outpatient care is greater for rural
people of Andhra Pradesh, Gujarat, Maharashtra, Punjab, and Tamil Nadu compared
to urban residents. Tamil Nadu's outpatient costs are noticeably greater than
those in other states, similar to inpatient cost
ratios.
In some
jurisdictions, the outpatient cost of a private provider is less than the
national average, despite the fact that there is no
discernible pattern between rural and urban residents. In other words, in 2014,
both rural and urban people of Bihar and Himachal Pradesh found private
providers to be less expensive than public providers, whereas only urban
residents of Punjab, Rajasthan, and Uttar Pradesh found this to be the case.
Although there are user fees paid in public hospitals in Odisha, Rajasthan, and
Madhya Pradesh, it can also be claimed that the private sector prices have not
increased as much as in other states like Tamil Nadu or Karnataka, despite the fact that it is partly reflecting on the general
health seeking conduct of people. It can also be because the public sector in
such states performs better. “A well-functioning public health care system not
only assures effective services to those at the lower end of the socio-economic
hierarchy but can also set a ceiling for the prices and a norm for the quality
in the private sector. It can, therefore, be a major anchor for equity overall
in the health service system. Inter-state comparisons within India appear to
confirm this as states with better public health services have lower prices in
the private sector” (cited in Sen et al. (2002)).
3.8. Cost of Inpatient Treatment
For each hospitalisation episode in 2014, the average cost of treatment
(including fees, medications, clinical and diagnostic tests, surgery, and
hospital bed charges in real terms) was Rs. 3965 for rural people and Rs. 7109
for urban people across the nation (Table 7). Due to the cost of
living and the type of care sought, it makes sense that urban patients'
treatment costs were greater than those of rural patients. For both rural and
urban populations across all of India, the cost of treatment has grown in real
terms for inpatient care (Table 7). Gujarat, Himachal
Pradesh, Karnataka, Kerala, Madhya Pradesh, Maharashtra, Punjab, Tamil Nadu,
and West Bengal are among the states that have noticed this tendency,
especially among rural residents.
Kerala,
Tamil Nadu, and West Bengal had the highest annual percentage change in costs
for rural residents between 1986 and 2014 (22.1, 17.3, and 11.3, respectively),
which is significantly higher than the national average of 5.4%. In contrast,
this was the lowest in states that are comparatively less developed (Bihar,
J&K, Assam, Rajasthan, Odisha, and Uttar Pradesh). It is important to note
that, with the exception of Odisha (where there has
been a marginal drop), rural inhabitants in the majority of states had a sharp
increase in the cost of inpatient care in 1995-96. In every other state, either
2004 or 2014 saw a decrease in treatment expenses. As a result, 2.8 is the
national average for the percentage of yearly change from 1995 to 2014,
compared to 1.8 from 2004 to 2014.
Between 2004 and 2014, the percentage of yearly change in inpatient
costs for rural inhabitants in five states—Andhra Pradesh, Gujarat, Kerala,
Maharashtra, and West Bengal—was higher than the national average. In Assam,
Bihar, Haryana, Rajasthan, and Uttar Pradesh, rural residents have experienced
a negative yearly percentage change, indicating a decrease in the true cost of
treatment during 2014. Punjab reportedly had the highest inpatient cost for
rural people in 2014 (Rs. 7356), followed by Kerala (Rs. 5551) and Maharashtra
(Rs. 5369).
Similar to
the overall Indian trend, a rise has been seen in all four periods for the cost
of inpatient care for the urban population in 14 of the 17 states. Bihar, Jammu
and Kashmir, and Punjab are exceptions. Since the average yearly change for all
10 states between 1986 and 2014 was 8.1%, Tamil Nadu, Haryana, Andhra Pradesh,
Madhya Pradesh, Assam, and Kerala all saw very high growth rates of between 19%
and 21%. With the exception of Bihar, Jammu and
Kashmir, and Punjab, the percentage changes between 2004 and 2014 are negative.
Changes in the context of Gujarat, Haryana, and Rajasthan are less than the
national average of 3.9% among the remaining states where the change in cost is
positive. Overall, compared to other states, the cost of inpatient care was
greater for all inhabitants in Tamil Nadu, Punjab, and Haryana, while it was
lower in Jammu & Kashmir and Rajasthan.
At all-India
level, the cost of outpatient care for rural residents has increased from
Rs.141 (1986-87) to Rs.182 (2004) and then to Rs.176 (in 2014) (Table 8). But for urban residents,
outpatient costs have consistently increased from Rs.152 in 1986-87 to Rs.225
in 2014. At all-India level, the cost of outpatient care for rural residents
increased from 1986-87 to 2004 and then declined in 2014. Rural residents of Andhra Pradesh, Haryana,
and Karnataka exhibit this trend. Thus, there is an increase in treatment
expenses from 1986 to 2014, a drop from 1995 to 2014, and a flattening from
2004 to 2014. In some states, the cost
of outpatient care has decreased in 1995–1996 when compared to 1986–1987,
increased in 2004, and then decreased in 2014. This wave pattern is seen in
Kerala, Assam, Bihar, and Gujarat. In these situations, the cost in 2014 was
lower than the cost in 1986–1987, resulting in a negative annual change from
1986–2014. For rural residents, nine states—Haryana, Jammu and Kashmir, Karnataka,
Kerala, Madhya Pradesh, Odisha, Tamil Nadu, Uttar Pradesh, and West Bengal—have
seen changes that are more than the 0.9% national average.
In all
four time periods, outpatient costs for urban inhabitants in India as a whole increased, with an average yearly growth of 1.8%
from 1986 to 2014. A notable percentage change was observed in Assam, where
costs were at their lowest in 1986-87. Only Andhra Pradesh, Assam, Odisha (with
a very slight real-term increase nonetheless), and
Tamil Nadu have recorded a cost increase throughout the course of all four time
periods. Due to the sharp increase in costs in 2014, the annual change in
outpatient costs for urban residents in the recent ten years (2004-2014) has
increased by 2.8%, more than it did in 1986-2014 and 1995-2014. Assam, Haryana,
Himachal Pradesh, Rajasthan, and Tamil Nadu all experience a sharp increase in
cost in real terms.
People
should have enough insurance coverage to protect themselves from financial
risks due to the rising costs of treatment, especially for inpatient care, as
is covered in the section that follows
Table 7
|
Table 7 Cost of Treatment for
Inpatient Care, 1986-87 to 2014 (at 1993-94 prices) |
||||||||||||||
|
State |
Average Cost of Treatment (Rs) |
Annual Percentage Change |
||||||||||||
|
Rural inpatient |
Urban Inpatient |
Rural inpatient |
Urban inpatient |
|||||||||||
|
1986- 87 |
1995- 96 |
2004 |
2014 |
1986- 87 |
1995- 96 |
2004 |
2014 |
1986- 2014 |
1995- 2014 |
2004- 2014 |
1986- 2014 |
1995- 2014 |
2004- 2014 |
|
|
Andhra Pradesh |
1291 |
5273 |
3442 |
4092 |
1470 |
4008 |
5427 |
9228 |
8.0 |
-1.2 |
2.1 |
19.5 |
7.2 |
7.8 |
|
Assam |
900 |
1595 |
2225 |
1674 |
1655 |
3109 |
6087 |
10219 |
3.2 |
0.3 |
-2.8 |
19.2 |
12.7 |
7.5 |
|
Bihar |
2089 |
3166 |
3776 |
2804 |
1984 |
3055 |
5953 |
5738 |
1.3 |
-0.6 |
-2.9 |
7.0 |
4.9 |
-0.4 |
|
Gujarat |
1481 |
2184 |
3236 |
3852 |
2084 |
2729 |
4718 |
5678 |
5.9 |
4.2 |
2.1 |
6.4 |
6.0 |
2.3 |
|
Haryana |
2438 |
2645 |
5097 |
4941 |
1391 |
5362 |
7967 |
8836 |
3.8 |
4.8 |
-0.3 |
19.8 |
3.6 |
1.2 |
|
Himachal
Pradesh |
1719 |
2075 |
4705 |
5103 |
1862 |
2168 |
5223 |
7630 |
7.3 |
8.1 |
0.9 |
11.5 |
14.0 |
5.1 |
|
Jammu & Kashmir |
1163 |
2090 |
3015 |
2144 |
1148 |
2963 |
4195 |
3444 |
3.1 |
0.1 |
-3.2 |
7.4 |
0.9 |
-2.0 |
|
Karnataka |
1626 |
2458 |
3470 |
3713 |
2150 |
2947 |
4459 |
6307 |
4.8 |
2.8 |
0.8 |
7.2 |
6.3 |
4.6 |
|
Kerala |
796 |
1881 |
2249 |
5551 |
843 |
1581 |
3048 |
5137 |
22.1 |
10.8 |
16.3 |
18.9 |
12.5 |
7.6 |
|
Madhya Pradesh |
1205 |
1797 |
2706 |
3141 |
1041 |
2276 |
3760 |
6460 |
6.0 |
4.2 |
1.8 |
19.3 |
10.2 |
8.0 |
|
Maharashtra |
1628 |
2534 |
3436 |
5369 |
2682 |
3279 |
5365 |
8072 |
8.5 |
6.2 |
6.2 |
7.4 |
8.1 |
5.6 |
|
Odisha |
1353 |
1346 |
2460 |
2511 |
1282 |
3173 |
3545 |
5274 |
3.2 |
4.8 |
0.2 |
11.5 |
3.7 |
5.4 |
|
Punjab |
2524 |
4092 |
7158 |
7356 |
2795 |
4686 |
11354 |
8296 |
7.1 |
4.4 |
0.3 |
7.3 |
4.3 |
-3.0 |
|
Rajasthan |
1856 |
2492 |
4465 |
3417 |
1329 |
2583 |
4517 |
4575 |
3.1 |
2.1 |
-2.6 |
9.0 |
4.3 |
0.1 |
|
Tamil Nadu |
845 |
2330 |
3129 |
4802 |
1246 |
3227 |
6379 |
8467 |
17.3 |
5.9 |
5.9 |
21.5 |
9.0 |
3.6 |
|
Uttar Pradesh |
2266 |
3567 |
5211 |
4214 |
3266 |
4836 |
5285 |
8615 |
3.2 |
1.0 |
-2.1 |
6.1 |
4.3 |
7.0 |
|
West Bengal |
757 |
1605 |
2474 |
3070 |
1914 |
2639 |
4876 |
6824 |
11.3 |
5.1 |
2.7 |
9.5 |
8.8 |
4.4 |
|
All-India |
1605 |
2627 |
3408 |
3965 |
2227 |
3216 |
5272 |
7109 |
5.4 |
2.8 |
1.8 |
8.1 |
6.7 |
3.9 |
Table 8
|
Table 8 Cost of Treatment for
Outpatient Care, 1986-87 to 2014 (at 1993-94 prices) |
||||||||||||||
|
State |
Average Cost of Treatment (Rs) |
Annual Percentage Change |
||||||||||||
|
Rural Outpatient |
Urban Outpatient |
Rural Outpatient |
Urban Outpatient |
|||||||||||
|
1986- 87 |
1995- 96 |
2004 |
2014 |
1986- 87 |
1995- 96 |
2004 |
2014 |
1986- 2014 |
1995- 2014 |
2004- 2014 |
1986- 2014 |
1995- 2014 |
2004- 2014 |
|
|
Andhra Pradesh |
126 |
135 |
156 |
133 |
119 |
141 |
184 |
203 |
0.2 |
-0.1 |
-1.6 |
2.6 |
2.4 |
1.1 |
|
Assam |
158 |
124 |
184 |
120 |
23 |
148 |
239 |
547 |
-0.9 |
-0.2 |
-3.9 |
86.1 |
15.0 |
14.4 |
|
Bihar |
297 |
175 |
239 |
226 |
175 |
174 |
181 |
186 |
-0.9 |
1.6 |
-0.6 |
0.2 |
0.4 |
0.3 |
|
Gujarat |
154 |
129 |
181 |
154 |
175 |
179 |
240 |
146 |
0.0 |
1.1 |
-1.6 |
-0.6 |
-1.0 |
-4.3 |
|
Haryana |
136 |
155 |
240 |
182 |
134 |
340 |
140 |
299 |
1.3 |
1.0 |
-2.7 |
4.6 |
-0.7 |
12.6 |
|
Himachal Pradesh |
247 |
71 |
140 |
179 |
222 |
109 |
179 |
326 |
-1.0 |
8.4 |
3.1 |
1.7 |
11.1 |
9.2 |
|
Jammu & Kashmir |
192 |
154 |
179 |
255 |
154 |
122 |
245 |
265 |
1.2 |
3.6 |
4.7 |
2.6 |
6.5 |
0.9 |
|
Karnataka |
88 |
100 |
245 |
152 |
124 |
141 |
195 |
206 |
2.7 |
2.9 |
-4.2 |
2.4 |
2.6 |
0.6 |
|
Kerala |
115 |
112 |
195 |
156 |
96 |
98 |
110 |
190 |
1.3 |
2.2 |
-2.2 |
3.6 |
5.1 |
8.1 |
|
Madhya Pradesh |
141 |
127 |
110 |
217 |
220 |
308 |
190 |
241 |
2.0 |
3.9 |
10.9 |
0.3 |
-1.2 |
3.0 |
|
Maharashtra |
190 |
135 |
190 |
161 |
192 |
152 |
183 |
245 |
-0.6 |
1.0 |
-1.7 |
1.0 |
3.4 |
3.8 |
|
Odisha |
117 |
121 |
183 |
184 |
111 |
112 |
156 |
213 |
2.1 |
2.9 |
0.1 |
3.4 |
5.1 |
4.1 |
|
Punjab |
154 |
144 |
156 |
173 |
151 |
133 |
199 |
243 |
0.5 |
1.2 |
1.3 |
2.3 |
4.6 |
2.4 |
|
Rajasthan |
188 |
157 |
199 |
168 |
207 |
162 |
172 |
316 |
-0.4 |
0.4 |
-1.7 |
2.0 |
5.3 |
9.3 |
|
Tamil Nadu |
77 |
84 |
172 |
155 |
87 |
106 |
156 |
184 |
3.7 |
4.7 |
-1.1 |
4.2 |
4.1 |
2.0 |
|
Uttar Pradesh |
169 |
184 |
156 |
213 |
235 |
186 |
195 |
329 |
1.0 |
0.9 |
4.0 |
1.5 |
4.3 |
7.6 |
|
West Bengal |
98 |
107 |
195 |
150 |
164 |
112 |
182 |
180 |
2.0 |
2.2 |
-2.6 |
0.4 |
3.3 |
-0.1 |
|
All-India |
141 |
144 |
182 |
176 |
152 |
159 |
180 |
225 |
0.9 |
1.2 |
-0.4 |
1.8 |
2.3 |
2.8 |
4. Health Insurance and Financial Protection
India's
economy is expanding in the provision of health insurance coverage to its
people. Inpatient hospitalisation and certain medical care are covered by
health insurance companies in India. The Indian government has permitted
private companies in the insurance industry since 2000. However, according to the
National Health Policy 2015, 72% of all persons covered by insurance fall under
government sponsored schemes. Of these, 60% were covered by government/public
insurance companies with the remaining being covered by private insurance companies.
The
central government of India has implemented creative measures from the middle
of the 2000s to enhance public health care. Low-cost hospitalisation insurance
programmes were created by the public insurance companies as part of this
effort to address the healthcare requirements of the underprivileged section of
the society. These included the Rashtriya Swasthya Bima Yojana (RSBY) in 2008 and the Jan
Arogya Bima Policy in the middle of 2000. A number of
state governments, including Karnataka, Tamil Nadu, and Rajasthan, have
introduced a unique state-level medical insurance programme to shield their
citizens from the financial hazards brought on by catastrophic illnesses. Over time,
the RSBY scheme's coverage and benefits package were increased to include
informal sector workers in households that were above the poverty line
(Government of India, 2015). In terms of health insurance expenditure (HIE),
the private sector accounted for Rs. 17755.31 crores in 2014–15, while the
government-financed health insurance schemes (which include the RSBY and other state government sponsored programmes)
accounted for Rs. 4589.84 crores (Government of India, 2017a, p.28).
4.1. Health Insurance Subscription and Equity
A
question about the amount of health insurance premium paid by the household
during the last 365 days has been asked by the NSS since 1995-96 Round. It’s
analysis in terms of the percentage of households reporting subscription was
0.5% in 1995-96, 1.9% in 2004 and rose to 6.1% in 2014. The response to the
question on amount of annual premium paid was turned out to be data artefact
especially in the NSS 71st Round (2014) whilst the BPL households
under the RSBY got enrolled without paying any charges. As a result, the
predicted subscription rate proved to be inaccurate. However, during the NSS 71st round, a new
question on enrolment in privately or in government-funded health insurance
programmes, such as RSBY, was asked to every household member. From the
database, we computed a variable called "household health insurance
coverage" where at least one person had signed up for any government or
private health insurance plan (regardless of whether they had paid any annual
premium). Therefore, only information from the NSS 71st round was analysed here
to present facets of health insurance and financial protection received by
subscribers.
Table 9 lists the socioeconomic characteristics of households together with their health insurance coverage. A larger percentage of households who had health insurance cover were from higher Monthly Per Capita Expenditure (MPCE) group as well as from upper social strata and were residents in urban areas (see Table 9). As expected, its coverage was low among backward caste and Muslim households. The percentage of families registered in health insurance plans across MPCE quintiles varies significantly between states (see Table 10). This may show how different states are able to adopt health insurance plans specifically or other plans in general. In comparison to the All-India average, health insurance coverage was higher in only five states: Andhra Pradesh, Kerala, Odisha, Rajasthan, and Tamil Nadu. On the other hand, Assam, Bihar, Madhya Pradesh and Uttar Pradesh reported an extremely low coverage. Additionally, the differential in inter-quintile MPCE (between the top and bottom quintile) reveals enormous inter-state inequities in health insurance coverage. Interestingly those states reporting higher coverage have addressed equity issues well, i.e., the coverage was higher in bottom vs. top MPCE quintile households. The highly equitable states were Andhra Pradesh, Kerala, Odisha, and Rajasthan. On the other hand, the low coverage states particularly Haryana, Karnataka, Maharashtra and West Bengal were found to have reported. a highly inequitable coverage.
Table 9
|
Table 9 Percentage of
Households having at least one member Enrolled to Health Insurance (Coverage)
by Socio-Economic Status, 2014 |
|||
|
Socio-economic
groups |
%
Insurance Coverage |
||
|
Rural |
Urban |
All |
|
|
MPCE
quintile |
|||
|
1
(Bottom) |
13.10 |
9.26 |
12.68 |
|
2 |
14.28 |
12.13 |
13.91 |
|
3 |
18.53 |
15.7 |
17.83 |
|
4 |
22.22 |
19.55 |
21.19 |
|
5
(Top) |
24.55 |
29.53 |
28.21 |
|
Social
group |
|||
|
SC
& ST |
18.20 |
18.13 |
18.19 |
|
OBCs |
17.75 |
21.86 |
19.06 |
|
Other |
13.96 |
23.29 |
18.29 |
|
Religion |
|||
|
Hindu |
17.86 |
22.36 |
19.27 |
|
Muslim |
11.27 |
15.38 |
12.82 |
|
Other |
16.57 |
30.99 |
21.93 |
|
All |
17.03 |
21.84 |
18.60 |
Table 10
|
Table 10
Percentage of Households with Health Insurance Coverage by Major States, 2014 |
|||||||||
|
Major States |
Rural |
Urban |
All |
MPCE Quintile |
|||||
|
Bottom |
2nd |
3rd |
4th |
Top |
Ratio (Top/ Bottom) |
||||
|
Andhra
Pradesh |
72.93 |
50.42 |
65.74 |
54.08 |
68.39 |
72.80 |
72.15 |
49.20 |
0.91 |
|
Assam |
2.26 |
12.99 |
3.70 |
2.64 |
2.25 |
1.39 |
8.55 |
9.20 |
3.49 |
|
Bihar* |
7.15 |
5.41 |
6.97 |
8.86 |
6.95 |
4.60 |
4.51 |
4.71 |
0.53 |
|
Gujarat |
13.77 |
18.83 |
15.98 |
15.06 |
11.47 |
10.47 |
13.47 |
25.42 |
1.69 |
|
Haryana |
3.00 |
19.75 |
8.88 |
0.03 |
1.92 |
5.17 |
8.19 |
21.70 |
684.84 |
|
Himachal
Pradesh |
13.13 |
16.58 |
13.57 |
7.23 |
7.92 |
8.33 |
15.12 |
23.26 |
3.22 |
|
Jammu
& Kashmir |
9.04 |
18.24 |
11.11 |
7.57 |
14.44 |
7.93 |
4.24 |
20.67 |
2.73 |
|
Karnataka |
9.92 |
20.26 |
14.16 |
6.23 |
6.57 |
8.49 |
14.74 |
34.17 |
5.49 |
|
Kerala |
51.15 |
42.54 |
47.22 |
79.18 |
58.56 |
51.75 |
49.23 |
41.97 |
0.53 |
|
Madhya
Pradesh* |
0.44 |
8.68 |
2.61 |
0.69 |
0.19 |
2.52 |
4.72 |
13.42 |
19.41 |
|
Maharashtra |
3.39 |
17.39 |
9.87 |
0.84 |
2.84 |
1.81 |
5.31 |
24.75 |
29.41 |
|
Odisha |
23.70 |
13.99 |
21.92 |
30.10 |
16.32 |
11.10 |
10.53 |
19.05 |
0.63 |
|
Punjab |
4.30 |
11.33 |
7.07 |
0.23 |
5.11 |
3.75 |
4.58 |
11.31 |
49.69 |
|
Rajasthan |
24.39 |
29.38 |
25.75 |
39.93 |
21.36 |
18.75 |
18.56 |
34.68 |
0.87 |
|
Tamil
Nadu |
19.34 |
26.29 |
22.87 |
6.19 |
14.52 |
19.52 |
22.65 |
32.20 |
5.20 |
|
Uttar
Pradesh* |
4.90 |
8.87 |
5.86 |
4.93 |
6.42 |
3.04 |
3.16 |
16.34 |
3.31 |
|
West
Bengal |
16.46 |
23.01 |
18.54 |
13.87 |
18.13 |
18.73 |
13.08 |
32.71 |
2.36 |
|
All |
17.03 |
21.84 |
18.60 |
12.68 |
13.91 |
17.83 |
21.19 |
28.21 |
2.22 |
|
Note: * As there is no inter-state comparisons with
previous NSS Rounds, we have not added in this table Chhattisgarh with Madhya
Pradesh, Uttarakhand with Uttar Pradesh and
Jharkhand with Bihar. |
|||||||||
4.2. Extent of Financial Protection Received for Hospitalisation
According
to Sundarraman and Muraleedharan
(2015), expanding health insurance
coverage has not proven to be effective at delivering financial security. To
verify this claim, we calculated the difference in median hospitalisation costs
between households with and without health insurance (Figure 2). Surprisingly, at the national
level, those with insurance reported greater hospitalisation costs than
households without insurance (Rs. 17261 vs. Rs. 15773), and this difference was
significantly larger for households living in urban areas. Only rural households had a small amount of
relief (Rs. 12908 vs. Rs. 13396), translating to 3.8% reduced costs for the
insured. This demonstrates unequivocally that health insurance has offered only
minimal financial protection against the grand claims.
Figure 2
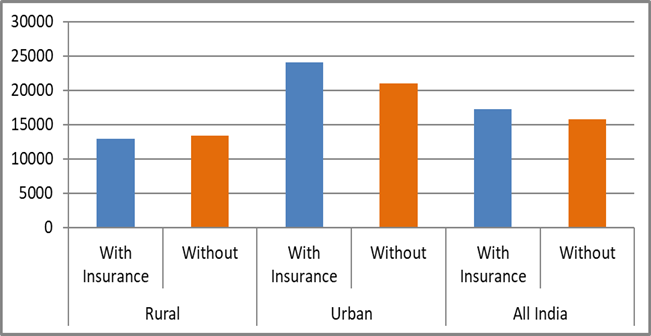
|
Figure
2 Hospitalisation Cost (In Rs.) for Households with and
without Health Insurance Coverage, 2014 |
Regardless
matter whether a household has insurance or not, there are significant
interstate differences in hospitalisation costs between households in rural and
urban locations. We have therefore presented the findings in terms of cost
ratios in Table 11 in order to
draw useful conclusions. The extremely high negative cost ratios (between -48
and -58%) in Haryana, Maharashtra, Himachal Pradesh, and Assam show that
insured households ultimately spend nearly twice as much for hospitalisation as
their non-insured counterparts.
Additionally, a number of other states also recorded
negative cost ratios. This clearly illustrates the broad prevalence of moral hazard
and insurance collusion in India, with the exception of
Kerala (where insured households have only paid half the cost of the
uninsured).
In
conclusion, just a few states—Andhra Pradesh, Kerala, and Rajasthan—have
targeted health insurance coverage, which aims to offer adequate financial
protection against catastrophic medical bills. The provision of efficient
health insurance coverage remains a significant task and a far-off dream for the majority of states (including economically progressive
ones). Further investigation on the scope of health insurance protection
revealed that rural Indian households have not received any financial
assistance from insurance, save for a small amount. The presence of moral
hazard and insurance collusions in urban India, particularly in economically
developed regions like Punjab, Haryana, Gujarat, and Maharashtra, appears to be
clearly evident which requires additional data
exploratory study.
Table 11
|
Table 11 Mean
Hospitalisation Expenses for Households with and without Health Insurance
Coverage by Major States, 2014 |
|||||||||
|
Major States |
With Insurance Coverage |
Without Insurance Coverage |
Ratio of costs between Without and with insurance (%) |
||||||
|
Rural |
Urban |
All |
Rural |
Urban |
All |
Rural |
Urban |
All |
|
|
Andhra
Pradesh |
13866 |
14343 |
13993 |
13481 |
21727 |
16089 |
-2.78 |
51.48 |
14.98 |
|
Assam |
6818 |
45886 |
20760 |
6335 |
37152 |
10794 |
-7.08 |
-19.03 |
-48.01 |
|
Bihar* |
14109 |
23520 |
14665 |
10076 |
19192 |
11038 |
-28.58 |
-18.4 |
-24.73 |
|
Gujarat |
14922 |
34620 |
24915 |
11570 |
15558 |
13234 |
-22.46 |
-55.06 |
-46.88 |
|
Haryana |
25736 |
45565 |
43764 |
17035 |
21342 |
18363 |
-33.81 |
-53.16 |
-58.04 |
|
Himachal
Pradesh |
31024 |
29105 |
30855 |
15540 |
15557 |
15541 |
-49.91 |
-46.55 |
-49.63 |
|
Jammu
& Kashmir |
5704 |
16151 |
9151 |
9420 |
12863 |
10060 |
65.15 |
-20.36 |
9.93 |
|
Karnataka |
15751 |
25826 |
21234 |
12502 |
18826 |
14641 |
-20.63 |
-27.1 |
-31.05 |
|
Kerala |
9758 |
13336 |
11128 |
25096 |
18479 |
22301 |
157.18 |
38.56 |
100.4 |
|
Madhya
Pradesh* |
11658 |
22181 |
18205 |
10382 |
19877 |
13061 |
-10.95 |
-10.39 |
-28.26 |
|
Maharashtra |
28537 |
43195 |
40058 |
18233 |
23095 |
20021 |
-36.11 |
-46.53 |
-50.02 |
|
Odisha |
8912 |
21013 |
10418 |
10820 |
18797 |
12391 |
21.41 |
-10.55 |
18.94 |
|
Punjab |
18359 |
49084 |
32547 |
22363 |
24775 |
23199 |
21.81 |
-49.53 |
-28.72 |
|
Rajasthan |
8938 |
16923 |
11543 |
10659 |
12339 |
11063 |
19.25 |
-27.09 |
-4.16 |
|
Tamil
Nadu |
20297 |
24754 |
22848 |
12075 |
24151 |
17933 |
-40.51 |
-2.44 |
-21.51 |
|
Uttar
Pradesh* |
14465 |
19347 |
17298 |
14371 |
26114 |
17247 |
-0.65 |
34.98 |
-0.29 |
|
West
Bengal |
9029 |
29907 |
16457 |
9887 |
20524 |
13068 |
9.5 |
-31.37 |
-20.59 |
|
All |
12908 |
24070 |
17261 |
13396 |
21019 |
15773 |
3.78 |
-12.68 |
-8.62 |
|
Note: * same as Table 10. Highlighted states have reported a
higher than the All-India average of health insurance coverage as shown in Table 10. |
|||||||||
The WHO
evolved the concept of Universal Health Coverage (UHC) in order to reduce
healthcare seeking barriers and achieve global health improvement especially
across Low and Middle Income Countries (LMICs). This paper
is primarily focused on understanding the progress made by various Indian
states in terms of providing healthcare access, the quality of health services,
and reducing the financial hardship faced by their rural and urban residents in order to achieve the UHC goal that "all people and
communities receive the quality health services they need without financial
hardship." Here, we have examined data from four NSS Rounds (1986–87
through 2014) on morbidity and health care use for 17 major states by rural and
urban areas, focusing on (a) trends in people's health seeking behaviour, (b)
reasons for not accessing health care, (b) reliance on government and private
health providers, (d) cost and burden of treatment, and (e) health insurance
coverage and financial protection for the poor.
Overall,
we can say that India's healthcare demands during 1986-87 were largely met by
public health providers. But it is losing importance. Despite some state
governments' attempts to reinstate the public delivery of healthcare by 2004,
the gap appears to have grown by 2014. In 2014, just 50% of rural populations
and approximately 35% of urban residents could rely on public health services.
While the majority of men and women sought treatment
for their illnesses, we notice that the percentage of people who reported not
having access to a medical facility is higher for rural than for urban
populations, indicating that most private health providers tend to focus on
urban areas and that public health care must fill this gap. In
addition, fewer persons reported having illnesses that did not require
treatment during the course of the surveys, which
suggests that both rural and urban residents are more likely to seek medical
attention. Additionally, the rise of government hospital beds over the past ten
years, especially in rural areas, has significantly improved the way people
seek out medical care. A improved public health
programme would greatly reduce the number of lost workdays due to illness as
the country's morbidity rate rises over time. This would boost options for
income and livelihood and lessen the vulnerability of both the poor and those
living in rural areas.
In order to
address the rising need for healthcare, the government has also pushed private
healthcare providers over the years, particularly in the post-liberalization
phase. Without a doubt, reliance on public providers for outpatient treatment
has decreased as a result of the significant increase
of private providers throughout the 2000s. However, due to cost factors, they
did not generally succeed in lowering reliance on public providers for
inpatient care. When compared to public providers, the cost of private hospital
care has remained consistently higher across the nation. Although the
difference in treatment costs between public and private providers is gradually
closing, the cost of care in public health facilities is still rising. This may be
partially attributed to the fact that the private sector is reluctant to
provide care for critically ill patients.
The
improvement in the use of public healthcare facilities for inpatient care,
particularly by rural populations in various states, is directly related to the
growth of public healthcare infrastructure over the past ten years. The
National Rural Health Mission (NRHM) finance programmes are responsible for
some of these health infrastructure upgrades. However, we notice a sharp
decline in the number of patients receiving free beds and medications, which
requires attention. If state governments closely adhere to an essential drug list
and buy generic medications through a pooled procurement scheme, their limited
finances can be used effectively. The central government’s two recent initiatives to require only
generic names on prescriptions and to establish a janaushadhi
store in every district hospital could lower patients’ out-of-pocket costs
significantly.
Due to
the type of health insurance questions included in the questionnaire, including
the responses for the clubbed categories of various government health
protection schemes like RSBY, the analysis regarding health insurance coverage
and financial protection over various NSS rounds was restricted. Despite this,
NSS 71st round (2014) data analysis shows that targeted health insurance
coverage to give efficient financial protection to the underprivileged and
subsequently to pay catastrophic healthcare bills has remained limited to
certain states. 'Pro-poor health insurance coverage' states include Andhra
Pradesh, Kerala, and Rajasthan; on the other end of the spectrum, Madhya
Pradesh, Assam, Punjab, and Uttar Pradesh had a dismal scenario (i.e.,
enrolment in favour of the better-off class). Thus, providing and implementing
efficient health insurance coverage to the poor and vulnerable population
remains an enormous challenge for the majority of
states, including the economically successful states of Punjab, Haryana,
Maharashtra, and Gujarat, and presents a significant hurdle to achieving the
UHC target.
Making a decision about the sort of health insurance has challenges as well. It has been
found that the effect of health insurance on reducing financial risk varies
depending on the environment and the type of insurance. Aarogyasri
scheme in Andhra Pradesh was found to have a significant impact over lowering
OOP inpatient expenditures Fan et al. (2012), whereas RSBY has failed to protect
insured households from the burden of healthcare costs in most states (a
limited penetration of the scheme for poor and rural people was found in Karnataka
Rajasekhar et al. (2011) and Maharashtra Ghosh (2014). Once more, a few Community Based Health Insurance Schemes were discovered to
be successful at attracting funding to meet healthcare needs Jakab and Krishnan (2001). In addition, there is a need to reduce
supplier-induced demand for healthcare lest the poor lose out on the benefits
of health insurance, as study reveals that moral hazard is common in an effort to overcharge households with health insurance
for healthcare expenditures.
The
success of the recently implemented Ayushman Bharat or National Health
Protection Scheme needs to be discussed in light of
the aforementioned analysis. While this programme focuses on covering secondary
and tertiary hospitalisation costs up to Rs. 500 000 per year per household, it
is recommended that government spending on preventive and promotion health care
be enhanced to lower the likelihood of hospitalisations. In
order to prevent and manage non-communicable diseases, public investment
should be focused on behavioural lifestyle factors due to the rising incidence
of non-communicable diseases and associated co-morbidity rates.
Another
issue related to this national health protection scheme is in
regard to effective implementation by the state governments which
already have their own health insurance schemes. The biggest obstacle is
enhancing the hospital's physical infrastructure and personnel resources to
enable improved access for patients, especially those living in remote areas. A
quicker and consistent implementation of the Clinical Establishment Act 2010
(CEA) across all states will guarantee that all hospital services are priced in
accordance with the guidelines established by the government because health
providers will be paid for their services. Additionally, it would guarantee
that the same standards and quality are upheld throughout all hospitals, both
public and private. These measures would make it easier to apply
policies uniformly and compensate employees in accordance with established
criteria. Only by successfully implementing the CEA will the price differential
between public and private health providers be narrowed. To accomplish the Sustainable
Development Goal-3, which is to "ensure healthy lives and promote
wellbeing for all at all ages," it is important to note that while the
plan will cover post-illness episodes, focused resources will also need to be
spent on primary and preventive health care.
CONFLICT OF INTERESTS
None.
ACKNOWLEDGMENTS
None.
REFERENCES
Balarajan, Y., Selvaraj, S., & Subramanian, S. V. (2011). Health Care and Equity in India, Lancet, 377(9764), 505–515. https://doi.org/10.1016/S0140-6736(10)61894-6
Berman,
P., Ahuja, R., & Bhandari, L. (2010). The Impoverishing Effect of
Health Care Payments in India: New Methodologies and Findings, Economic and Political
Weekly, 45(16), 65–71. https://www.jstor.org/stable/25664359
Bhat,
R., & Jain, N. (2006). Analysis of Public Private Healthcare Expenditures, Economic and Political Weekly,
41(1), 57–68.
Deolalikar, A. B., Jamison, D. T., Jha, P., & Laxminarayan, R. (2008). Financing health improvements in India, Health Affairs, 27(4), 978–990. https://doi.org/10.1377/hlthaff.27.4.978
Fan, V. Y., Karan, A., & Mahal, A. (2012). State Health Insurance and Out-Of-Pocket Health Expenditures in Andhra Pradesh, India, International Journal of Health Care Finance and Economics, 12(3), 189–215. https://doi.org/10.1007/s10754-012-9110-5
Government of India. (1989). National Sample Survey Organisation: Consumer Expenditure for All India, 42nd Round, Report no. 355/2, Department of Statistics.
Government of India. (1998). National Sample Survey Organisation: Morbidity and Treatment of Ailments, 52nd Round, Report no. 441, Department of Statistics.
Government of India. (2005). Ministry of Health and Family Welfare (MOHFW), Report of the National commission on macroeconomics and health, 2005, MOHFW.
Government of India. (2006). National Sample Survey Organisation: Social Consumption Healthcare and Condition of the Aged, 60th Round, Report no. 507, Ministry of Statistics and Programme Implementation.
Government of India. (2016). National Sample Survey Organisation: Health in India, NSS 71st Round (January–June 2014), Report no. 574, 71/25(0), Ministry of Statistics and Programme Implementation.
Government of India. (2022). National health accounts estimates for India 2018–19, Ministry of Health and Family Welfare.
Government of India. (2018). Directorate General of Health Services (DGHS), Ministry of Health and Family Welfare (MOHFW) National Health Profile 2018, Central Bureau of Health Intelligence, DGHS, MOHFW.
Ghosh,
S. (2014). Publicly Financed
Health Insurance for the
Poor Understanding RSBY in Maharashtra, Economic and Political Weakly, 46(20), 56–63.
Gumber, A. (1997). Burden of Disease and Cost of Ill Health in India: Setting Priorities for Health Interventions During The Ninth Plan, Margin, 29(2), 133–172.
Gumber, A. (2000).
Health Care Burden on Households in the Informal Sector: Implications for
Social Security Assistance, Indian Journal of Labour Economics, 43(2), April-June, 277–291.
Gumber, A. (2002).
Economic Reforms and the Health Sector: Towards Health
Equity in India. In Institute of Applied
Manpower Research, Reform and Employment,
Concept Publishing House, 235–284.
Gumber, A. (2021). Equity in Healthcare
Utilisation and Cost of Treatment in Western India, Journal of Social and
Economic Development, 23(S1), 131–152.
https://doi.org/10.1007/s40847-020-00121-1
Gumber, A., Lalitha, N., & Dhak,
B. (2017). Rising Healthcare Costs and
Universal Health Coverage
in India: An Analysis of
National Sample Surveys,
1986–2014, GIDR Working Paper no. 246. Gujarat
Institute of Development Research.
Hooda, S. K. (2015). Private Sector in Healthcare Delivery market in India: Structure, Growth and Implications. ISID Working Paper 185. New Delhi: Institute for Studies in Industrial Development.
Jakab, M.,
& Krishnan, C. (2001). Community Involvement
in Health Care: A Survey of
the Literature on the Impact, Strengths
and Weaknesses. Report Submitted
to Working Group 3 of the Commission on Macroeconomics and Health,
Jeffrey D. Sachs (Chairman), World Health Organization.
Lalitha, N. (2009). Access to Medicines in Public Health Care: Lessons from Tamil Nadu. In G. Kumar (Ed.), Health Sector Reforms in India, New Delhi: Manohar Publishers and Centre De Sciences Humaines, 87–113.
Rajasekhar, D., Berg, E., Ghatak,
M., Manjula, R., & Roy, S. (2011). Implementing
Health Insurance: The Roll Out of Rashtriya Swasthya Bima Yojana
in Karnataka. Economic and Political
Weakly, 46(20), 56–63.
Selvaraj, S., & Karan, A. (2009). Deepening Health Insecurity in India: Evidence from National Sample Surveys Since 1980s. Economic and Political Weekly, 44(40), 55–60.
Sen,
G., Iyer, A., & George, A. (2002). Structural Reforms
and Health Equity: A Comparison of NSS Surveys 1986–87 and 1995–96. Economic
and Political Weekly, 37(14), 1342–1352.
Sen, G. (2003). Inequalities and Health in India. Development, 46(2), 18–20. https://doi.org/10.1057/palgrave.development.1110438
Shariff, A., & Mondal, S. K. (2009). User Fee in Public Health Care Institutions. In G. Mondal (Ed.), Health Sector Reforms in India, New Delhi: Manohar Publishers and Centre De Sciences Humaines, 147–168.
Sundarraman, T., & Muraleedharan, V. R. (2015). Falling Sick, Paying the Price NSS 71st Round on Morbidity and Costs of Healthcare, Economic and Political Weekly, Vol L (33), August, 17–20.
Van Doorslaer, E., O’Donnell, O., Rannan-Eliya, R. P., Somanathan, A., Adhikari, S. R., Garg, C. C., Harbianto, D., Herrin, A. N., Huq, M. N., Ibragimova, S., Karan, A., Ng, C. W., Pande, B. R., Racelis, R., Tao, S., Tin, K., Tisayaticom, K., Trisnantoro, L., Vasavid, C., & Zhao, Y. (2006). Effect of Payments for Health Care on Poverty Estimates in 11 Countries in Asia: An Analysis of Household Survey Data. Lancet, 368(9544), 1357–1364. https://doi.org/10.1016/S0140-6736(06)69560-3
World, B. (2001). India-Raising the Sights: Better Health Systems for India’s Poor, World Bank.
|
|
 This work is licensed under a: Creative Commons Attribution 4.0 International License
© IJETMR 2014-2023. All Rights Reserved.