
|
|
|
|
On-Grid Performance and Economic Analysis of a Solar Energy Plant for King Abulaziz Airport Loads
Ali H. Algarni 1![]() , Mohamed H. Mohamed 2
, Mohamed H. Mohamed 2
1 Mechanical Engineering Department College of Engineering and Islamic Architecture, Umm Al-Qura University, Makkah, Saudi Arabia
2 Mechanical Power Engineering Department, Faculaty of Engineering
EL-Mattaria, Helwan University, P.O. Box: 11718, Cairo, Egypt
|
|
|
ABSTRACT |
|
|
According to Saudi Arabia vision of 2030, the Kingdom of Saudi
Arabia is undergoing through various stages and working on projects to make
their airports environment friendly and pollution free. For this, they are working to install solar panels and make electricity
to meet up their requirements. In the Kingdom of Saudi Arabia, all the
airports will be transformed in environmentally friendly airports. We are
working on the project to install a solar PV system in Jeddah International
airport. It is taken the values for electricity consumption of the airport
and designed two different systems: On-Grid and OFF-Grid and implement them
with the desired requirements. Using PVsyst software, the On-grid design has
been simulated as well as the economic analysis has been calculated. The
results indicated that
cost analysis shows that energy produced will
cost 0.073USD/kWh. Detailed economic analysis of ON-Grid system is introduced
and get On-grid design system of PV more beneficial. This system provides our
investment back within 4.3 years and its environment friendly obvious. |
|||
|
Received 15 April 2022 Accepted 19 May 2022 Published 16 June 2022 Corresponding Author Ali H.
Algarni, DOI 10.29121/ijetmr.v9.i5.2022.1168 Funding: This research
received no specific grant from any funding agency in the public, commercial,
or not-for-profit sectors. Copyright: © 2022 The
Author(s). This work is licensed under a Creative Commons
Attribution 4.0 International License. With the
license CC-BY, authors retain the copyright, allowing anyone to download, reuse,
re-print, modify, distribute, and/or copy their contribution. The work must
be properly attributed to its author.
|
|||
|
Keywords: PV, Power
Electronics, On-Grid, Inverter, Battery Charger, Back-up Generator, PVsyst ABBREVIATIONS AC-
Alternating Current AHP-
Analytics Hierarchy BIPV-
Building Integrated Photovoltaic CAPEX-
Capital Expenditure DC-
Direct Current EWSN-
Embedded Wireless Systems and Network GIS-
Geographic Information System GMDH-
Group Method of Data Handling ORC-
Organic Rankine Cycle PLT- Pembangkit Listrik Tenaga Surya PPA-
Power Purchase Agreement PV-
Photo Voltaic SSI-
Satellite Services Inc STC-
Standard Test Condition |
|||


1. INTRODUCTION
Due to rising population and technological improvements, the global requirement for energy is increasing rapidly. For future energy needs, it is critical to choose a renewable energy source that is stable, cost-effective, and long-lasting. Solar energy is a renewable energy which is tremendously auspicious and willingly accessible energy source that has potential to solve long-term issues related to current energy crisis. Because fossil fuel supplies are finite and alternative energy sources are prohibitively costly, the solar sector is constantly growing throughout the globe due to which the demand for electricity is rising. Because of its superior availability, cost-effectiveness, accessibility, capacity, and efficiency, the solar sector is the greatest alternative for future energy needs. There are many reasons why solar energy is needed, including its core ideas, the current state of the world's power supply and its prospective uses, as well as the challenges that need to be overcome for a better solar industry in order to alleviate the current global energy crisis. Hepbasli and Sangeetha (2014)
As a finite and depletable resource, relying on non-renewable energy sources will leave us short on energy for the sake of future generations, it is imperative that we utilize renewable sources of energy, for instance, PV solar power or wind. These renewable energy sources are environment friendly and are vital in this regard since they do not harm the environment. However, there are various reasons why energy from the sun is the greatest alternative in upcoming future globally: First, energy from the sun is the most plentiful source of a renewable energy. The sun releases 3.8×10²³ kW of solar energy each day, of which the earth receives around 1.8*1014 kW. Heat and light are two examples of the many ways in which solar energy reaches the Earth. The bulk of this energy is lost as it passes through the atmosphere due to dispersion, reflection, and absorption. Solar energy has been shown in studies to be a reliable and cost-effective way to meet the world's growing need for electricity. It's a potential energy resource since it's never going to run out and the efficiency of its production is considered to be the best one. We determine the efficiency of a PV solar system by the scattering and strength of the sun radiations Franklin (2019)
In the whole world including Saudi Arabia, the renewable sources of energy are extensively regarded to be the essential energy source for the upcoming era. Solar energy is considered to be clean, abundant, and renewable in Saudi Arabia. The Arabian Peninsula receives an average of 2200 kWh/m2 of yearly solar radiation. Since 1960, the usage of solar energy has increased in Saudi Arabia. The Solar Village in Riyadh, Saudi Arabia, has a 350-kW solar hydrogen generating facility, which at the time of its construction was the world's first of its kind. However, despite the fact that the use of solar energy in all its forms is very desirable for the nation, its growth has been rather slow owing to a number of hurdles Franklin (2019)
2. LITERATURE REVIEW
Saudi Arabia is abundant in solar energy, which is a sustainable source of energy that is also free to use. The Energy Research Institute, King Abdulaziz City for Science and Technology, discusses its primary research, development, and demonstration efforts and accomplishments in the area of solar energy in a publication. The Kingdom's RD&D has established that solar energy has a wide range of applications. Illumination, cooking, cooling, heating, drying, desalination of water, meteorological stations, controlling irrigation pumps and supplying road and tunnel lighting are among the many services provided by these facilities. Solar energy R&D initiatives and accomplishments have also had a major impact on the Kingdom's technological and human capital development Alawaji and Hasnain (2010)
For sustainable growth in the Kingdom, solar power is an interesting solution because of the Kingdom's existing and future energy situation. By maximizing the integration of photovoltaic (PV) technology into buildings, the research examines the possibility for solar energy to be implemented in the Saudi residential sector. Through a variety of case studies, a variety of BIPV placement strategies were put forward and tested. In order to provide a baseline for the neighborhood-tested scenarios, each instance was parametrically evaluated on its own in the field to determine its maximal energy potential. Measures of energy output and consumption were used to assess the effect Farahat et al. (2021)
A significant portion of Kingdom's future energy needs will be met by increasing the output of solar electricity. The monarchy is now undertaking many installation and research projects in an effort to meet its 2020 solar power capacity objectives. As a result, the most recent information on the country's solar business is critical for future study and development in this area. This report examines Saudi Arabia's existing and future prospects in the solar sector Farahat et al. (2021)
Site-suitability evaluation of solar power plants for cultural and ecological conservation zones has been suggested using a trustworthy technique. It presented a novel Analytic Hierarchy Process based approach for such Multi- Decision Criteria Analysis of the SSI satellite obtained data as well as local sources of information, this within a GIS platform tailored to meet the needs of energy stakeholder in Southeast Asia, while ensuring the preservation of legally protected places. Solar plants have been deployed in three approximation methods depending on their closeness to the current grid in order to solve these issues using a GIS spatial weighted overlay assessment for criterion layers such as climate, terrain, electrical grid, and road infrastructure Ruiz et al. (2020)
In Petrollese et al. (2018) It is focused on hybrid power generating system based on Concentrating Solar Electricity and PV plants, with the goal of delivering completely dispatchable power using solely solar energy. CSP-PV consists of two thermal energy storage (TES) tanks and an Organic Rankine Cycle power plant. A thermal oil is used as heat transfer fluid and an electrochemical storage bank is connected to the PV array in this portion.
When designing a hybrid concentrated solar and photovoltaic power plant, the ideal design parameters for the CSP section included the size of a photovoltaic solar field, and nominal power of an ORC as well as of the PV array and a battery capacity for the PV sections. There was a strong correlation between cost-effectiveness of hybridization of CSP and PV technology, regardless of location, availability of solar energy and the unmet load percentage have a significant impact on hybrid plant design Al-Zahrani et al. (2017)
To generate electricity from solar power, a prototype solar tower system was developed and constructed. During daytime hours, heliostats are used to collect the sun's rays. A total of 10 heliostats were selected to direct solar energy to the solar receiver using the selection technique outlined in this article. Elevation and rotation of heliostats were controlled by a dual motor system. A molten salt solution served as the thermal fluid (which consists of 60 percent NaNO3 and 40 percent KNO3). The molten salt heats the heat exchanger water to a temperature of 11.26 kW, which was then transmitted to the water. Molten salt's thermal power was also measured, and it turned out to be 12.31 kW. There was a 13-kW thermal design power. The thermal power obtained has a 5.3 percent margin of error Al-Zahrani et al. (2017)
Dish Stirling Systems, Parabolic Trough Collectors (PTC), and Central Receiver Systems are among of the CSP technologies described in this study. Thermal energy from the Sun is concentrated using mirrors to generate electricity. These CSP technologies including the use of low iron glass in various forms and compositions were discussed in this study Roni et al. (2019)
There are several elements that affect the utility of sunlight and selecting the right location for a solar power plant is critical to maximizing its potential. AHP and GMDH were employed in this research to find potential locations for solar power projects. The study's goal was to create an indicator that would show the viability of solar energy plants in potential installation areas. Solar energy usage factors were also sought to be prioritized Majumder and Saha (2016)
A further investigation focused on the thermal properties of a tube solar collector for heating water. Temperature sensor readings were recorded to help narrow down the plant's technical and operational parameters. Chromel-copel thermocouples were used to represent the temperature sensors, and temperatures were measured at six different locations around the factory using these devices. A self-recording device was used to record the thermocouple readings. The research indicated that the combined use of solar and electrical energy provides water heating regardless of season or weather conditions owing to unique thermal performance, circulation of solar energy plants, and water heating dynamics Almasri and Almarshoud (2017) This paper presents a framework for the development of remote monitoring and automated evaluation systems for solar energy installations that does not need the use of additional hardware. It is recommended to use a hierarchical model of plant components to separate software functionality into many levels.
The cost of a power plant is a critical factor in energy generation. Financial analysis methodologies were used to examine a sample of an investment in this article. Methods like net value and rate of return fall under this category. Actual data have been used to develop the thesis' parameters and feasibility study of the proposed solar power facility. It was meant to serve as a point of reference from the standpoint of the author Özcan et al. (2018)
Utility-scale solar power projects need a minimum of 5 megawatts (MW) of solar power generation capacity, which is covered in this handbook. In this solar sector category, the vast majority of lessons learnt are based on data from established markets. This paper, on the other hand, attempts to anticipate and solve the issues of projects in developing countries. It does this by addressing optimal power plant design, project execution, and commercial and financial considerations in the manual IFC (2015)
Using the PVSYST software and AutoCAD, a convectional design approach for large-scale on-grid solar PV was developed. PVsyst software was used for the simulation of 50MW grid connected Photovoltaic system and AutoCAD was used to design the architecture of the plant and the substation to transfer it to the 132Kv Busbar. Databases for different renewable energy system components from different manufacturers were the first step in the project's development. In this study, a 50MW grid-connected solar PV was designed using a standard technique proposed in this paper. This document provides all of the schematics and single-line diagrams needed to construct a 50MW grid-connected solar power facility Hindocha and Shah (2020)
With the use of the PVSYST software, research was done to provide a standard approach for designing large-scale (5MW) grid-connected solar PV systems as a result of this, we were able to predict how well the 5MW grid-connected solar PV system will perform throughout its entire expected lifespan. A 5MW grid-connected solar PV system built at Shivanasamudram, Mandya, proved the validity of the standard technique. According to the simulation, establishing a 5 MW solar plant saves 25615 Kg of coal each day at the generation site, resulting in an annual PR of 84.4%. There are 246,000 teak trees that will be planted as a result of this project Hindocha and Shah (2020)
Large-scale grid-connected solar PV systems utilizing the rooftops of buildings and parking garages were the focus of this research. Natural Resources Canada's Clean Energy Project Analysis programmed was used to predict the efficiency of the 1MW grid connected solar Pv during its lifetime Apribowo et al. (2021)
There are two main goals in this proposed procedure: a low levelized cost of energy (LCOE) and a high annual energy output. Its number of series and in parallel Photovoltaic panels, the number of lines in each row, the angle and orientation of each PV module, inter-row space, and type of PV module are all design variables. The sensitivity analysis found that the PV plant performance can be enhanced by lowering the PV module yearly decline coefficient Apribowo et al. (2021)
There is a new trend of installation of small to medium size PV system particularly in Indonesia's campus setting. The 15kW PLTS may assist and prove the implementation of green campus program. The availability of 15kW PLTS has drawn attention to the need for more in-depth study so that the electrical energy, the simulated output was compared to the actual output of this 15 kW PLTS, the 5-kW line's optimal production value is 5264.8 kWh with a PR of 83.1%, while the 10-kW line's optimal production value is 7687.2 kWh with a PR of 83.12%. There is a 74.79 percent difference in real output between the 5kW and 10kW lines, and a 78.62 percent difference between the 5kW and 10kW lines Apribowo et al. (2021)
In Dominio (2015) it has been proposed and developed the concept of a hybrid CSP and PV power plant to overcome this disadvantage in PV production. A hybrid CSP/PV system is provided in an attempt to discover a link between the capacity configuration cost of solar energy and the cost of solar energy. Studies of hybrid CSP/PV systems and comparisons with standalone CSP systems have revealed that hybrid CSP/PV systems have distinct properties based on their capacity configurations. The findings demonstrate that the suggested technique offers a practical and straightforward process pattern that is conducive to engineering use and expansion.
A PV plant (PV), CSP plant, and hybrid PV/CPS (CPS) plant design parameters are orientation, solar multiplier, thermal energy storage capacity, and fraction of hybridization. In addition to showing that the optimal orientation angles and TES have an impact on PV and CSP plant performance in terms of annual energy production, cost savings, and dispatchability for supplying base load, A well- presented examination of a solar facility in Ouarzazate, Morocco, using a model simulation is shown Dieckmann and Dersch (2017)
For this research, key design elements including orientation angle, solar multiple, thermal storage size, and proportion of hybridization are analysed in terms of cost and energy output. The orientation angle of PV panels has huge impact on levelled cost of ownership and yearly energy output. The annual cost-to-energy ratio is best served by selecting a TES interval rather than a specific value of solar multiple. The lower the LCOE, the lower the annual energy output for the same installed capacity, but the higher the CSP share, the higher the annual energy output Roni et al. (2019)
The International Energy Agency's (2014) Solar Thermal Energy Technology Roadmap includes a PV-CSP hybrid system as one of 10 phases and milestones for the advancement of CSP technology. As a result, the PV-CSP hybrid system has gained widespread interest across the globe, and a number of commercialized hybrid plants, including those in Chile and South Africa, are now in the development or construction stages. This document is being written in order to provide a synopsis of current research and progress in the fields of photovoltaic and concentrated solar power (CSP) Dieckmann and Dersch (2017)
The purpose of this research was to determine the economic feasibility of a hybrid PV-CSP plant for baseload power. Through the combination of current PV and CSP models as well as the development of new models to accommodate additional hybridization, in order to establish the best trade-offs between conflicting technical, environmental, and economic performance measures, multi-objective optimizations were carried out on the data Larchet (2015)
Thermal energy storage in conjunction with concentrated solar power (CSP) may produce sustainable energy that can be used at any time of day or night. In areas with high thresholds of direct normal irradiation, it can facilitate the lowest-cost energy mix Dellicompagni et al. 2021). A dispatch strategy is also tested by using recently introduced indicators. An average tariff approach was also established to achieve a desired level of profitability under the PPA contract. This method was used to calculate the average tariff that was given. It was combined with other plant performance indicators like CAPEX and capacity factor to produce this techno- economic indicator. PV-CSP hybrids outperformed CSP and PV alone in terms of capacity factor and dispatch strategy, indicating that a combined plant's value can be increased by applying operational strategy that maximizes capacity factors or when constraints are applied in terms of matching peak hours or meeting a fixed number of operational hours per day are in place Dominio (2015)
Concentrated Solar Power – PV hybrid technology, is an important research trend in the solar energy field, a number of important issues related to advanced control, integration and real-time optimization are discussed, as well as open problems and a roadmap for future research projects Moris et al. (2021)
Because of their complexity, hybrid solar power plants may be able to combine the benefits of two technologies. Comparatively, the hybridization of an old trough plant reduces the levelized cost of electricity by 30 percent to $104 per megawatt hour. Second, cost-effective photovoltaic are paired with dispatchable CSP technology in a hybrid power generation system. While the cost of power block and thermal storage system is same as it is for concentrated solar power plant, the output power is lower, so LCOE is only marginally lower (174 vs. 186 $/MWh) [16].
An interesting topic is the development of high-capacity factor solar power plants in the Chilean Atacama Desert, given the climate and economic conditions. Using a combination of PV and CSP technologies for such an application has the potential to be successful. Thermal energy storage (TES) in combination with low-cost PV and dispatchable CSP promises to produce baseload power at a lower cost than CSP alone Larchet (2015)
LCOE was estimated for three 50 MW power plants. When considering northern Chile's abundant solar resources, results show that PV-CSP plants are a viable option for delivering sustainable electricity in northern Chile on a continuous basis. Moreover, it can also contribute towards sustained electricity prices, thereby has been fitting the mining sector, and also reducing Chile's carbon footprint Parrado et al. (2016)
In this work, two solar energy harvesters are used to charge rechargeable AA batteries that power EWSN nodes. An affordable commercial boost converter chip and a crude energy collecting circuit are both used. The efficacy of solar energy harvested was calculated by placing five EWSN nodes at a nature reserve Li et al. (2020)
The collected energy for each recorded lighting was computed to compare with the average energy consumption of the EWSN with the greatest power usage. The findings show that the daily gathered energy is enough to cover the EWSN nodes' daily energy consumption, and that the 295 mAh battery charge capacity is enough to dependably sustain their daily dynamic energy consumption Cushing and Wu (2013)
The author of this research built the solar energy harvesting system from two perspectives: the capacity of the super capacitor and the size of the solar panel. In this paper, Author created a simulation in MATLAB using Simulink and then construct a low-power, high-security solar energy collection hardware system for monitoring the environment in Sundsvall, Sweden. A comparison between simulation results and real-world data is used to validate the feasibility of model Li (2018)
For electrical equipment in regions where conventional energy sources are unavailable, energy harvesting is vital. In a wireless sensor network (WSN) or IoT device, this technology eliminates the requirement for network-based energy and conventional batteries, lowering maintenance costs, eliminating the need for cables and batteries, and being more ecologically friendly. In order to be effective, a solar energy harvesting system must be able to collect much more energy than the WSN consumes (often considerably more) (usually substantially more) Pop-Vadean et al. (2017)
The capacity of the plant is assessed for battery size and PV sizing based on the load assessment and the utilization factor calculated for the system. When it comes to sizing a solar PV power plant, PVSYST and C programming are used to accomplish this. In addition, a study is conducted to determine the needs of customers in relation to the solar power plant Sangeetha (2014). This paper will be useful for the design and building of a PV power plant at a location that is suitable for such an operation, in order to replace or support a conventional energy source García-Santacruz et al. (2021)
Photovoltaic rely only on photons released by the sun. Due to the high sensitivity to solar radiation, both the output current and voltage become unstable. To solve the instabilities of solar energy production, a power storage component, such as batteries, must be included in the system. This study's goal is to give an optimal approach for estimating the battery size in a solar power plant for future research Bangun et al. (2019)
3. METHODOLOGY
3.1. PV ARRAY
First of all, we have to calculate the rated power that we receive from the sun. For this reason, we have to find the maximum peak hours for a single day and average available radiation from the sun in kWhm-2d-1. Then we will use following steps to determine total number of Photovoltaic panels required.
First, we will calculate the electric energy demand per day of the site at which solar panel is required to be installed using the following formula.
![]()
Where,
Le= the total energy consumed per day.
Pi= total power required by all appliances
ni= Number of electric appliances
ti = total number of hours, each appliance is used
As we have total energy demand of the site, total area for photovoltaic required can be calculated using the following expression.
![]()
Where,
Apv= area of Photovoltaic required
Havg= average available radiations
𝜂𝑃𝑉= efficiency of PV module
𝜂𝑃𝑉 =efficiency of battery
𝜂𝑃𝑉= efficiency of inverter
𝑇𝐶𝐹 = Temperature correction factor
In the above formula, average daily solar radiations for a location is obtained from meteorological data. Meteorological data provides average solar radiations available per day based upon yearly solar radiations collection. It defines the average energy that is available from sun during a day. Since Efficiency for different solar panels is different, the data sheet provides the efficiency of PV modules at STC. Similarly, the efficiency of battery varies from 80-90% and largely depends upon the chemistry and type of battery, for which manufacturer’s data is used. The efficiency of inverter can also be obtained from datasheet provided by manufacturer.
The peak output power by the PV system is calculated using the formula:
![]()
Where, Pp= peak power output by Photovoltaic panels
After calculation of Peak output power of PV system, total number of modules can be obtained using the following formula. Number of modules depend upon the power rating of a single modules. By standards, the number of solar panels are always kept in even numbers and in case of an odd value, always round off to next even number (e.g., if total panel required are 7, the numbers are round off to 8).
![]()
Where, Pm= power rating of a PV module
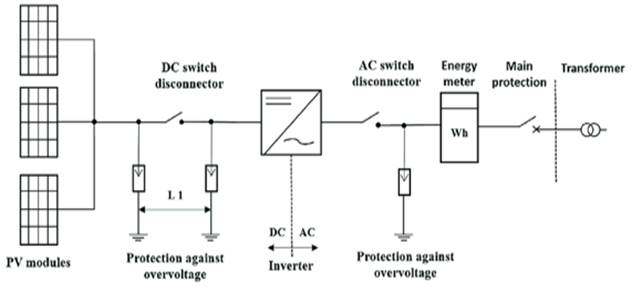
In a grid-connected PV system, the PV array is directly linked to the grid-connected inverter without the use of a storage battery. There will be no power from the utility company if your PV system generates enough electricity. If your system generates more energy than you consume, the surplus will be exported to the energy utility grid, which will cause your meter to read backwards. When the PV system isn't producing electricity, such as at night, the building's demand is met entirely by the power grid. Instead, the energy utility business will provide providers energy credit depending on solar production. This is referred to as "Net Metering". Energy flows in and out of a single meter in this process.
The easiest and most cost-effective approach to connect PV modules to conventional utility electricity is through a grid-connected system. You don't need a battery if your utility power is stable and properly maintained in your location, and energy storage is not a necessity. However, even if there is solar, if the utility power goes out, the PV system will be turned off for the safety of utility personnel. Grid- connected PV systems are most commonly used in cities that are well-served by the national electricity grid. PV systems are often put on the roofs of buildings or incorporated into the structure.
Figure 1
|
Figure 1 Grid connected PV system |
For a grid-connected PV system, size of inverter required is calculated using following formula. The size of inverter is kept 20-25% more than load and can be further increased to 2 or 3 times if torque load (such as motors) is required to be operated over solar system.
![]()
where,
Cinv= size of inverter
kinv = Torque load factor
P= Peak load of all appliances
Besides inverter wattage rating, inverters are also rated for input DC voltage and output AC voltage. Input DC voltage of an inverter is the DC voltage range between which inverter operates. The arrangement of solar panels in series and strings in made in such a way voltage output from PV system falls under the DC input range of inverter. Moreover, inverters are either three phase or single phase. A single-phase inverter can either be 110Vac or 220Vac depending upon the grid voltage of that location.
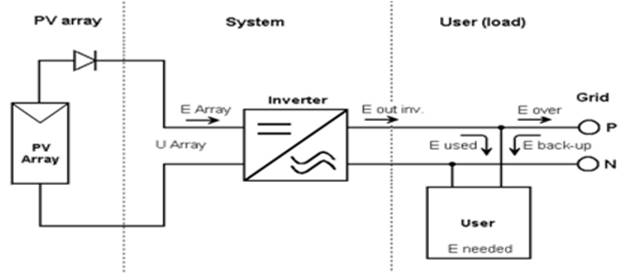
3.2. MODEL FORMULATIONS
The model we have for ON-Grid PV system on PVsyst software is shown below.
Figure 2
|
Figure 2 On-Grid PV system mode |
1. Benefits
of Grid Connected system
A grid-connected system can help you lessen your reliance on utility electricity while also increasing your renewable energy output and helping the environment.
· It is not always necessary to fulfil all electrical requirements in a system.
· Panels take up less space and there are no batteries.
· Cost-effective
2. Drawbacks
of Grid Connected system
· Doesn't stop power outages on the grid.
· A tiny battery bank can handle it.
4. RESULTS AND DISCUSSION
A project is being worked on to install solar panels at Jeddah international airport. For this, simulation of On-grid case scenarios has been carried out using PVsyst. Following the methodology explained in previous chapter total load is determined. During the research work, the peak power requirement and energy consumption during each month is taken. Keeping in view these values grid tied, and off-grid PV system simulation is setup in PVsyst.
4.1. PVSYST - SIMULATION REPORT GRID-CONNECTED SYSTEM
The geographical coordinates of Jeddah airport are 39.18˚E and 26.65˚N. For weather data of that location, metronome data was used. The following table shows the weather and location parameter selected in PVsyst.
Table 1
|
Table 1
Geographical location of site |
|||
|
Geographical
Site Al MArwah |
Situation |
Project
settings |
|
|
Meteo
data |
Latitude |
21.65
N |
0.2 |
|
Al
Marwah |
Longitude |
38.18
E |
|
|
Meteonorm
8.0 (1998-2002) |
Altitude |
13
m |
|
|
Time
Zone |
UTC+3 |
||
For the grid connected PV system, TSM-540DE19 from Trina Solar is selected. It is a 540Wp solar module that can be used in megawatt scale PV systems. Total number of PV modules that can be installed in the available area comes out to be 925925. Keeping view the input voltage of inverter and total number of panels that can be installed in series, 35 solar panels are installed in series, which makes total 26455 strings. For the designed PV system, total 158 MPPT inverters from Sun grow (SG2500HV) of 2500kWac are selected. The input DC voltage range of the inverter is 800-1300V which aligns with output voltage from a single strings of PV panels (961V).
Table 2
|
Table 2 Specifications of PV module and inverter |
|||
|
PV model |
Inverter |
||
|
Manufacturer |
Trina
solar |
Manufacturer |
Sungrow |
|
Model |
TSM
– 540DE19 |
Model |
SG2500HV |
|
(Custom
parameters definition) |
(Original
PVsyst database) |
||
|
Unit
nom: power |
540
WP |
Unit
nom: power |
2500KWac |
|
Number
of PV models |
925925
units |
Number
of inverters |
158
units |
|
Nominal
(STC) |
500
MWp |
Total
power |
395000
KWac |
|
Modules |
26455
strings x 35 in series |
Operating
voltage |
800-1300
V |
|
At
operating cond. (55 C) |
Pnom
Ratio (DC: AC) |
1.27 |
|
|
Pmpp |
447.8
MWp |
||
|
U
mppl |
961
V |
||
|
Mpp |
466164
A |
||
|
Total
PV power |
Total
inverter power |
||
|
Nominal
(STC) |
500000
KWp |
Total
power |
395000
KWac |
|
Total |
925925
modules |
Nb.
Of inverters |
158
units |
|
Module
area |
2419316
m^2 |
Pnom
ratio |
1.27 |
|
Cell
area |
2245831
m^2 |
||
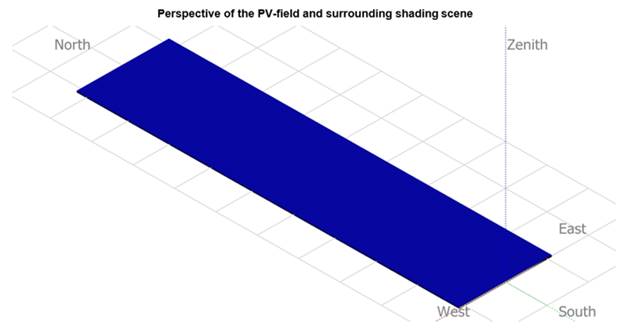
The table below shows the orientation and position of solar panels for installation. The optimum tilt angle for solar panels according to location is set to 22. For design of layout, near shadings analysis is used in PVsyst. Keeping in view the phenomenon of back row shading and to accommodate maximum number of panels in the available space, sheds spacing of 5m is selected. After designing layout and making spaces where necessary, ground coverage ratio of 47.7% is achieved.
Table 3
|
Table 3 Orientation
and position of PV modules |
|||||
|
Grid-Connected
System |
Sheds,
single array |
||||
|
Orientation |
Sheds
configuration |
Models
used |
|||
|
Fixed
plane |
Nb.
of sheds |
925
units |
Transposition |
Hay |
|
|
Tilt/Azimuth |
22/0 |
Single
array |
Diffuse |
Perez,
Meteonorm |
|
|
Sizes |
Circumsolar |
with
diffuse |
|||
|
Sheds
spacing |
5.00
m |
||||
|
Collector
width |
2.38
m |
||||
|
Ground
Coy. Ratio (GCR) |
47.70% |
||||
|
Top
inactive band |
0.02
m |
||||
|
Bottom
inactive band |
0.02
m |
||||
|
Shading
limit angle |
|||||
|
Limit
profile angle |
18.0
° |
||||
|
Horizon |
Near
Shadings |
User's
needs |
|||
|
Free
Horizon |
Linear
shadings |
Fixed
constant load 8084 kW Global70.81 GWh/Year |
|||
Figure 3
|
Figure 3 PV layout designed in PVSYST for shadow
analysis |
The table below shows the losses that are considered while setting up the simulation. Soiling losses are location dependent and varies with type of terrain and weather of location. An estimation of 3% was selected based on studies conducted (Cordero et al., 2018). Besides that, all electrical losses were selected as per the standards which will result in better translation of realistic values. The table shows the losses consideration in AC, DC cables and transformers.
Table 4
|
Table 4 Consideration
of different types of losses |
|||||
|
Array
Soiling Losses |
Thermal
Loss factor |
DC
wiring losses |
|||
|
Loss
Fraction |
3.00% |
Module
temperature according to irradiance |
Global
array res |
0.035
m0 |
|
|
Uc
(const) |
29.0
W/m2K |
Loss
Fraction |
1.5
% at STC |
||
|
Uv
(wind) |
0.0
W/m2K/m/s |
||||
|
Serie
Diode Loss |
LID
- Light Induced |
Module
Quality Loss |
|||
|
Voltage
drop |
0.7V |
Loss
Fraction |
2.00% |
Loss
Fraction |
0.80% |
|
Loss
Fraction |
0.1
% at STC |
||||
|
MV
transformer |
Inverter
output line up to MV transformer |
||||
|
Grid
voltage |
33
KV |
Inverter
voltage |
550
Vac tri |
||
|
Operating
losses at STC |
Loss
Fraction |
1.55
% at STC |
|||
|
Nominal
power at STC |
493626
kVA |
Inverter:
SG2500HV |
Copper
158 x 3 x 2500 mm2 200m |
||
|
Iron
loss (night disconnect) |
49.36
kW/Inv |
Wire
section (158 Inv.) |
|||
|
Loss
Fraction |
0.10
% at STC |
Average
wires length |
|||
|
Coils
equivalent |
3
x 0.06 |
MV
line up to Injection |
|||
|
resistance |
mOJinv |
MV
Voltage |
33
kV |
||
|
Loss
Fraction |
1.00
% at STC |
Average
each inverter Wires |
Copper
3 x 1200 mm2 |
||
|
Length |
550
m |
||||
|
Loss
Fraction |
0.04
% at STC |
||||
4.2. PERFORMANCE ANALYSIS OF GRID CONNECTED PV SYSTEM
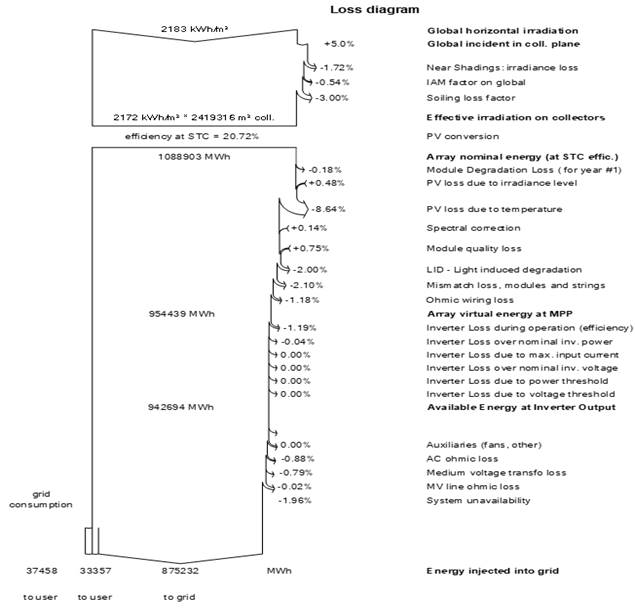
The graphs and tables below show the main performance analysis and energy balance of whole system. It shows that total of 908589 MWh/year energy can be produced from system and out of which 70814MWh will be used at airport. PVsyst has a performance metric to measure the efficiency of system designed and it is called performance ratio. A well-designed system has performance ratio of 75%-82%. The system we designed in PVsyst has a performance ratio of 79.31%. The energy balance table shows the total energy harvested from the sun, utilized at the airport and energy sold to grid. Since. It is a grid connected PV system energy balance table also shows the amount of energy received from the grid. Overall, the energy balance shows a positive energy production means more energy is being produced and sent to grid than being utilized at the site and received.
Table 5
|
Table 5
Yearly energy production and costs |
|||||
|
System
Production |
|||||
|
Produced
Energy |
908589MWhyear |
Specific
production |
1817
kWh/kWp/year |
||
|
Used
Energy |
70814
MWh/year |
Performance
Ratio PR |
79.31% |
||
|
Solar
Fraction SF |
47.10% |
||||
|
Economic
evaluation |
|||||
|
Investment |
Yearly
cost |
LCOE |
|||
|
Global |
373406485.52
USD |
Annuities |
0.0
USD/yr |
Energy
cos |
0.07 USD/kWh |
|
Specific |
0.75
USD/Wp |
Run.
Costs |
51654827.10
USD/yr |
||
|
Payback
period |
4.1
years |
||||
Figure 4
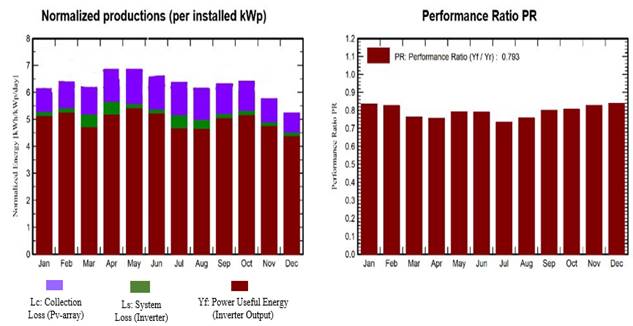
|
Figure 4 Monthly performance ratio and
Normalized productions per kWp |
Table 6
|
Table 6 Yearly energy balance of system |
||||||||||
|
GlobH kWh/m2or |
DiffHor kWh/m2 |
T Amb°C |
Globlnc
kWh/m2 |
GlobEff kWh/m2 |
EArray MWh |
E_User
MWh |
E_Solar
MWh |
E_Grid
MWh |
EFrGrid
MWh |
|
|
January |
148.8 |
37.27 |
21.96 |
190.3 |
181.8 |
82101 |
6014 |
2702 |
76903 |
3312 |
|
February |
153.1 |
52.49 |
23.32 |
179 |
170.2 |
76145 |
5432 |
2490 |
71401 |
2943 |
|
March |
180.5 |
72.61 |
25.89 |
191.8 |
181.8 |
80533 |
6014 |
2596 |
70603 |
3419 |
|
April |
208.1 |
73.47 |
28.62 |
205.7 |
195.1 |
85036 |
5820 |
2716 |
75197 |
3104 |
|
May |
229.8 |
84.69 |
31.75 |
212.5 |
201.1 |
86708 |
6014 |
3196 |
80992 |
2819 |
|
June |
219.6 |
95.18 |
32.65 |
198.6 |
187.5 |
80827 |
5820 |
3153 |
75399 |
2668 |
|
July |
216.5 |
94.97 |
34.39 |
197.8 |
186.8 |
80186 |
6014 |
3015 |
69701 |
2999 |
|
August |
198 |
99.58 |
33.91 |
191 |
180.1 |
77601 |
6014 |
2982 |
69404 |
3032 |
|
September |
183.7 |
77.56 |
31.33 |
189.9 |
179.8 |
78310 |
5820 |
2782 |
73282 |
3038 |
|
October |
176.1 |
62.96 |
29.71 |
199 |
189.2 |
82662 |
6014 |
2738 |
77469 |
3276 |
|
November |
140.6 |
49.36 |
26.69 |
173 |
164.6 |
73709 |
5820 |
2447 |
69158 |
3373 |
|
December |
128 |
48.79 |
23.95 |
162.6 |
154.5 |
70257 |
6014 |
2540 |
65723 |
3474 |
|
Year |
2182.7 |
848.93 |
28.71 |
2291.1 |
2172.4 |
954073 |
70814 |
33357 |
875232 |
37458 |
Figure 5
|
Figure 5 Energy loss diagram of Grid connected
PV system |
4.3. FINANCIAL ANALYSIS
The financial analysis of the grid tied PV system is shows in below tables. The most important parameters are the investment cost, Payback period and lifetime of the system. Keeping in view the lifetime of solar panels and other equipment, 25 years are considered the total life of the project. Cost of each equipment and operation was considered as the current market value of each equipment and hourly rate. For 25-year analysis, inflation of 1% per year is taken to accommodate for future cost increase and currency devaluation. Cost analysis shows that energy produced will cost 0.073USD/kWh. From the energy balance table and cost analysis it is concluded that payback period of the system is 4.1 years. Which is very reasonable when comparing to other PV systems?
Table 7
|
Table
7 Cost of PV equipment and installation |
|||
|
Item |
Quantity |
Cost |
Total USD |
|
units |
USD |
||
|
PV modules |
|||
|
TSM-540DE19 |
925925 |
181.06 |
167651891.5 |
|
Supports for
modules |
925925 |
41.15 |
38102702.6 |
|
Inverters |
158 |
192925.08 |
30482162.08 |
|
SG2500HV |
|||
|
Other
components |
|||
|
Accessories,
fasteners |
1 |
7620540.52 |
7620540.52 |
|
Wiring |
1 |
22861621.56 |
22861621.56 |
|
Combiner box |
1 |
15241081.04 |
15241081.04 |
|
Monitoring
system, display screen |
1 |
7620540.52 |
7620540.52 |
|
Measurement
system, pyranometer |
1 |
3810270.26 |
3810270.26 |
|
Surge arrester |
1 |
3810270.26 |
3810270.26 |
|
Studies and
analysis |
|||
|
Engineering |
1 |
11430810.78 |
11430810.78 |
|
Permitting and
other admin. Fees |
1 |
3810270.26 |
3810270.26 |
|
Installation |
|||
|
Global
installation cost per module |
925925 |
32.92 |
30482162.08 |
|
Global
installation cost per inverter |
158 |
48231.27 |
7620540.52 |
|
Insurance |
|||
|
Building
insurance |
1 |
7620540.52 |
7620540.52 |
|
Transport
insurance |
1 |
7620540.52 |
7620540.52 |
|
Liability
insurance |
1 |
7620540.52 |
7620540.52 |
|
Total |
373406485.5 |
||
|
Depreciable asset |
243857296.7 |
||
Table 8
|
Table 8 Operating cost of grid connected
PV system |
|
|
Item |
Total
' |
|
USD/Year |
|
|
Maintenance |
|
|
Salaries |
22861621.56 |
|
Repairs |
7620540.52 |
|
Cleaning |
7620540.52 |
|
Bank
charges |
7620540.52 |
|
Total
(OPEX) |
45723243.13 |
|
Including
inflation (1.00%) |
51654827.1 |
|
System
summary |
373406485.52
USD |
|
Total
installation cost |
51654827.10
USD/year |
|
Operating
costs (incl. inflation 1.00%/year) |
33357
MWh/year |
|
Unused
energy |
875232
MWh/year |
|
Energy
sold to the grid |
0.073
USD/kWh |
|
Cost
of produced energy (LCOE) |
|
Table 9
|
Table 9 Detailed economic analysis of PV
system |
||||||||||
|
Years |
Electricity
sale |
Run.
costs |
Depre allows |
Taxable
income |
Taxes |
After-tax
profit |
Self-cons.
saving |
Cumul. profit |
%
amorti. |
|
|
2023 |
133395 |
45723 |
0 |
87672 |
0 |
87672 |
5084 |
-280651 |
24.80% |
|
|
2024 |
133395 |
46180 |
0 |
87215 |
0 |
87215 |
5109 |
-188327 |
49.60% |
|
|
2025 |
133395 |
46642 |
0 |
86753 |
0 |
86753 |
5135 |
-96439 |
74.20% |
|
|
2026 |
133395 |
47109 |
0 |
86286 |
0 |
86286 |
5160 |
-4993 |
98.70% |
|
|
2027 |
133395 |
47580 |
0 |
85815 |
0 |
85815 |
5186 |
86008 |
123.00% |
|
|
2028 |
133395 |
48056 |
0 |
85339 |
0 |
85339 |
5211 |
176559 |
147.30% |
|
|
2029 |
133395 |
48536 |
0 |
84859 |
0 |
84859 |
5236 |
266654 |
171.40% |
|
|
2030 |
133395 |
49022 |
0 |
84374 |
0 |
84374 |
5262 |
356289 |
195.40% |
|
|
2031 |
133395 |
49512 |
0 |
83883 |
0 |
83883 |
5287 |
445460 |
219.30% |
|
|
2032 |
133395 |
50007 |
0 |
83388 |
0 |
83388 |
5313 |
534161 |
243.10% |
|
|
2033 |
133395 |
50507 |
0 |
82888 |
0 |
82888 |
5338 |
622387 |
266.70% |
|
|
2034 |
133395 |
51012 |
0 |
82383 |
0 |
82383 |
5364 |
710134 |
290.20% |
|
|
2035 |
133395 |
51522 |
0 |
81873 |
0 |
81873 |
5389 |
797396 |
313.50% |
|
|
2036 |
133395 |
52037 |
0 |
81358 |
0 |
81358 |
5414 |
884168 |
336.80% |
|
|
2037 |
133395 |
52558 |
0 |
80837 |
0 |
80837 |
5440 |
970445 |
359.90% |
|
|
2038 |
133395 |
53083 |
0 |
80312 |
0 |
80312 |
5465 |
1056222 |
382.90% |
|
|
2039 |
133395 |
53614 |
0 |
79781 |
0 |
79781 |
5491 |
1141494 |
405.70% |
|
|
2040 |
133395 |
54150 |
0 |
79245 |
0 |
79245 |
5516 |
1226254 |
428.40% |
|
|
2041 |
133395 |
54692 |
0 |
78703 |
0 |
78703 |
5542 |
1310499 |
451.00% |
|
|
2042 |
133395 |
55239 |
0 |
78156 |
0 |
78156 |
5567 |
1394223 |
473.40% |
|
|
2043 |
66698 |
55791 |
0 |
10906 |
0 |
10906 |
5592 |
1410721 |
477.80% |
|
|
2044 |
66698 |
56349 |
0 |
10349 |
0 |
10349 |
5618 |
1426688 |
482.10% |
|
|
2045 |
66698 |
56912 |
0 |
9785 |
0 |
9785 |
5643 |
1442116 |
486.20% |
|
|
2046 |
66698 |
57482 |
0 |
9216 |
0 |
9216 |
5669 |
1457001 |
490.20% |
|
|
2047 |
66698 |
58056 |
0 |
8641 |
0 |
8641 |
5694 |
1471336 |
494.00% |
|
|
Total |
3001388 |
1291371 |
0 |
1710017 |
0 |
1710017 |
134725 |
1471336 |
494.00% |
|
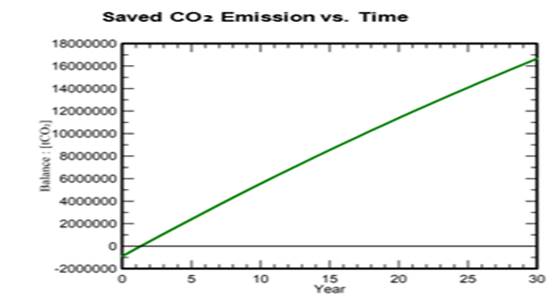
One of the objectives of opting a solar energy is the carbon footprint reduction. A CO2 emission analysis is used to evaluate the system life cycle emission details. The following tables show the breakdown of kgCo2 by each equipment.
Table 10
|
Table 10
Emission details of system life cycle |
|||
|
Total: |
16670028.5 tCO2 |
||
|
Generated
emissions |
902323.80 tCO2 |
||
|
Total: |
|||
|
Source:
Detailed calculation from table below: |
20252452.0
tCO2 908589.14 MWh/yr 743 gCO2/kWh |
||
|
Replaced
Emissions |
lEA
List |
||
|
Total: |
Saudi
Arabia |
||
|
System
production: |
30
years |
||
|
Grid
Lifecycle Emissions: Source: |
1.00% |
||
|
Country: |
|||
|
Lifetime: |
|||
|
Annual
degradation: |
|||
|
System
Lifecycle Emissions Details |
|||
|
Item |
LCE |
Quantity |
Subtotal,
[kgCO2] |
|
Modules |
1713
kgCO2/kWp |
500000
kWp |
856359144 |
|
|
4.96
kgCO2/kg |
9259250
kg |
45887084 |
|
Inverters |
491
kgCO2/units |
158
units |
77574 |
Figure 6
|
Figure 6 |
5. CONCLUSION
The Kingdom of Saudi Arabia is undergoing through various stages and working on projects to make their airports environment friendly and pollution free. In this work, it is designed to install a solar PV system in Jeddah International airport. Using PVsyst software, the On-grid design has been simulated as well as the economic analysis has been calculated. In designing PV systems, optimum tilt angle for panels and shading analysis must be handled carefully. Proper selection of electricity losses (transformer, AC/DC cables, Inverter), help in determining real values. A perfect PV design enables us to produce an energy that can be sold out to the grid beyond supplying the host area, makes profitable. The most important findings have been concluded as follow:
· The cost analysis shows that energy produced will cost 0.073USD/kWh. Detailed economic analysis of 25 years shows that there from the energy balance table and cost analysis it is concluded that payback period or the return of investment of the system is 4.1 years. Which is very reasonable and costly when comparing to other power generation systems.
· It shows that total of 908589 MWh/year energy can be produced from system and out of which 70814MWh will be used at airport. PVsyst has a performance metric to measure the efficiency of system designed and it is called performance ratio. A well-designed system has performance ratio of 75%-82%.
· Installation of such prestigious projects will make the airport quiet and clean as there is any noise produced and gases emitted to the environment which is keen to keep travellers’ safety and health.
CONFLICT OF INTERESTS
None.
ACKNOWLEDGMENTS
None.
REFERENCES
Al-Zahrani, A. Bindayel, A. Al-Rished, A. Perdichizzi, A. Franchini, G. & Ravelli, S. (2017). Comparative analysis of Different CSP plant configurations in Saudi Arabia. Saudi Arabia Smart Grid Conference, SASG. https://doi.org/10.1109/SASG.2016.7849679
Alawaji, S. H. & Hasnain, S. M. (2010). Role of Solar Energy Research in Transferring of Technology to Saudi Arabia, 21(10), 923-934. https://doi.org/10.1080/00908319950014290
Almasri, R. A. & Almarshoud, A. (2017). Feasibility of Using Evacuated Tube Solar Water Heaters in Saudi Arabia | Semantic Scholar.
Apribowo, C. H. B. Nizam, M. Pramono, S. Maghfiroh, H. & Hakim, K. (2021). Design and Analysis Performance Solar Power Plant 15 kW By Maximizing Final Yield and Performance Ratio In Small-Medium Office. IOP Conference Series: Materials Science and Engineering. https://doi.org/10.1088/1757-899X/1096/1/012082
Bangun, G. M. Nabila, N. Budiansyah, M. A. Alvianingsih, G. & Utomo, A. R. (2019). Study of Battery Sizing for Solar Power Plant. IOP Conference Series: Earth and Environmental Science, 353(1). https://doi.org/10.1088/1755-1315/353/1/012004
Cushing, S. K. & Wu, N. (2013). Plasmon-enhanced solar energy harvesting. Electrochemical Society Interface, 22(2), 63-67. https://doi.org/10.1149/2.F08132if
Dieckmann, S. & Dersch, J. (2017). Simulation of hybrid solar power plants. AIP Conference Proceedings, 1850(1). https://doi.org/10.1063/1.4984539
Dominio, F. (2015). Techno-Economic Analysis of Hybrid PV-CSP Power Plants. Master's Thesis.
Farahat, A. Kambezidis, H. D. Almazroui, M. & Ramadan, E. (2021). Solar Potential in Saudi Arabia for Southward-Inclined Flat-Plate Surfaces. Applied Sciences, 11(9), 4101. https://doi.org/10.3390/app11094101
Franklin, E.K.V. (2019). Calculations for a Grid-Connected Solar Energy System. Cooperative Extrension, June, 1-8.
García-Santacruz, C. Galván, L. Carrasco, J. M. & Galván, E. (2021). Sizing and Management of Energy Storage Systems in Large-Scale Power Plants Using Price Control and Artificial Intelligence. 14(11), 3296. https://doi.org/10.3390/en14113296
Hepbasli, A. Sangeetha, S. (2014). Sizing of Solar PV Power Plant in Stand-Alone. International Journal of Engineering Research & Technology (IJERT), 3(6), 51-55.
Hindocha, K. & Shah, S. (2020). Design of 50 MW Grid Connected Solar Power Plant. International Journal of Engineering Research And, (4). https://doi.org/10.17577/IJERTV9IS040762
IFC. (2015). Utility-Scale Solar Photovoltaic Power Plants. 35-39.
Larchet, K. (2015). Solar PV-CSP Hybridisation for Baseload Generation : A Techno-economic Analysis for the Chilean Market.
Li, Y. Hamed, E. A. Zhang, X. Luna, D. Lin, J. S. Liang, X. & Lee, I. (2020). Feasibility of Harvesting Solar Energy for Self-Powered Environmental Wireless Sensor Nodes. 9(12), 2058. https://doi.org/10.3390/electronics9122058
Li, Z. (2018). The Optimization of Solar Energy Harvesting in WSN. https://doi.org/10.1155/2018/9609735
Majumder, M. & Saha, A. K. (2016). Feasibility Model of Solar Energy Plants by ANN and MCDM Techniques. https://doi.org/10.1007/978-981-287-308-8
Moris, C. H. Guevara, M. T. C. Salmon, A. & Lorca, A. (2021). Comparison between Concentrated Solar Power and Gas-Based Generation in Terms of Economic and Flexibility-Related Aspects in Chile. 14(4), 1063. https://doi.org/10.3390/en14041063
Parrado, C. Girard, A. Simon, F. & Fuentealba, E. (2016). 2050 LCOE (Levelized Cost of Energy) projection for a hybrid PV (photovoltaic)-CSP (concentrated solar power) plant in the Atacama Desert, 94, 422-430. https://doi.org/10.1016/j.energy.2015.11.015
Petrollese, R. R. Damiani, A. Laroze, D. MacDonell, S. Jorquera, J. Sepúlveda, E. Feron, S. Llanillo, P. Labbe, F. Carrasco, J. Ferrer, J. & Torres, G. (2018). Effects of soiling on photovoltaic (PV) modules in the Atacama Desert. Scientific Reports, 8(1), 1-14. https://doi.org/10.1038/s41598-018-32291-8
Pop-Vadean, A. Pop, P. P. Latinovic, T. Barz, C. & Lung, C. (2017). Harvesting energy an sustainable power source, replace batteries for powering WSN and devices on the IoT. IOP Conference Series: Materials Science and Engineering, 200(1). https://doi.org/10.1088/1757-899X/200/1/012043
Roni, M. M. Hoque, I. U. & Ahmed, T. (2019). Comparative Study of Levelized Cost of Electricity (LCOE) for Concentrating Solar Power (CSP) and Photovoltaic (PV) Plant in the Southeastern Region of Bangladesh. 2nd International Conference on Electrical, Computer and Communication Engineering. https://doi.org/10.1109/ECACE.2019.8679173
Ruiz, H. S. Sunarso, A. Ibrahim-Bathis, K. Murti, S. A. & Budiarto, I. (2020). GIS-AHP Multi Criteria Decision Analysis for the optimal location of solar energy plants at Indonesia. Energy Reports, 6, 3249-3263. https://doi.org/10.1016/j.egyr.2020.11.198
Özcan, M. Ünlerşen, M. F. & Mutluer, M. (2018). Financial Analysis of The Solar Energy Plant Established In Konya Using The Production Data.
|
|
 This work is licensed under a: Creative Commons Attribution 4.0 International License
© IJETMR 2014-2022. All Rights Reserved.