
|
|
|
|
PREDICTIVE ANALYTICS OF ACADEMIC PERFORMANCE OF SENIOR HIGH SCHOOL (SHS) STUDENTS: A CASE STUDY OF SUNYANI SHSAdjei-Pokuaa Henrietta 1 1, 2 Department of Computer Science and Informatics, University of Energy and Natural Resources, Ghana |
|
||
|
|
|||
|
Received 03 January 2022 Accepted 01 February 2022 Published 21 February 2022 Corresponding Author Adjei-Pokuaa
Henrietta, herttydonkor@gmail.com DOI 10.29121/ijetmr.v9.i2.2022.1088 Funding:
This
research received no specific grant from any funding agency in the public,
commercial, or not-for-profit sectors. Copyright:
© 2022
The Author(s). This is an open access article distributed under the terms of
the Creative Commons Attribution License, which permits unrestricted use, distribution,
and reproduction in any medium, provided the original author and source are
credited.
|
ABSTRACT |
|
|
|
Due to
the availability and increasing adoption of technology in learning management
systems, online admission systems, school management systems, and educational
databases have expanded in recent years. Motivation/Background:
Literature shows that these data contain vital and relevant information that
could be used to monitor and advise students’ so that their performance could
be enhanced. In this study, the random forest algorithm is proposed to
identify and examine the factors that influence students’ performance in
WASSCE. Also, predict the future performance of students in WASSCE. Method:
A total of one thousand five hundred and twenty students’ data were selected
from Sunyani SHS. The results revealed that demographic data (age and gender)
do not influence the performance of students in their final WASSCE. Results:
However, an accuracy of 89.4% with error metrics (RMSE) 0.001639 and MAPE
error of 0.001321 revealed that the proposed model could effectively predict
the performance of students in the WASSCE. |
|
||
|
Keywords: Learning Management, Demographic Data, Effectively Predict, Random
Forest Algorithm 1. INTRODUCTION The size of the
educational database keeps proliferating every three years and these
databases contain useful information that can be effectively employed to
improve the academic performance of students Yadav and Pal (2012).
There is a growing focus on institutional data mining by administrators,
educational planners, and managers due to the exponential growth of
educational data. (Anuradha & Velmurugan, 2015). Data mining techniques have been applied in
educational systems to increase the understanding of the process of learning
by concentrating on key issues such as identifying, mining, and evaluating
parameters and variables which are associated with the learning progress of
students Yadav and Pal (2012).
Students’ academic performance is a critical factor in every educational
setting, especially in senior high learning institutes, because educational
institutions are rated based on the academic excellence achieved by their
students and academic staff Mohamed et al. (2016). Forecasting
the academic performance of students in the real world has many challenges,
but this has been made easy with the growth in information and communication
technologies granting access to a large amount of information that could
facilitate the critical decision-making process. Knowledge Discovery in |
|
||


Databases (KDD) also called Data Mining (DM) is the process of extracting hidden patterns and discovering of associations between parameters in a massive amount of data (Ahmad et al., 2015; Kaur et al., 2015). DM techniques have made numerous achievements in areas such as marketing, education, engineering, finance, healthcare, and sports by helping decision-makers in finding a solution to everyday problems in these fields. This study focused on predicting final WASSCE score of SHS students’ using random forest algorithm based on their Demographic Data and Past Exams records. Undoubtedly, this investigation will lead to students’ performance prediction based on their demographic data and previous final examinations score, and this will ensure an immense benefit as follows: By knowing this information, teachers will be able to take the needed actions of the learning activities in the classroom to enhance students' skills. Enhance better arrangement of sitting position in class to maintain a balanced education and promote students to student interaction among fast and slow learners. Knowing the performance of students at the early stage helps teachers and schools’ authorities to take charge and provide the needed assistance to the students involved
General Factors Affecting the Academic Performance of Students: Literature has shown that academic is affected by four main factors and that includes: the effect of teaching and learning materials on students’ academic performance, the effect of administrative power of organizational practices on students’ academic performance, the consequence of teacher related factors on students’ academic performance, and finally the effect of socioeconomic background on students’ academic performance. Teaching and learning resources, and environment have great impact on students’ Academic Performance. According to Kieti (2017) educational creativity of teachers and students is believed to be a dependent of available facilities within the educational settlement or environments. Abundance in teaching and learning facilities and resources such as physical facilities, which include the habitable state-of-class and lecture-rooms, computer-room, equipped-library, laboratories, better dining halls, qualified and experienced teachers, teaching and learning materials (TLMs) contributes immensely to the success of students. As stated by Kieti (2017), Tran et al. (2017), Tuen et al. (2019) sufficiency current textbooks, learning videos and software, and other materials coincidental to learning have a good reflection on students’ performance when these studying materials are supplied or provided sufficiently. As proposed by (Bydovska & Popelinsky, 2013, Li et al. (2013) concluded that an excellent illumination, clean and fresh air, safe, quiet, and comfortable learning environs are essential factors for positive achievement academically by students. It has been confirmed by (James et al., 2015, Morrison, 2017, Tuen et al. (2019) that, encouraging physical exercises, diminishing stress, decreasing air and noise pollution, and exposure to heat is excellent teaching and learning atmosphere. Studies have presented those organizational practices have effects on students’ academic performance such practice include but not limited to instructions, leadership, and management Kieti (2017), Buabeng-Andoh, 2015, Egbenya and Halm (2016) Academic scholars have presented in literature that teacher-related factors such as the teacher’s commitment, motivation, workload, and frequency of absenteeism (Affum-osei et al., 2014) have effects on students’ academic performance.
On the other hand, socio-economic background of the student: the Socio-Economic Status (SES) of a child is generally determined by merging parents’ occupational status, educational level, and income level. Research has confirmed over and over that, SES affects students’ academic performance and that students’ who have a low SES earn lower exams and quiz scores and are more likely to be school dropout (Al-Rahmi & Zeki, 2017; Oladejo et al., 2011; Seah et al., 2015). The consequence of SES on students’ academic performance has been found to dominate other educational influential factors, like parental involvement. There are highly negative associations with low SES and academic performance of students. Other scholars have argued that, economically some parents are less capable of paying for the cost of education of their children at advanced levels and subsequently, their children do not work at their maximum potentials (Nguyen, 2017). The home environs have a remarkably significant part to play on the academic performance of every child.
Application of Data Mining in Academic Performance Prediction: Knowledge of students’ performance in advance is key in the educational settings Bhardwaj and Pal (2011), Kaur et al., 2015; Ming et al., 2014). The performance of a student is pivoted on many dynamics like personal, psychological, social, and other environmental features. An effective and efficient way to achieve students’ academic performance prediction is the use of the technique of Data Mining (DM) mostly referred to as Knowledge Discovery in Databases (KDD) (Ahmad et al., 2015; Kaur et al., 2015). DM techniques are applied in an extensive database to notice unseen relationships and patterns helpful in decision making (Argiddi & Apte, 2012; Kaur et al., 2015; Khasanah and Harwati (2017), Ramesh et al., 2013). DM can also be employed in educational institutions to promote understanding of the pedagogical and learning process to focus on discovery and evaluating the variables related to students learning Bhardwaj and Pal (2011), Devasia et al. (2016). DM applies to Artificial Intelligence (AI) and machine learning algorithms in discovering these hidden details in the educational database.
Numerous researchers have applied machine learning (ML) algorithms for predicting and detecting factors that influence student academic performance. Literature shows that the academic success of students is dependent on one factor or the other. Hence, there is no dependable agreement among different studies Table 1 present details of input data for prediction students’ academic performance.
Here are some of these studies. The student performance prediction system based on a decision support system (DSS) was proposed by (Dole & Rajurkar, 2014) using the Naïve Bayes algorithm. A novel DSS framework for predicting students’ performance concerning their final examinations of a school was carried out in (Livieris et al., 2015) using a hybrid machine learning algorithm. A hybrid classifier consisting of three parallel algorithms, namely DT, KNN, and Aggregating One-Dependence Estimators (AODE) in Pandey and Taruna (2016) was implemented for accurate prediction of students’ performance. An assembling of three DT (C4-5, ID3, and CART) algorithms were applied on the data of students studying engineering to predict their performance in their final examinations in Yadav and Pal (2012).
Engineering students’ academic performance was carried out in Li et al. (2013) by lump together machine learning algorithms namely principal component analysis, K-means, and hierarchical clustering, and KNN and NB classifiers. The intellectual and non-intellectual actions of students, together with demographic information was used as input parameters to a predictive framework proposed by Musso et al. (2013) to predict students’ academic performance based on Artificial Neural Networks (ANN). A combination of NB, Multilayer Perceptron (MLP), and DT algorithms was proposed in Osmanbegović et al. (2014), Osmanbegovic and Suljic (2012) to predict students’ academic performance. A decision tree classifier was implemented to predict the performance of students in Berhanu (2015).
Students’ performance prediction model using Multi-Agent Data Mining was proposed in (AlMalaise et al., 2014) to predict the performance of the students based on their past academic records. ANN model, for predicting the probable performance of an applicant of university admissions was implemented and tested Oladokun et al. (2008). Similarly, ANN-based student academic performance predictive framework with two meta-heuristic algorithms motivated by cuckoo birds and their lifestyle, namely, Cuckoo Search (CS) and Cuckoo Optimization Algorithm (COA) is proposed in Chen et al. (2014).
A Neural Network model is proposed to predict the performance of students in an academic organization Agrawal and Mavani (2015). A combination of ANN, DT, and Support Vector Machines (SVMs) was assembled in Tran et al. (2017) to predict students’ academic performance. The precise predictions of learners’ academic performance at the early stages of the academic programme aids in the identification of the weak students and assist management and teachers in taking the counteractive measures to prevent them from failure. The performance of a Senior High School (SHS) student is a matter of importance because this determines whether the student will get a better grade to further his/her education in a higher learning institution.
|
Table 1 Input Data for ML in Predicting Students’ Academic Performance |
||
|
Reference |
Inputs
variable |
Description |
|
Kieti (2017), Musso et al. (2013) |
Age |
Demographic Data |
|
Chen et
al. (2014), Musso et
al. (2013), Oladokun
et al. (2008) |
Gender |
|
|
Devasia et al. (2016), Goga et al. (2015), Musso et al. (2013), Yadav and Pal (2012), Yusif et al. (2011) |
Father’s occupation and Mother’s
occupation |
|
|
Adejo
and Connolly (2018), Attuquayefio et al. (2014), Tuen et
al. (2019) |
Ethnicity |
|
|
Cortez and Silva (2008), Goga et al. (2015) |
Parents’ marital status |
|
|
Agrawal
and Mavani (2015), Bhardwaj
and Pal (2011), Devasia
et al. (2016), Goga et
al. (2015), Khasanah
and Harwati (2017), Osmanbegović et al. (2014), Osmanbegovic and Suljic (2012), Yadav
and Pal (2012), Yeboah (2014), Yusif et
al. (2011) |
Family size |
|
|
Egbenya and Halm (2016), Fleischer (2015), Mohamed et al. (2016), Oladokun et al. (2008) |
Exam’s score |
Past Exams records |
|
Proposed Model |
Age, Gender, Exam’s score, Ethnicity |
Demographic Data & Past Exams
records |
2. MATERIALS AND METHODS
This study focused is to build an efficient predictive model for final WASSCE score of SHS students’ using random forest algorithm based on their Demographic Data and Past Exams records. The methods, procedures and techniques adopted are organized into the following sections study design, area of the study, the population of the study, sample and sampling technique, instruments for data collection, the validity of the instruments, reliability of the instruments, method of data collection/instrument, and method of data presentation/analysis.
3. PROPOSED CONCEPTUAL FRAMEWORK
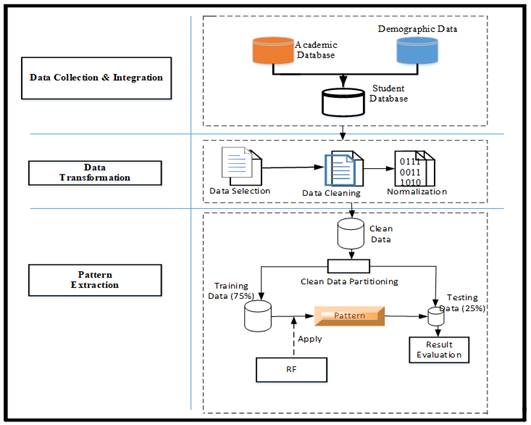
The framework for predicting the academic performance of students’ using the RF algorithm, as shown in Figure 1. The framework illustrates the steps involved in developing models to predict final exams score for SHS final year students. There are three main phases involved in this research which are data-collection, data-integration, data-transformation, and pattern extraction. To apply DM algorithms on any data, it is essential to carry out some data pre-processing tasks such as data-cleaning, integration, discretization, and data-transformation Berhanu (2015).
Data Collection and Integration: 1520 participants from records of student’s offering Business, General Art, Visual Art, Home Economics, and Science, which consisted of both demographic and past academic performance were integrated into one file using SQL database server at this stage as shown in Figure 1.
Data Transformation: At this stage, the integrated data was passed through three distinct stages, (i) data cleaning which includes filling in missing values, smoothing noise, identification, and removing of outliers where necessary and resolving data inconsistency. (ii) Data normalization and aggregation (iii) data reduction, where volumes of data were reduced but produce the same or similar analytical results using feature selection and feature extraction. All data transformation process was carried out with Python. Patterns Extraction: Weka, an open-source data mining program, was used to construct the predictive model using the RF regressor.
Data Partitioning: 1500 out of the 1520 clean data was partitioned into two, thus training dataset (Train_D) which accounted for 75% of the dataset (DS) and the remaining 25% was apportioned for testing (Test_D) the proposed model as shown in figure 3.2. The reaming 20 records were the records of students who are still in school (SHS 3) preparing to write their final WASSCE.
|
|
|
Figure 1 Conceptual Framework |
3.1. DATASET AND STUDY AREA
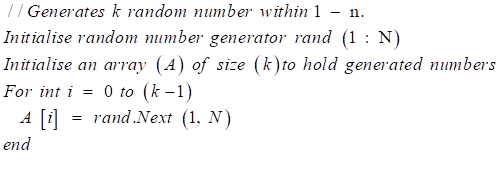
The population (N) for the current study is two thousand four hundred (2,400) students from Sunyani Senior High school, which constitute two thousand past students and four hundred (400) continue students in SHS 3. The study adopted a simple random sampling technique stated in algorithm 1 to select one thousand five hundred (1,500) students (75%) out of 2,000 past students’ records and 5% (20) out of the 400 continue students, making the sample size for the study to be 1520. The 20 continue students were taken to make predictions against the pending 2020 WASSCE exams. The study records consist of student’s continuous assessment for SHS 1 and SHS 2 (6 terms) and demographic data from students offering business, general art, visual arts, science, and home economics courses.
|
Algorithm 1 simple random sampling |
|
1. Make a list of
classes (C) |
|
2. For each |
|
3. Make a list of
all the students (population) (N) in the class |
|
4. Assign a sequential
number to each student (1,2,3…n) in the class |
|
5. Initialize the sample
size (k) for the class |
|
6. Select the sample
(k) of |
|
|
|
7. Associate every
generated number in (A) with its (n) equivalent number and
select the index number of students in |
|
8. Repeat steps 3 to 7
for all |
Training Techniques: The training technique adopted for the current study is a supervised machine learning technique, where the intended input variables (demographic and past terminal exams record) are entered into the network to produce the required output variable (WASSCE score).
The RF is applied to the Train_D and the model learning the pattern hidden in the dataset, we measure the accuracy and error metrics and determine if they are within the accepted values. If they are, then the learned pattern is then applied to the (Test_D) to make a prediction.
Random forest (RF): This is an ensemble-learning technique that integrates the performance of several decision tree algorithms to predict or classify the value of a variable Rodriguez-Galiano et al. (2015), Wakefield, 2013). RF can be used for both classification and regression ML tasks. In the RF technique, many DTs are created, with each observation fed into every single DT. The optimal result in each observation is used as the final output. A different observation is served into all the trees and a majority vote is computed for each classification model. An error estimate is made for the cases, which were not used throughout the tree building. This is known as OOB (Out-of-bag) error estimate, which is stated as a percentage. When an RF receives an input of (x), where x is a vector consisting of variables of different evidential features examined for a given training area, the RF builds several regression trees (N) and averages the results. Therefore, that for N tress {T(x)} ^N the RF regression predictor is given by equation Equation 1.
|
Algorithm 2 Random Forest Algorithm |
|
|
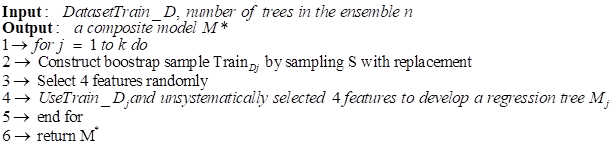
![]() The Bootstrap Aggregating (Bagging) technique was used
in assembling the decision trees for this study. Given a Train_D as
given in equation
The Bootstrap Aggregating (Bagging) technique was used
in assembling the decision trees for this study. Given a Train_D as
given in equation ![]() Equation 2,
the bagging technique generates a New_Di new training dataset of size denoted
by N which is sampled from the original training dataset Train_D with
replacement. New_Di is referred to as the bootstrap sample. By bootstrapping,
some observations may be recurrent in each New_Di. This
approach assists to reduce variance and circumvents overfitting. Users specify
the number of regression trees (T), in the current study, two hundred (200)
trees were specified.
Equation 2,
the bagging technique generates a New_Di new training dataset of size denoted
by N which is sampled from the original training dataset Train_D with
replacement. New_Di is referred to as the bootstrap sample. By bootstrapping,
some observations may be recurrent in each New_Di. This
approach assists to reduce variance and circumvents overfitting. Users specify
the number of regression trees (T), in the current study, two hundred (200)
trees were specified.
Choosing Variables to Split On: grow unpruned regression tree using the steps for each of the bootstrap samples: At the individual node, indiscriminately sample K variables and select the most exceptional split among those variables (K) rather than picking the most excellent split amid all predictors. This practice is sometimes called “feature bagging.” We select a random subset of the predictors or features because the correlation of the trees in a standard bootstrap sample can be reduced. In this study K=p⁄3.
The splitting principle, let assume that a partition is divided into T constituencies R1, R2…, RT. We model the response as a constant ck in each constituency as proposed by Wu et al. (2017) in equation Equation 3. The splitting principle at each node is to minimize the sum of squares. Hence, the best c ̂t_tis the average of yi in region Rt as given in equation Equation 4.
(c_t) ̂=ave (y_i│x_i∈R_t) Equation 4
Let a splitting feature j and split point s, and express the pair of half-planes
![]() Equation
5
Equation
5
Where j and s satisfy equation Equation 6.
When the best split is obtained, the dataset is partitioned into two resulting segments and echo the splitting procedure on each of the two segments. This splitting procedure is reiterated until a predefined ending criterion (threshold) is satisfied, five was set as the threshold for this study.
3.2. EVALUATION METRICS
Several criteria are available for measuring the performance of a predictive model; however, for this study, the following criteria were used: Root means squared error (RMSE): This index evaluation the residual between the actual-value and predicted-value. A model has better performance if it has a smaller RMSE. An RMSE equal to zero represents a perfect fit.
![]() Equation 7
Equation 7
Mean absolute percentage error (MAPE): This index shows an average of the absolute percentage errors, the lower the MAPE, the better.
![]() Equation
8
Equation
8
tv is the actual value, yv is the predicted value produced by the model, and m is the total number of observations. The correlation coefficient (R): This criterion reveals that the strength of associations between actual-values and predicted-values. The correlation coefficient has a range from 0 to 1, and a model with a higher R means it has better performance.
![]() Equation 9
Equation 9
In addition to the mentioned criteria, output accuracy is also used to evaluate the performance of the predictive model.
4. ANALYSIS OF RESULTS AND DISCUSSION
4.1. DEMOGRAPHIC CHARACTERISTICS OF THE STUDENTS
The background data of the students were sought. The data elicited relate to gender, age distribution, and classes/forms. The background data of students formed no part of the principal analysis. The reason for presenting the background data of respondents was to have an idea about the over-all information of students but not for the principal scrutiny. The results are discussed in the form of frequency and percentages as shown in Table 2
|
Table 2 Demographic Features of the Students |
|||
|
Variable |
Sub-scale |
Frequency |
Percentage
(%) |
|
(n = 1520) |
|||
|
Gender |
Male |
670 |
44.07 |
|
Female |
850 |
55.9 |
|
|
Age Distribution |
14 -15 Years |
180 |
11.8 |
|
16 - 18Years |
950 |
62.5 |
|
|
≥19 Years |
390 |
25.7 |
|
Table 2 shows the students’ demographic information. It was observed that out of one thousand five hundred and twenty (1520) students, a majority (n = 850; 55.9%) were females while 670 (44.07%) were males. This outcome shows that the female students were 26% more than their male counterparts were. The majority (n = 950; 55.9%) of the students were within the age group of 16 – 18 years, which confirms the normal age for one to be in SHS, while 180 of them representing 11.8% were found to be in the age group of 14-15 years and 390 representing (25.7%) were found with 19 years or more.
4.2. DESCRIPTIVE STATISTICS
Table 3 shows the statistical analysis of candidate continuous assessment scores. The mean value range (63.67 - 66.36) for all subjects except core maths shows that the end of terms examination mark of the candidates was quite good. However, the minimum score (0) and maximum score (80.02) for core maths indicates that the performance of a candidate in core maths need more improvement. This outcome affirms Ablakwa’s reports that a high percentage of candidate fails in the core maths (Ablakwa, 2014).
Additional statistical analysis was performed on the students’ continuous assessment scores. Table 4 shows a one-sample test of 95% confidence interval. Again, the difference in mean values in students’ continuous assessment shows a close margin in the general performance of students.
|
Table 3 Statistical Analysis of Student Continuous Assessment |
|||||
|
Descriptive Statistics |
|||||
|
N |
Minimum |
Maximum |
Mean |
Std. Deviation |
|
|
CM |
1520 |
0 |
80.02 |
66.2028 |
7.6342 |
|
EG |
1520 |
44.33 |
81.2 |
66.3631 |
7.59182 |
|
IS |
1520 |
46 |
84.25 |
63.672 |
6.46139 |
|
SS |
1520 |
45.5 |
84.75 |
64.8148 |
7.96228 |
|
EL1 |
1520 |
39.17 |
87.6 |
63.8926 |
7.54045 |
|
EL2 |
1520 |
34.17 |
83 |
65.2059 |
6.88485 |
|
EL3 |
1520 |
46.5 |
84.8 |
66.0408 |
6.87008 |
|
EL4 |
1520 |
29.83 |
89.6 |
65.7409 |
7.50126 |
|
Valid N (listwise) |
1520 |
||||
|
Table 4 One-Sample Test |
||||||
|
Test Value = 0 |
||||||
|
95% Confidence
Interval of the Difference |
||||||
|
t |
df |
Sig. (2-tailed) |
Mean diff. |
Lower |
Upper |
|
|
CM |
153.664 |
1520 |
0 |
66.20277 |
65.3551 |
67.0505 |
|
EG |
174.377 |
1520 |
0 |
63.52882 |
62.812 |
64.2456 |
|
IS |
144.143 |
1520 |
0 |
64.62707 |
63.7449 |
65.5092 |
|
SS |
150.192 |
1520 |
0 |
63.70774 |
62.8731 |
64.5423 |
|
EL1 |
166.222 |
1520 |
0 |
65.05242 |
64.2824 |
65.8224 |
|
EL2 |
169.554 |
1520 |
0 |
65.97631 |
65.2107 |
66.7419 |
|
EL3 |
153.81 |
1520 |
0 |
65.6108 |
64.7715 |
66.4501 |
|
EL4 |
168.268 |
1520 |
0 |
65.36828 |
64.6039 |
66.1326 |
4.3. FEATURE IMPORTANCE RANKING
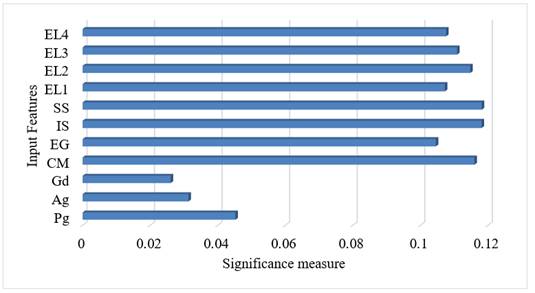
The correlation between each input feature and the expected output (WASSCE score) was tested. Figure 2 shows the feature's importance ranking. The result shows that the demographic data (age and gender) are of less significance. Thus, the gender and age of a candidate do not determine how good or bad he/she will pass the final WASSCE. Again, the program pursued by a candidate also is of less importance to one passing the WASSCE. However, students’ performance in Integrated Science (IS) and Social Studies (SS) were seen to be the most significant determining factor of one passing his/her WASSCE. Furthermore, the results show that the average continuous assessment score of Core Math (CM) by a candidate was also highly related to the candidate success in the final WASSCE. This affirms the reason behind core math being one of the compulsory subjects in all areas of studies.
|
|
|
Figure 2 Features Importance |
4.4. MODEL TRAINING AND TESTING
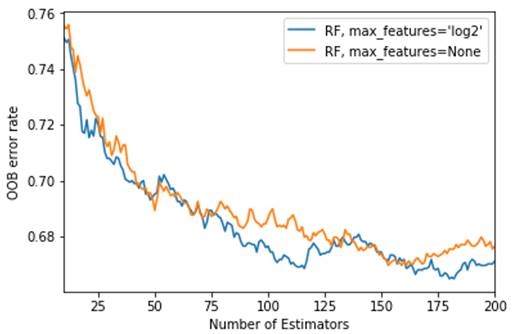
Figure 3 shows the Out-of-bag error rate of the proposed random forest regressor. The aim here was to obtain the right number of estimators that will offer fewer errors. The minimum number of estimators was set to fifteen (15) and the maximum to two hundred (200). The result shows that as the estimators increase in number, the error margin reduces. However, the error increased when the number of estimators increased above one hundred and seventy-five (175). Hence, for this study, the number of estimators was set to one hundred and sixty (160).
|
|
|
Figure 3 Out-of-bag Training Error |
4.5. ACCURACY AND ERROR METRICS
Table 5 shows the error metrics and computational time of the proposed predictive model. With a training dataset of one thousand one hundred and twenty-five (1,125) rows eleven (11) columns, it took the proposed model 0.392 seconds to study all hidden patterns in the dataset. While 0.013 was taken to make predictions on three hundred and seventy-five (375) test data. The RMSE of 0.001639 and the MAE error of 0.001321 achieved by the proposed model show that the proposed model fits very well with the dataset. Again, the obtained error values indicate a close range in model estimated value compared with the actual (true) values and an indication that students’ performance in the WASSCE can be effectively predicted based on student performance in continuous assessment.
|
Table 5 Model error metrics and computational time |
||||
|
RMSE |
MAE |
R^2 |
Training
time |
Testing
Time |
|
0.001639 |
0.001321 |
0.034323 |
0.392 secs |
0.013 secs |
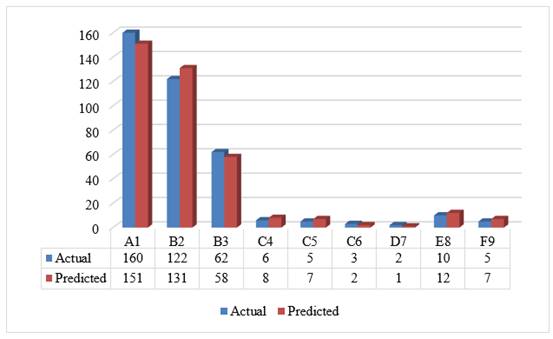
Figure 4 shows the grade analysis based on model prediction against actuals on the test dataset. It was observed that a good number of the students records at least A1 in one or more of the subject grades for the final WASSCE. Also, the closeness of the model predicted to the actual grade confirms the accuracy of the proposed model (see Table 5 and 4.7). Based, on the outcome it can be inferred that a good predictive model can help school authority to ascertain the grade analysis of their students before the WAASCE exams.
|
|
|
Figure 4 Grade analysis of predicted
values |
To further examine the proposed predictive framework, the continuous assessment records of 20 students that are in SHS 3 preparing for the final WASSCE was used to predict the outcome of their exams. Table 6 shows the model predicted values. Since the actual values were not available at the time of this study, there was no means to compare the predicted values for these 20 students to their actual results. However, based on the accuracy record by the model on the test data, it is hoped that the predicted results will not be far from right when these students take their final exams.
|
Table 6 Model predicted values for 20 students yet to write their WASSCE |
||||||||
|
Record |
WCM |
WEG |
WIS |
WSS |
WEL1 |
WEL2 |
WEL3 |
WEL4 |
|
Y' |
Y' |
Y' |
Y' |
Y' |
Y' |
Y' |
Y' |
|
|
1. |
6 |
5 |
5 |
4 |
4 |
4 |
4 |
4 |
|
2. |
4 |
3 |
4 |
3 |
3 |
4 |
4 |
4 |
|
3. |
4 |
4 |
4 |
3 |
4 |
4 |
4 |
5 |
|
4. |
6 |
4 |
5 |
4 |
4 |
4 |
4 |
4 |
|
5. |
5 |
4 |
5 |
4 |
5 |
5 |
4 |
4 |
|
6. |
6 |
5 |
5 |
4 |
4 |
4 |
4 |
4 |
|
7. |
6 |
5 |
6 |
4 |
4 |
4 |
5 |
5 |
|
8. |
3 |
4 |
4 |
3 |
4 |
4 |
4 |
5 |
|
9. |
4 |
4 |
4 |
3 |
4 |
4 |
4 |
4 |
|
10. |
3 |
4 |
4 |
4 |
4 |
5 |
4 |
4 |
|
11. |
4 |
4 |
4 |
3 |
4 |
4 |
4 |
4 |
|
12. |
3 |
4 |
4 |
4 |
3 |
3 |
4 |
3 |
|
13. |
5 |
5 |
5 |
4 |
4 |
4 |
4 |
4 |
|
14. |
5 |
4 |
5 |
4 |
4 |
4 |
4 |
4 |
|
15. |
5 |
4 |
5 |
3 |
4 |
4 |
4 |
4 |
|
16. |
4 |
4 |
5 |
3 |
3 |
4 |
5 |
6 |
|
17. |
4 |
4 |
4 |
3 |
4 |
4 |
4 |
5 |
|
18. |
4 |
4 |
4 |
3 |
4 |
4 |
4 |
4 |
|
19. |
4 |
4 |
4 |
3 |
4 |
4 |
4 |
4 |
|
20. |
5 |
4 |
5 |
4 |
4 |
4 |
4 |
4 |
4.6. COMPARISON ANALYSIS OF RESULTS WITH RELATED WORKS
Table 7 shows a comparative analysis of the current study with related works. Pandey and Taruna (2016) obtained an accuracy of (86.76 – 98.86) % with 1000 respondents, Guo et al. (2015) an accuracy (63.2 – 88.4) % with 120000 participants. The results as shown in Table 7, indicates that the prediction accuracy (89.4%) with 1000 participant outperformed other state-of-the-art students on student’s academic performance. This comparative analysis shows that there has been an enhancement in the current study to existing literature and a confirmation that the academic performance of students can effectively be predicted with a high accuracy rate.
|
Table 7 A comparative analysis of study results with related works |
|||||
|
References |
Predicted
variable |
Sample
size |
ML
algorithm |
Evaluation
metrics. |
|
|
Accuracy |
RMSE |
||||
|
Purwaningsih et al. (2018) |
English score in WASSCE |
72 |
Naïve Bayes |
35-86% |
Not Available |
|
Bosson-Amedenu (2017) |
Core Mathematics score in WASSCE |
42 |
Linear regression |
90 – 92 % |
Not Available |
|
Ahmed
and Ibrahim (2014) |
Not Stated |
1547 |
Decision tree (ID3) |
Not Available |
Not Available |
|
Pandey and Taruna (2016) |
Not Stated |
1000 |
Decision Tree, K-Nearest Neighbour, and
Aggregating One-Dependence Estimators (AODE) |
86.76 – 98.86 % |
Not Available |
|
Livieris
et al. (2016) |
Mathematics |
279 |
Decision trees, Support vector machine
and Sequential Minimal Optimization (SMO) algorithm |
51.6 – 70.3 % |
Not Available |
|
Li et al. (2013) |
Not stated |
90 |
Principal Component Analysis |
Not Available |
Not Available |
|
Musso et
al. (2013) |
Psychology, engineering, medicine, law,
social communication, business, and marketing |
786 |
Artificial Neural Networks |
87 – 100% |
Not Available |
|
Guo et al. (2015) |
Not stated |
120,000 |
Deep neural networks |
63.2 – 88.4% |
Not Available |
|
Osmanbegovic and Suljic (2012) |
257 |
Naive Bayes algorithm, Multilayer
Perceptron and Decision tree |
71.2 –76.65% |
0.42 – 0.5 |
|
|
Osmanbegović et
al. (2014) |
Not stated |
1410 |
Random Forest and Decision Trees (J48) |
71% |
Not Available |
|
Berhanu
(2015) |
Not stated |
199 |
Decision trees |
84.95% |
Not Available |
|
Tran et al. (2017) |
Not stated |
1268 |
ANN, DT and Support Vector Machines
(SVMs) |
Not Available |
1.668 |
|
Current study (Adjei 2020) |
General Science Business Home Economics Visual Arts General Arts |
1,520 |
Random Forest |
89.40% |
0.001639 |
5. CONCLUSIONS AND RECOMMENDATIONS
The study aimed at investigating the factors that affect student academic performance in the WASSCE. It also attempted to predict the final students' score in the WASSCE based on student’s continuous assessment using the random forest algorithm. The considered factors were demographic factors such as age and gender, and continuous assessment score. Descriptive statistical (frequency and percentages, means, and standard deviation) and T-Test methods were used to analyse the details of one thousand (1000) randomly sampled students’ records from the Education Database (ED). The study found that the demographic data (gender and age) has no effects on the performance of students in the WASSCE. A high correlation was found between Integrated Science (SI) and Social Studies (SS), and the performance of students in the WASSCE. The study found that students that score within (40-55) in core maths were likely not to perform well in the final WASSCE. The performance of students in the WASSCE is highly predictable at an accuracy of 89.4%.
ACKNOWLEDGEMENTS
People who contributed to the work but do not fit criteria for authorship should be listed in the Acknowledgments, along with their contributions. It is advised that authors ensure that anyone named in the acknowledgments agrees to being so named. Funding sources that have supported the work should also be cited.
REFERENCES
Adejo, O. W., & Connolly, T. (2018). Predicting Student Academic Performance Using Multi-Model Heterogeneous Ensemble Approach. Journal Of Applied Research In Higher Education, 10(1), 61-75. Retrieved from https://doi.org/10.1108/JARHE-09-2017-0113
Agrawal, H., & Mavani, H. (2015). Student Performance Prediction Using Machine Learning. 4(03), 111-113. Retrieved from https://doi.org/10.17577/IJERTV4IS030127
Ahmed, A. B. E. D., & Ibrahim, S. E. (2014). Data Mining : A Prediction For Student's Performance Using Classification Method. World Journal Of Computer Application And Technology, 2(2), 43-47. Retrieved from https://doi.org/10.13189/wjcat.2014.020203
Analyticsvidhya.Com. (2010). Random Forest Algorithm. Retrieved from Https://Www.Google.Com/Imgres?Imgurl=Https%3A%2F%2Fwww.Analyticsvidhya.Com%2Fwp-Content%2Fuploads%2F2015%2F06%2Frandom-Forest7.Png&Imgrefurl=Https%3A%2F%2Fwww.Analyticsvidhya.Com%2Fblog%2F2015%2F06%2Ftuning-Random-Forest-Model%2F&Tbnid=Bldygobmf_Oqom&Vet=12ahukewibtpbop-_Qahvtlkqkhbfndnuqmygieguiarc3aq.I&Docid=Gp-
Attuquayefio, Niiboi, S., & Addo, H. (2014). Using The UTAUT Model To Analyze Students' ICT Adoption. International Journal Of Education & Development Using Information & Communication Technology, 10(3), 75-86. Retrieved from Http://Ezproxy.Usq.Edu.Au/Login?Url=Http://Search.Ebscohost.Com/Login.Aspx?Direct=True&Db=Ehh&AN=97923459&Site=Ehost-Live
Berhanu, F. (2015). Students ' Performance Prediction Based On Their Academic Record. International Journal Of Computer Applications, 131(5), 27-35. Retrieved from https://doi.org/10.5120/ijca2015907348
Bhardwaj, B. K., & Pal, S. (2011). Data Mining : A Prediction For Performance Improvement Using Classification. International Journal Of Computer Science And Information Security, 9(4), 136-140.
Bosson-Amedenu, S. (2017). Predictive Validity Of Mathematics Mock Examination Results Of Senior And Junior High School Students' Performance In WASSCE And BECE In Ghana. Asian Research Journal Of Mathematics, 3(4), 1-8. Retrieved from https://doi.org/10.9734/ARJOM/2017/32328
Chen, J.-F., Hsieh, H.-N., & Quang, H. Do. (2014). Predicting Student Academic Performance : A Comparison Of Two Meta-Heuristic Algorithms Inspired By Cuckoo Birds For Training Neural Networks. Algorithms, 7(4), 538-553. Retrieved from https://doi.org/10.3390/a7040538
Cortez, P., & Silva, A. (2008). Using Data Mining To Predict Secondary School Student Performance. 5th Annual Future Business Technology Conference, 2003(2000), 5-12. Retrieved from Https://Doi.Org/10.13140/RG.2.1.1465.8328
Devasia, T., Vinushree, T. P., & Hegde, V. (2016). Prediction Of Students Performance Using Educational Data Mining. En 16. Retrieved from https://doi.org/10.1109/SAPIENCE.2016.7684167
Egbenya, G. R. K., & Halm, E. (2016). A Comparative Study Of Students ' Performance For The Three Year And The Four Year Programmes In Mfantsipim And University Of Cape Coast, Practice Senior High Schools In Cape Coast , Ghana. Internal Journal Of Innovative Reserach & Development, 5(3), 114-129.
Fleischer, J. E. (2015). Information Communication Technology Usage Patterns In Second Cycle Schools : A Study Of Two Selected Senior High Schools In Ghana (Issue 10232161).
Goga, M., Kuyoro, S., & Goga, N. (2015). A Recommender For Improving The Student Academic Performance. Procedia - Social And Behavioral Sciences, 180(November 2014), 1481-1488. Retrieved from https://doi.org/10.1016/j.sbspro.2015.02.296
Guo, B., Zhang, R., Xu, G., Shi, C., & Yang, L. (2015). Predicting Students Performance In Educational Data Mining. 2015 International Symposium On Educational Technology (ISET), 125-128. Retrieved from https://doi.org/10.1109/ISET.2015.33
Hedén, W. (2016). Predicting Hourly Residential Energy Consumption Using Random Forest And Support Vector Regression An Analysis Of The Impact Of Household Clustering On The Performance Accuracy. KTH Royal Institute Of Technology.
Khasanah, A. U., & Harwati. (2017). A Comparative Study To Predict Student's Performance Using Educational Data Mining Techniques. IOP Conference Series: Materials Science And Engineering, 215(1). Retrieved from https://doi.org/10.1088/1757-899X/215/1/012036
Kieti, J. M. (2017). An Investigation Into Factors Influencing Students' Academic Performance In Public Secondary Schools In Matungulu Sub-County, Machakos County. In South Eastern Kenya University. Retrieved from https://doi.org/10.1111/j.1469-7610.2010.02280.x
Kumar, M., & Thenmozhi, M. (2006). Forecasting Stock Index Movement: A Comparison Of Support Vector Machines And Random Forest. Indian Institute Of Capital Markets 9th Capital Markets Conference Paper, 1-16. Retrieved from https://doi.org/10.2139/ssrn.876544
Leo, B., & Adele, C. (2002). Random Forests. Retrieved from Https://Www.Stat.Berkeley.Edu/~Breiman/Randomforests/Cc_Home.Htm
Li, K. F., Rusk, D., & Song, F. (2013). Predicting Student Academic Performance. 2013 Seventh International Conference On Complex, Intelligent, And Software Intensive Systems, 27-33. Retrieved from https://doi.org/10.1109/CISIS.2013.15
Livieris, I. E., Tassos, A. M., & Panagiotis, P. (2016). A Decision Support System For Predicting Student Performance. International Journal Of Innovative Research In Computer And Communication Engineering, 02(12), 7232-7237. Retrieved from https://doi.org/10.15680/IJIRCCE.2014.0212015
Mahbina, A. M., & Zamil, K. M. S. (2018). GIS-Based Analysis Of Changing Surface Water In Rajshahi City Corporation Area Using Support Vector Machine (SVM), Decision Tree & Random Forest Technique. Machine Learning Research, 3(2), 11-17. Retrieved from https://doi.org/10.11648/j.mlr.20180302.11
Mohamed, A., Rizaner, A., & Hakan, A. (2016). Using Data Mining To Predict Instructor Performance. Procedia - Procedia Computer Science, 102(August), 137-142. Retrieved from https://doi.org/10.1016/j.procs.2016.09.380
Musso, M. F., Kyndt, E., Cascallar, E. C., & Dochy, F. (2013). Predicting General Academic Performance And Identifying The Differential Contribution Of Participating Variables Using Artificial Neural Networks. Frontline Learning Research, 1(1), 42-71. Retrieved from https://doi.org/10.14786/flr.v1i1.13
Nti, I. K., Adekoya, A. F., & Weyori, B. A. (2020). A Comprehensive Evaluation Of Ensemble Learning For Stock-Market Prediction. Journal Of Big Data, 7(1). Retrieved from https://doi.org/10.1186/s40537-020-00299-5
Oladokun, V. O., Adebanjo, A. T., & Charles-Owaba, O. E. (2008). Predicting Students' Academic Performance Using Artificial Neural Network : A Case Study Of An Engineering Course. The Pacific Journal Of Science And Technology, 9(1), 72-79.
Osmanbegovic, E., & Suljic, M. (2012). Data Mining Approach For Predicting Student Performance. Journal Of Economics And Business, X (1), 3-12.
Osmanbegović, E., Suljić, M., & Agić, H. (2014). Determining Dominant Factor For Students Performance Prediction By Using Data Mining. Vitez-Tuzla-Zagreb-Beograd-Bucharest, XVII (34), 147-158.
Pandey, M., & Taruna, S. (2016). Towards The Integration Of Multiple Classifier Pertaining To The Student ' S Performance Prediction. Perspectives In Science, 8, 364-366. Retrieved from https://doi.org/10.1016/j.pisc.2016.04.076
Purwaningsih, N., Arief, D. R., Purwaningsih, N., & Arief, D. R. (2018). Predicting Students ' Performance In English Class. AIP, 020020. Retrieved from https://doi.org/10.1063/1.5042876
Rajesh, S. B. (2018). Introduction To Decision Trees. Https://Medium.Com/Greyatom/Decision-Trees-A-Simple-Way-To-Visualize-A-Decision-Dc506a403aeb#:~:Text=A Decision Tree Is A Flowchart-Like Structure In Which,Taken After Computing All Attributes).
Rodriguez-Galiano, V., Sanchez-Castillo, M., Chica-Olmo, M., & Chica-Rivas, M. (2015). Machine Learning Predictive Models For Mineral Prospectivity: An Evaluation Of Neural Networks, Random Forest, Regression Trees And Support Vector Machines. Ore Geology Reviews, 71, 804-818. Retrieved from https://doi.org/10.1016/j.oregeorev.2015.01.001
Tan, Z., Yan, Z., & Zhu, G. (2019). Stock Selection With Random Forest : An Exploitation Of Excess Return In The Chinese Stock Market. Heliyon, 5(8), E02310. Retrieved from https://doi.org/10.1016/j.heliyon.2019.e02310
Tran, T., Dang, H., Dinh, V., Truong, T.-M.-N., Vuong, T., & Phan, X. (2017). Performance Prediction For Students : A Multi-Strategy Approach. CYBERNETICS AND INFORMATION TECHNOLOGIES, 17(2), 164-182. Retrieved from https://doi.org/10.1515/cait-2017-0024
Tuen, W., Leung, V., Yee, T., Pan, W., Wu, C., Lung, S. C., & Spengler, J. D. (2019). Landscape And Urban Planning How Is Environmental Greenness Related To Students ' Academic Performance In English And Mathematics ? Landscape And Urban Planning, 181(1), 118-124. Retrieved from https://doi.org/10.1016/j.landurbplan.2018.09.021
Wu, D., Jennings, C., Terpenny, J., Gao, R. X., & Kumara, S. (2017). A Comparative Study On Machine Learning Algorithms For Smart Manufacturing: Tool Wear Prediction Using Random Forests. Journal Of Manufacturing Science And Engineering, 139(7), 071018. Retrieved from https://doi.org/10.1115/1.4036350
Yadav, S. K., & Pal, S. (2012). Data Mining : A Prediction For Performance Improvement Of Engineering Students Using Classification. World Of Computer Science And Information Technology Journal WCSIT, 2(2), 51-56. Retrieved from https://doi.org/10.1142/9789812771728_0012
Yeboah, Y. K. (2014). Investigating The Low Performance Of Students' English In The Basic Education Certificate Examination In The Sunyani Municipality (Issue 10357198) [UNIVERSITY OF GHANA, LEGON]. Retrieved from https://doi.org/10.1038/253004b0
Yusif, H. M., Yussof, I., & Noor, A. H. S. M. (2011). Determinants Of Students Academic Perform- Ance In Senior High Schools : A Binary Logit Approach. 31(3), 107-117. Retrieved from https://doi.org/10.4314/just.v31i3.12
|
|
 This work is licensed under a: Creative Commons Attribution 4.0 International License
© IJETMR 2014-2022. All Rights Reserved.