
|
|
|
|
EFFECTS OF DREDGING ON DOWNSTREAM WATER QUALITY: EKOLE CREEK, NIGERIAOpololaoluwa Oladimarum Ijaola 1 1 Department of Civil Engineering, Faculty of Engineering, Federal University Otuoke, Otuoke, Bayelsa State, Nigeria. |
|
||
|
|
|||
|
Received 12 November 2021 Accepted 1 December 2021 Published 22 December 2021 Corresponding Author Opololaoluwa
Oladimarum Ijaola, opololaoluwaijaola121@gmail.com DOI 10.29121/ijetmr.v8.i12.2021.1078 Funding:
This
research received no specific grant from any funding agency in the public,
commercial, or not-for-profit sectors. Copyright:
© 2021
The Author(s). This is an open access article distributed under the terms of
the Creative Commons Attribution License, which permits unrestricted use, distribution,
and reproduction in any medium, provided the original author and source are
credited.
|
ABSTRACT |
|
|
|
Water is essential part of ecosystem, so its quality must be ascertained for use especially in Ekole creek of Nigeria where dredging activities is heavy, hence this study examined the dredging effect on the downstream water quality of Ekole creek. Water samples were collected from four points which are; Upstream, Dredge I, Dredge II, and Downstream points. The parameters of the water quality determined showed that Turbidity and Total Suspended Solids (TSS) were higher at the Downstream point with values of 31 NTU and 1664 mg/l respectively; pH was also slightly acidic (6.61); but low in Total Dissolve Solid (TDS), Electrical Conductivity, Nitrate (NO3) and Dissolved Oxygen (DO), as compare to the Upstream. The values of the heavy metals like Pb (3.845 mg/l), Cr (0.612 mg/l) Ni (0.104 mg/l) and Cu (0.128 mg/l), at Downstream point, were above Pb (3.0605 mg/l), Cr (0.0 mg/l), Ni (0.017 mg/l) and Cu (0.102 mg/l) of the Upstream point, before the Dredging points I and II, that have correlative matrix of(Pb>Fe>Mn>Zn>Cu>Ni>Cr) and Pb>Fe>Cr>Mn>Zn>Cu>Ni Downstream point. Is discovered the Downstream water is slightly acidic, high in Turbidity and TSS, but low in TDS, EC, NO3 and DO, as against the WHO drinking-water quality, due the effect of dredging on the water quality of the Ekole Creek. It is inferred that the dredging activities have negative effects on the water quality, which can be hazardous to the health of downstream user, and distort the ecosystem; therefore the commercial dredging activities should be checked in Ekole creek. |
|
||
|
Keywords: Dredging, Downstream, Upstream, Water Quality, Turbidity, Ekole Creek 1. INTRODUCTION Water as an inevitable
factor of ecosystem functionality, its importance for human existence cannot
be over emphasized. The demand for water is increasing due to its importance.
The Water quality is important in healthy ecosystem, that is clean water
supports the wellbeing and productivities of plants, animal and human race. Reddeppna (2001) opined that the
demand for it will continue to increase because of the economic activities
and the desire for better standard of living. One of the sources of water
which is river is prominent because of the economic activities that take
place in it, such activities as; farming/ fishing, recreation,
transportation, waste disposal, floating filling stations and dredging. |
|
||


Dredging is an underwater exaction re-channel in order to improve navigation or for commercial functions (Iyama and Edori (2014), Jones (1986)), likewise Iyama (2005), added that it is the removal of bed materials and vegetation from a river channel. The deposition of dredged materials in uniform layers over wet land vegetation or open bay bottom occurred in dredging (Iyama and Edori (2014), Turner and Streever (2002)). According to Nick and Marsha (2010), the basic reasons for dredging are; navigation, reclamation, beach nourishment, environmental remediation, flood control, mining for precious stone. However, the intensity of dredging depends on the purpose, the purpose for the study area that is Ekole Creek, basically commercial that is, to get sand from the river for commercial purpose, which has intensified the rate of dredging to make as much profit as possible so long as they are not checked, thereby reducing the environment to the position of an undeserved victim. The operations have created tremendous adverse effect on both the downstream users as well as host communities in terms of ecosystem safety and biota disturbance through heavy metals re-suspension. Depending upon the nature of the dredged material, its disturbance from the sea bed may lead to changes in the Physical and the chemical composition of the water (Seiyaboh et al. (2013))
Since the physical and chemical qualities of the downstream water is affected by dredging, there is need to the determine the physicochemical properties of the downstream of Ekole river where dredging activities is heavy and may cause some adverse effects on downstream users because it concerns re-suspension of bottom sediments where there may be contaminants that may possibly pollute the water column. Therefore, the water quality may have effect on both the aquatic life and the surrounding ecosystem. it must then, be determined through physical properties which includes temperature and turbidity and chemical characteristic which includes pH and dissolved oxygen Fondriest Environmental Leaning Centre, Water Quality (2021) (www.fondriest.com, 2021). Narayanan (2009), also ascertained that the chemical parameters for determination of water quality are solutes, salinity and hardness, pH, Dissolved Oxygen (DO), Boichemical Oxygen Demand (BOD) and Chemical Oxygen Demand (COD), but this study will deal with pH, DO, Total Suspended Solids (TSS) and Total Dissolve Solid (TDS) and heavy metals.
Ekole Creek, Nun River in Yenagoa Local Government Area of Bayelsa State, stems from River Niger in Nigeria. some of the communities that depend on it within two kilometers distance upstream and downstream are; Famgbe, Obogoro, Yenagoa, Akaba, Swali, Ogu, Agbura, Otuokpoti, Onuebum, Otuedu and Otuogori. It is located between latitudes 4°49’N and 5°23'N and also within longitudes 6°10' E and 6°33'E (Koinyan et al. 2013). This work is to determine quality of water through the observation of levels of physicochemical parameters during dredging activities and its effects on downstream.
2. MATERIALS AND METHODS
2.1. The Study Area
The study area is Yenagoa Local Government Area (LGA) in Bayelsa State of Nigeria as seen in Figure 1. Yenagoa LGA is geographically located within latitudes 4°49’N and 5°23'N and also within longitudes 6°10' E and 6°33'E (Koinyan et al. 2013). Yenagoa City is the capital of Bayelsa State and Yenagoa LGA dense population in the State. Other communities like Agbura, Ekolo, Otuokpoti, Ikasikara, Otuegwe ,Otuogori etc within the study area.
|
|
|
Figure 1 Map of Study Area Showing
Bayelsa State and Sampling Locations |
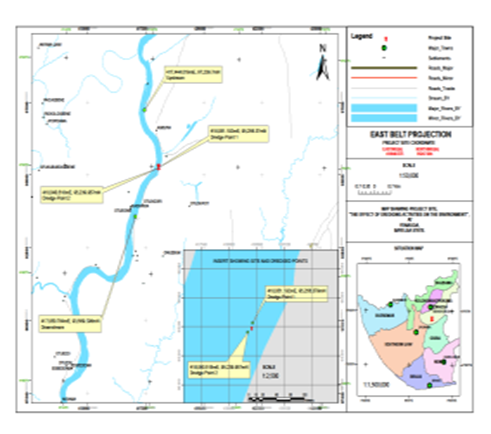
2.2. Description of Sampling Locations
Within the study area four sampling points were taken. Two on-going dredging sites were located about 200 m apart and were labeled “Dredge point I and Dredge point II”. Two more sampling points were taken at about two kilometers (2 km) away from the dredge sites and were titled “upstream and downstream”. The upstream point was 2,081.89 m from Dredge point I which was used as the control point where no dredging was noticed, while the downstream point was 1,952.25 m from Dredge point II which acted as the effect monitoring point. At all these four sampling locations, the sampled water was taken laboratory for analysis. A total of eight samples were taken into plastic containers previously rinsed with the water sample itself and placed in coolers and sent same day to specialized water and sediments testing laboratory.
2.3. Geographical Positioning of Sampling Locations
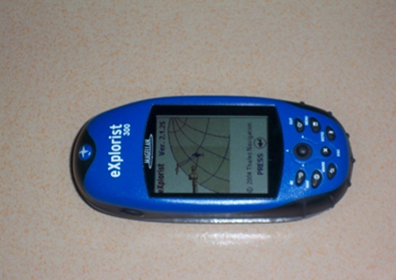
Global positioning system (GPS) was applied to obtain the geographical coordinates of the sampling locations. Positions at each sampling station during the fieldwork activities were achieved with the aid of a Magellan global positioning system, using Model Explorist 300 hand held GPS. At each sampling location, coordinates at which sampling actually took place were marked and transferred into the field note book. Geographical coordinates in Minna East Belt (CRS), Coordinates converted to World Global positioning system (WGS84) and Sampling Location Names are presented in Table 1 below.
|
|
|
Figure 2 Explorist
300 Hand Held GPS |
|
Table 1 Geographical
Coordinates of the Study Area |
|||||
|
S/N |
Location Name |
Coordinates
Reference System (CRS) Nigeria Minna, East Belt |
Sample
Coordinates Converted to WGS84 (Lat, Long) |
||
|
|
|
Easting (m) |
Northing (m) |
Lat |
Long |
|
1 |
Dredge Point I |
417444.019 |
97239.783 |
6°
15' 47.8" |
4°
51' 04.7" |
|
2 |
Dredge Point II |
418051.192 |
95256.379 |
6°
16' 07.9" |
4°
50' 00.7" |
|
3 |
Upstream (Control Point) |
418040.518 |
95239.957 |
6°
16' 07.6" |
4°
50' 00.2" |
|
4 |
Downstream (Effect monitoring point) |
417050.784 |
93569.596 |
6°
15' 36.2" |
4°
49' 05.8" |
2.4. Analysis of Physicochemical Parameters
Physicochemical perimeters analyzed in the study of downstream water quality from Ekole Creek, Nun River include: Turbidity, pH, Conductivity, Total Suspended Solids (TSS), Total Dissolved Solids (TDS), Dissolved Oxygen (DO), Nitrate, Phosphate, Lead, Iron, Copper, Manganese, Nickel, Chromium and Zinc, the methods used to determine the parameter as reported Edith et al. (2017). But for the turbidity which is described as follows: the turbidity of the samples was measured in the laboratory using the LABTECH DIGITAL Turbidimeter. The values were read out directly in Nephelometric Units (NTU) after the instrument had been standardized using already prepared standards.
3. RESULTS AND DISCUSSION
Results of analysis of water samples collected from the study locations in Ekole Creek, are presented in Table 2 and their correlations are also presented in Table 3.
3.1. Physicochemical parameters in Water Quality
The water quality at the four sampling points as seen in Table 2 showed that before dredging activities (Upstream), the water had a pH of 7.39, which was slightly alkaline, but Downstream is 6.61 which was slightly acidic after the dredging activities, and values between Dredge points I and II is slightly acidic but varied. In Table 2, the values of parameters like: Turbidity and TSS, followed the same trend; the values were low at Upstream, and high at the Downstream, even at Dredge I and Dredge II but not in an increasing order from sampling point 1-4. For instance, Turbidity increased from 3 NTU at Upstream, 11NTU at Dredge point I to 34 NTU at Dredge point II, and 31 NTU at Downstream. While the parameters like TDS, EC, NO3 and DO followed the same trend, their values were high at Upstream and low at Downstream. TSS and phosphate however showed sharp increase at Dredge point I (3665 and 1.2852 mg/l) and dropped at Dredge point II (1861 and 0.9846 mg/l). Heavy metals like; Chromium (Cr), Zinc (Zn) Nickel (Ni), Copper (Cu), Manganese (Mn), and Lead (Pb) were generally low at Upstream and high at Downstream, while Fe showed a decrease from 2.75 mg/l at the Upstream to 0.8 mg/l and 0.9 mg/l at Dredge points I and II. Pb was highest among heavy metals which showed highest value at Dredge point I (5.3105 mg/l) and dropped to 2.836 mg/l at Dredge point II.
|
Table 2 Variation of Water Quality of Ekole Creek |
||||
|
Water Quality Parameters |
Upstream |
Dredge 1 |
Dredge ll |
Downstream |
|
PHYSICO-CHEMICAL |
||||
|
Turbidity (NTU) |
3 |
11 |
34 |
31 |
|
pH |
7.39 |
6.21 |
6.62 |
6.61 |
|
Total Dissolved Solids (mg/l) |
41 |
35 |
38 |
36 |
|
Total Suspended Solids (mg/l) |
259 |
3665 |
1881 |
1664 |
|
Electrical Conductivity (µS) |
63 |
54 |
60 |
55 |
|
Nitrate (mg/l) |
0.4209 |
1.8606 |
1.9935 |
0.9746 |
|
Phosphate (mg/l) |
0.3366 |
1.2852 |
0.9846 |
0.4896 |
|
Dissolved Oxygen (mg/l) |
22 |
9.4 |
21 |
18.8 |
|
Total Iron (mg/l) |
2.75 |
0.8 |
0.9 |
1.65 |
|
Lead (mg/l) |
3.0605 |
5.3105 |
2.836 |
3.845 |
|
Chromium (mg/l) |
0 |
0.718 |
0.864 |
0.612 |
|
Manganese (mg/l) |
0.45 |
0.552 |
0.502 |
0.38 |
|
Nickel (mg/l) |
0.017 |
0.217 |
0.16 |
0.104 |
|
Zinc (mg/l) |
0.2157 |
0.3614 |
0.4824 |
0.2017 |
|
Copper (mg/l) |
0.102 |
0.21 |
0.193 |
0.128 |
The result indicates that the water at the Downstream is slightly acidic, it is high in Turbidity and TDS, and but low in TDS, EC, NO3 and DO as compare to the Upstream. This shows the effect of dredging on the water quality of the Ekole Creek. At about 2 km downstream of the dredged points, the creek’s self-purification was not complete because the water quality could not get back to its upstream value before dredging. The acidity of water in downstream can be traced to re-introduction of minerals from bottom sediments as a result of dredging activities; this is in agreement with Warren (1981) who asserts that acid is formed when chemicals in the bottom sediments combine with the water in the creek. The low level of DO at downstream is due to re-suspension of sediments that have used up part of the DO. Nitrates and Phosphates were generally low, because the agricultural sources waste and sewage disposal did not influence the concentrations of Nitrate and Phosphate at downstream, since dredging causes dilution of solute in creek as agreed by Garg (2010). Both Fe and Pb exceeded their maximum allowable limits at the downstream point of the creek for potable water, the accumulation of which may lead to metal poisoning which hazardous to the health of downstream user. The increase indicates; river traffic density, leaded petrol was used in the environment which gets into the water, atmosphere, trapped on leaves at the banks of the creek or even directly released into water column (Odukoya et al. (2002)). The presence of river transportation in the study area (Ekole creek) gave rise to many floating petrol filling stations, boat ducks and workshops, dumping of waste, agricultural activities at the banks of the river, fishing and sand dredging activities that are responsible for the re-suspension of pollutants absorbed or adsorbed in bottom sediments. These may have contributed to the high levels of some specific parameters (Turbidity, TSS, TDS, EC, Nitrate, Phosphate, Fe, Pb, Cr, Mn, Ni, Zn and Cu).
3.2. CORRELATIVE MATRIX OF PHYSICO-CHEMICAL PARAMETERS OF WATER QUALITY
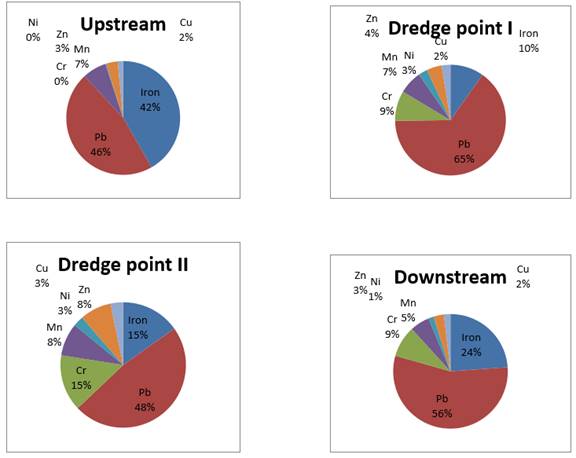
In Table 3, comparative analysis of physicochemical parameters can be drawn; the general results of correlation water quality at sample collection points varied. An increased pH number in the water samples, causes a decrease in the concentrations of heavy metals, the increase in pH of the sediments resulted in increased levels of heavy metals at the four sampling stations. The relative abundance of the metals in the water at the various sampling points showed the following pattern: Upstream (Pb>Fe>Mn>Zn>Cu>Ni>Cr); Dredge point I (Pb>Fe>Cr>Mn>Zn>Ni>Cu); Dredge point II (Pb>Fe>Cr>Mn>Zn>Cu>Ni); Downstream (Pb>Fe>Cr>Mn>Zn>Cu>Ni). The pictorial representation is seen in Figure 3. Pb concentrations were obviously high and most abundant of all the heavy metals at all sampling locations. It is possible that much of Pb containing materials (e.g petroleum products) are released into the creek. This includes petroleum products from transportation activities and floating petrol filling stations that have contributed it in the study area.
|
Table 3: Correlation (r) Matrix between the
Physico-chemical Parameters in Water of Ekole Creek |
|||||||||||||||
|
|
Turbidity |
pH |
TDS |
TSS |
EC |
Nitrate |
Phosphate |
DO |
Fe |
Pb |
Cr |
Mn |
Ni |
Zn |
Cu |
|
Turbidity |
1.0 |
-0.4207 |
-0.3872 |
0.1392 |
-0.2804 |
0.4732 |
0.1333 |
0.2296 |
-0.5303 |
-0.2769 |
0.7488 |
-0.2811 |
0.3274 |
0.3930 |
0.2755 |
|
pH |
-0.4207 |
1.0 |
0.9536 |
-0.9530 |
0.8790 |
-0.8211 |
-0.8366 |
0.7824 |
0.9297 |
-0.7103 |
-0.8755 |
-0.4450 |
-0.9550 |
-0.4806 |
-0.8420 |
|
TDS |
-0.3872 |
0.9536 |
1.0 |
-0.8854 |
0.980 |
-0.6146 |
-0.6536 |
0.7834 |
0.7835 |
-0.7787 |
-0.7563 |
-0.2123 |
-0.8263 |
-0.1992 |
-0.6443 |
|
TSS |
0.1392 |
-0.9530 |
-0.8854 |
1.0 |
-0.8227 |
0.7932 |
0.9124 |
-0.9147 |
-0.8728 |
0.8317 |
0.7356 |
0.6408 |
0.9602 |
0.4763 |
0.8768 |
|
EC |
-0.2804 |
0.8790 |
0.980 |
-0.8227 |
1.0 |
-0.4497 |
-0.5294 |
0.7915 |
0.6457 |
-0.8289 |
-0.6162 |
-0.1004 |
-0.7144 |
-0.0044 |
-0.6827 |
|
Nitrate |
0.4732 |
-0.8211 |
-0.6146 |
0.7932 |
-0.4497 |
1.0 |
0.9249 |
-0.5045 |
-0.9702 |
0.3254 |
0.9107 |
0.6974 |
0.9303 |
0.8951 |
0.9737 |
|
Phosphate |
0.1333 |
-0.8366 |
-0.6536 |
0.9124 |
-0.5294 |
0.9249 |
1.0 |
-0.7574 |
-0.9055 |
0.5973 |
0.7494 |
0.8567 |
0.9589 |
0.7702 |
0.9873 |
|
DO |
0.2296 |
0.7824 |
0.7834 |
-0.9147 |
0.7915 |
-0.5045 |
-0.7574 |
1.0 |
0.6018 |
-0.9748 |
-0.4044 |
-0.5983 |
-0.7713 |
-0.1677 |
-0.6630 |
|
Fe |
-0.5303 |
0.9297 |
0.7835 |
-0.8728 |
0.6457 |
-0.9702 |
-0.9055 |
0.6018 |
1.0 |
0.4609 |
-0.9587 |
-0.5795 |
-0.9707 |
-0.7642 |
-0.9478 |
|
Pb |
-0.2769 |
-0.7103 |
-0.7787 |
0.8317 |
-0.8289 |
0.3254 |
0.5973 |
-0.9748 |
0.4609 |
1.0 |
0.2826 |
0.4207 |
0.6435 |
-0.0514 |
0.4910 |
|
Cr |
0.7488 |
-0.8755 |
-0.7563 |
0.7356 |
-0.6162 |
0.9107 |
0.7494 |
-0.4044 |
-0.9587 |
0.2826 |
1.0 |
0.3487 |
0.8701 |
0.7133 |
0.8286 |
|
Mn |
-0.2811 |
-0.4450 |
-0.2123 |
0.6408 |
-0.1004 |
0.6974 |
0.8567 |
-0.5983 |
-0.5795 |
0.4207 |
0.3487 |
1.0 |
0.6758 |
0.7283 |
0.8091 |
|
Ni |
0.3274 |
-0.9550 |
-0.8263 |
0.9602 |
-0.7144 |
0.9303 |
0.9589 |
-0.7713 |
-0.9707 |
0.6435 |
0.8701 |
0.6758 |
1.0 |
0.6844 |
0.9630 |
|
Zn |
0.3930 |
-0.4806 |
-0.1992 |
0.4763 |
-0.0044 |
0.8951 |
0.7702 |
-0.1677 |
-0.7642 |
-0.0514 |
0.7133 |
0.7283 |
0.6844 |
1.0 |
0.8397 |
|
Cu |
0.2755 |
-0.8420 |
-0.6443 |
0.8768 |
-0.6827 |
0.9737 |
0.9873 |
-0.6630 |
-0.9478 |
0.4910 |
0.8286 |
0.8091 |
0.9630 |
0.8397 |
1.0 |
|
|
|
Figure 3 Relative Abundance of Heavy
Metals in Sampling Points of Water of Ekole Creek |
4. CONCLUSION
Ekole creek is located in Bayelsa State Nigeria and several coastal communities benefit from it by carrying out such activities as; farming/ fishing, recreation, transportation, waste disposal, floating filling stations and dredging. An investigation of water quality in this work showed that dredging activities among other activities in Ekole creek have a side effect on water quality of downstream because of the increased concentrations of Turbidity, TSS, Fe, Pb, Cr, Mn and Ni and decreased amounts of DO. These amounts were all higher than their various WHO (2017) standards of portable water in the Downstream point, this was because of re-suspension of parameters in the bottom sediments. The depth of creek also increased as a result of dredging activities in the area and these presented health risk to downstream users on account of accumulation metals, also environmental disasters like erosion. Therefore, the government of Bayelsa must regulate the unrestricted dredging activities in the area and in the state at large.
ACKNOWLEDGMENT
The authors are grateful to the analyst of New Grass Technology Ltd Owerri for conducting the water and sediment analysis, Ogunlowo Hezekiah for editing the manuscript.
REFERENCES
Edith I. Mbah, Stella N. Ibe and Gideon O. Abu (2017). Water Quality Assessment of the Freshwater Ecosystem at Communities' Points-Of-Use in Yenagoa Metropolis of Bayelsa State, Nigeria, Research Journal of Pure Science and Technology Vol. 1(1) 15-22. Retrieved from https://iiardpub.org/get/RJPST/VOL%201/WATER%20QUALITY%20ASSESSMENT.pdf
Fondriest Environmental Leaning Centre, Water Quality (2021), Retrieved from www.fondriest.com access on 24/09/2021
Garg, S.K. (2010). Hydrology and Water Resources Engineering. Vol.1, Khanna Publishers, New delhi India. Pp 45.
Iyama, W. A., (2005). Development of Water Quality Index for the Imonite Creek Water in Ndoni, Nigeria. Unpublished M.Phil. Thesis, Institute of Geosciences and Space Technology, Rivers State.
Iyama, W. A., Edori O S (2014). Seasonal Variation in Water Quality During Dredging of Brackish Water Habitat in the Niger Delta, Nigeria, Trends in Applied Sciences Research.
Jones, A. R., (1986). The Effects of Dredging and Spoil Disposal on Macrobenthos, Howkesbury Estuary N.S.W. Mar. Prog., 21 :292- 311.
Nick, B. and Marsha, C. (2010). Dredging for Development: A Joint Publication of International Association of Dredging Companies (IADC) and International Association of Ports and Harbors (IAPH), (6th Edition), The Hague, Netherlands. Pp 10-11,52, 43
Odukoya, O.O. Arowolo, T.A and Bamgbose, O. (2002). Effect of Solid Waste Landfill on Underground and Surface Water Quality at Ring Road. Ibadan, Nigeria, Global Journal of Environmental Sciences, 1 : p.43-52. Retrieved from https://doi.org/10.4314/gjes.v1i1.2396
Reddeppna, P., (2001). The solution to Universal Water Needs. Waterfront Publications, 1, (1) : 11-14.
Seiyaboh, E.I., Ogamba, E.N. and 2Utibe, D.I. (2013). Impact of Dredging on the Water Quality of Igbedi Creek, Upper Nun River, Niger Delta, Nigeria Journal Of Environmental Science, Toxicology And Food Technology. Volume 7 (5) 51-56. Retrieved from https://doi.org/10.9790/2402-0755156
Turner, R. E and Streever, B., (2002). Approaches to Coastal Restoration: Northern Gulf of Mexico. SPA Academic Publication. The Hague, Netherlands.
Warren, L.T. (1981). Environmental Pollution. Environmental International Journal Series B, USA.
WHO (2017). Guidelines for Drinking-Water Quality. Incorporating First Addendum, 4th ed. Vol. 1, World Health Organization, Geneva.
|
|
 This work is licensed under a: Creative Commons Attribution 4.0 International License
© IJETMR 2014-2021. All Rights Reserved.