
|
|
|
|
ANALYSIS OF NIGERIAN NATURAL GAS CONSUMPTION (1990 – 2020). A VECTOR ERROR CORRECTION MODEL APPROACHGift Nwabueze 1 1 Emerald Energy Institute, University of Port-Harcourt, Nigeria2 World Bank Center of Excellence for Oilfield Chemicals Research, University of Port-Harcourt, Nigeria3 Emerald Energy Institute, University of Port-Harcourt, Nigeria |
|
||
|
|
|||
|
Received 15 November 2021 Accepted 01 December 2021 Published 21 January 2022 Corresponding Author Gift
Nwabueze, giftcnwabueze@gmail.com DOI 10.29121/ijetmr.v9.i1.2022.1075 Funding:
This
research received no specific grant from any funding agency in the public,
commercial, or not-for-profit sectors. Copyright:
© 2022
The Author(s). This is an open access article distributed under the terms of
the Creative Commons Attribution License, which permits unrestricted use, distribution,
and reproduction in any medium, provided the original author and source are
credited.
|
ABSTRACT |
|
|
|
This
paper investigates the relationship between natural gas consumption, natural
gas price, crude oil price, Foreign direct Investment
and per capita GDP in Nigeria to ascertain their causal effects and
dependencies by using time series data from 1990 to 2020 in an econometric
platform using Vector Error Correction model (VECM). The result of VECM
estimate, Granger causality test and Variance decomposition test all suggest
the presence of a strong positive correlation between natural gas consumption
and economic growth (represented by per capita GDP) in Nigeria, even though
the price of natural gas is not consumption determined. This implies that
economic policies that encourage production of goods and services in Nigeria
will tend to boost natural gas consumption in Nigeria. Finally, foreign
direct investment showed negligible impact on natural gas consumption but was
more impacted by crude oil price.
This suggests that the rate of influx of foreign investment into
Nigeria is more influenced by international crude oil price not necessarily
by the Nigerian natural gas consumption, all things being equal. |
|
||
|
Keywords: Modelling, Natural Gas Consumption, Natural Gas Price, GDP, Foreign
Direct Investment, Nigeria 1. INTRODUCTION The growing interest in
natural gas globally is largely fueled by the need to provide alternative and
clean energy source to meet the needs of the Organization for Economic
Cooperation and Development (OECD) countries and emerging economies. The
frequent change in international oil price brings about security of supply
issues for crude oil although the slow growth of renewable energy technology
in Africa implies that the continuous dominance of oil and gas resources in
the region is still in sight. Federal ministry of power
(2017) admits that, of the total electricity generation in Nigeria, natural
gas source account for about 74% and this percentage is expected to increase
by 7% in 2030. Therefore, improved natural gas development and production is
expected to improve electricity generation in Nigeria. Natural gas
utilization reduces gas flaring, provides more job opportunities, improves
the welfare of the citizens, and enhances productivity in the energy sector
of the economy. Nigerian population stands
at approximately 194 million with a Gross Domestic Product (GDP) per capita
of about 1881 USD. It is richly blessed with |
|
||


natural resources, ranking 9th globally in terms of natural gas reserve size and largest in Africa Oil Producers Trade Section (2017). Nigerian proven natural gas reserve stands at about 200.79 trillion cubic feet (DPR, 2019), which is split in a ratio of approximately 50/50 between non-associated gas and associated gas.
The Nigerian Liquefied Natural Gas Company (NLNG), which began exploration and production in 1999, is the largest natural gas operator in the country. Natural gas is utilized in domestic cooking as Liquefied Petroleum Gas (LPG), LNG (export), power generation (IPPs and thermal plants) and manufacturing (fertilizer and petrochemicals), with LNG and IPP development given priority, both of which the federal government is participating as either joint venture JV or production sharing contract PSC.
Despite the huge proven natural gas reserve in Nigeria, only about 1.2 billion cubic feet of this number is being developed and produced (DPR, 2019), most of which are exported as Liquefied Natural Gas (LNG). The federal ministry of petroleum resource (MPR) identified governance, legislation, and regulatory issues as part of the challenges bedeviling the growth of the Nigerian natural gas industry.
The current laws governing the gas sector were made for oil production and not gas, with several regulatory institutions having conflicting roles and no clearly defined boundaries. The presence of unpaid cash calls for the joint venture arrangements have also made it extremely onerous to attract foreign direct investment in the sector.
Shell, a major player in the Nigerian oil and gas
industry, also identified absence of pipeline infrastructure, inadequate
regulatory, commercial, and legal framework and
non-adherence to contractual obligations as some of the factors bedeviling the development of natural gas in the country.
Globally, the natural gas industry is experiencing increasing competition by suppliers in the international market leading to very low international gas prices. Most countries are now looking out for the renewable energy option, making the market power to gradually shift from producers to buyers. On the domestic market, the presence of militancy in the Niger Delta, inadequacy of transportation infrastructure and delay in completion time for on-going projects leads to inadequate supply of natural gas.
Domestic gas consumption is expected to bring about diversification and industrialization of the nation’s economy, but the natural gas producers are more aligned to exporting this product due to the higher export prices with guaranteed payment discipline and available transmission and transportation infrastructure to the international market. Incentives such as alternative pricing and better fiscal regime have been adopted by the federal government to encourage private participation in natural gas development and domestication of natural gas in the local market.
This paper investigates the relationship between natural gas consumption, natural gas price, crude oil price, and per capita GDP in Nigeria to ascertain their causal effects and dependencies by using time series data from 1990 to 2020 in an econometric platform. The Vector Error Correction model (VECM) have been adopted for this study because of the presence of cointegrating relationships among the variables in the time series dataset.
1.2. LITERATURE REVIEW
Numerous studies aimed at modeling energy demand exist in literature, some of which dates far back to the early 1970s after the first oil crisis and has greatly evolved since then. Bhattacharyya and Govinda (2009) classified energy demand modeling into two major approaches; Econometrics and End user accounting and deduced that although the projections from the latter were more realistic, the econometrics method has lesser application to developing countries because of data deficiency.
Hong (2013) aligns with the Box Jenkins Auto Regressive Integrated Moving Average (ARIMA), Artificial Intelligence Approach and Support Vector Regression methods (SVR) as the main classes of models that find application in electric load forecasting.
Time Series models employs time series trend analysis to make forecast and prediction of future dependencies. Regression and Econometric models employ both time series and other types of datasets set to carryout similar forecast with the latter offering macroeconomic explanation to the obtained result.
Odhiambo (2010) for example studied the energy consumption versus economic growth relationship in South Africa, DR Congo and Kenya using econometric method”, and found out that while energy consumption drives economic growth in South Africa and Kenya; in Congo, this situation is reversed as economic growth is the driver of energy consumption.
Also, while several literatures on the
topic asserts that economic growth is the main driver of energy consumption, Chien-Chiang
and Yi-Bin (2011) concludes that the
main drivers of natural gas consumption vary for different countries and listed
Energy intensity, Economic performance, Population factors and Proportion of
primary energy consumption as consistent causative factors across countries.
On the other hand, United States natural
gas development, with existing infrastructural inadequacy to meet increasing
demand for natural gas, have proven to be largely independent of the
interaction between the economy and the natural gas sector but rather depending
on broader international and domestic socio-economic conditions. Felipe
et al. (2018).
Khan (2015) modeled the long- and short-term response of natural gas consumption in Pakistan with respect to changes in price, real GDP per capita and income changes, using econometric method for a period between 1978 and 2011. The model was based on a single equation which states that Natural gas demand is related positively to income, price of natural gas and price of substitutes. It is specified as.
![]() (2.6)
(2.6)
Where: ![]() ,
, ![]() ,
, ![]() ,
,![]() ,
, ![]() and
and ![]() are natural gas demand,
real income, natural gas price, price of substitutes, lagged dependent time
variable and an error term respectively. j
denotes several sectors of natural gas consumption: i.e., residential,
transport, industrial and power sectors. While Real GDP per capita had great
impact on natural gas consumption, natural gas demand generally reacted
indifferently to increase in price as indicated by low price and cross price
elasticity. It was forecast, however, that deliberate increase in natural gas
price per capital, over a period between 2012 and 2020 will result in a
decrease in per capita natural gas consumption.
are natural gas demand,
real income, natural gas price, price of substitutes, lagged dependent time
variable and an error term respectively. j
denotes several sectors of natural gas consumption: i.e., residential,
transport, industrial and power sectors. While Real GDP per capita had great
impact on natural gas consumption, natural gas demand generally reacted
indifferently to increase in price as indicated by low price and cross price
elasticity. It was forecast, however, that deliberate increase in natural gas
price per capital, over a period between 2012 and 2020 will result in a
decrease in per capita natural gas consumption.
In Ojide et al. (2012), distributed lag system and co-integration analysis were utilized in analyzing the relationship between sustainable economy and the Nigerian gas industry. Both regression and co-integration analysis showed that natural gas utilization had a positive impact on the Nigerian economy given a 3-year lag and this impact is sustainable given the long run relationship that was observed from the co-integration test performed. They also discovered that regulations prohibiting gas flaring had very little effect on the general consumption trend.
Alternative considerations in energy demand modeling such as asymmetric price response, time varying demand parameters and triangulation analysis to seasonal and climatic change as presented by Salisu and Ayinde (2015) sought to recognize some other behaviors of energy demand in which traditional energy demand models seem to have overlooked previously. The asymmetric prices response assumes that energy demand response to increase in price is not reversed completely with reduction in price. The given reason being that energy price increase leads to new technological innovations/investments which are not reversed when the energy price falls. Time varying demand parameter consideration becomes useful due to parameter instability associated with energy modeling while triangulation analysis refers to using other techniques to analyze the same data set to ascertain robustness. They also deduced that demand for energy products (such as heating) can also be affected by seasonal and climatic changes. This led to the conclusion that these factors should all be considered to avoid misleading estimates in energy demand modeling.
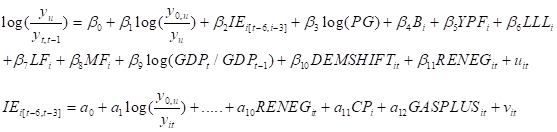
Onolehemhen et al (2017) suggests that domestic utilization of natural gas in Nigeria is slowed down due to poor investment in the sector in the past years which they attributed to poor electricity generation, in adequate infrastructure, poor commercial and regulatory framework in the Nigerian natural gas sector as compared with the crude oil sector. They studied the determinants of natural gas domestic utilization in Nigeria from 1990 – 2013, using econometric method by considering the impact of natural gas price, price of other energy source, foreign direct investment, electricity generation from natural gas, volume of gas flared and per capita real GDP. The result of their study showed that real GDP per capita, electricity generation from natural gas and changes in the flared volume had positive and significant effect on domestic utilization of natural gas. Also, also the above listed determinants mutually explained the pattern of domestic natural gas utilization by 98%. Using Auto Regressive Integrated Moving Average technique, they forecasted a likely upward movement for domestic utilization of natural gas resource and suggested that the Nigerian government should enhance domestic utilization patterns by using economic instruments such as power sector investments and fiscal incentives.
Barril and Navajas (2015) aimed to combine the use of theoretical framework with empirical modeling to discover the factors enhancing the decline in natural gas supply in Argentina. Simple supply model of non-renewable natural resources adapted from Pickering 2008 and Medlock 2009 was used as a base. The empirical analysis was done based on data from annual production of natural gas from 1993 to 2013 years of production between 2002 and 2013. This reduced the observations to 1298 representing 168 areas. They came up with the following equations for Investment behavior.
 (2.11)
The result of testing the production equation of 1 and 2 using OLS and 2 SLS shows that there was no major difference between OLS and 2SLS estimation procedures. They concluded that Argentina’s natural gas production decline follows a standard theoretical approach and investment performance reinforces the fact that low price signals have deleterious effect on an already mature conventional gas pattern.
Solarin and Shahbaz (2015) applied Co-integration test to Foreign direct investment (FDI), trade and Capital formation to the Gross Domestic Product (GDP) per capita for a period of 1971 – 2012 in Malaysia. Foreign direct investment was a determinant of economic growth in Malaysia because of the several incentive schemes aimed at attracting foreign international oil companies to the Malaysian oil and gas sector. Also, most part of the natural gas production in that country comes from the production sharing contract between Petronas and foreign companies. Their model Log-linearly specified as.
![]() (2.12)
(2.12)
Where, ![]() represents residual term and
represents residual term and ![]() is a constant.
is a constant.
The result of Bayer-Hank co-integration approach reveals a positive correlation between FDI and economic growth. For policy, this implies that adopting any policy that conserves the use of natural gas in Malaysia will retard its economic growth.
Finally, VECM was adopted by Xiaohua (2018) and Fadli et al. (2011) to investigate causal relationships in the US and Malaysia respectively. While Xiaohua (2018) studied the direction of causality among the US oil price, GDP, and carbon emissions, by analyzing data from 1983 to 2013, Fadli et al. (2011) analyzed the relationship among interest rate, inflation rate and exchange rate volatility in Malaysia between 1999-2009. Both studies conducted stationarity, cointegration, stability, and Granger causality tests. In Xiaohua (2018), the results suggested that oil price fluctuation heavily impacts carbon emission, while the GDP changes does not cause carbon emissions. Oil price also has a short-term influence on both GDP and carbon emissions while possessing dwindling influence the in long term. Fadli et al. (2011) observed that Inflation rate Granger-causes the Exchange rate in the short-term while Interest rate impacts Exchange rate volatility positively. Inflation was observed to have a reverse impact on exchange rate volatility.
2. MATERIAL AND METHODS
The VECM offers the benefit of interpreting both dynamic and long-term relationship and this usually results in more efficient short run coefficients when compared to Vector Autoregression (VAR) models. Several determinants of natural gas consumption have been listed from Chen (2018), Khan (2015), and Onolemhemhen et al (2017). They are Energy Intensity, Economic performance, and Population factors, Natural gas price, Price of Substitutes, Income, Price, substitute energy source, foreign direct investment, flared volume, and real GDP. For the VECM specification in this paper therefore hypothesizes that Natural gas consumption is dependent on Per capita GDP, Natural gas price, Price of crude oil and Foreign direct investment. i.e.,
![]() (3.0)
(3.0)
Where, NC represents natural gas consumption, NGP represents natural gas price, NGPS represents price of substitute (Crude oil price), GDPI represents gross domestic product per capita, and FDI represents foreign direct investment. Mundell (1961) stated the general specification for a VECM model as,
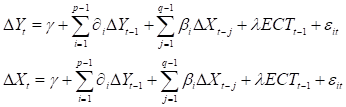 (3.1)
(3.1)
Where, ![]() and
and ![]() are lag orders (lag
length) for dependent and independent variables respectively,
are lag orders (lag
length) for dependent and independent variables respectively,
![]() and
and ![]() are coefficients of
the lagged dependent and independent variables respectively,
are coefficients of
the lagged dependent and independent variables respectively,
and ![]() is a constant term.
is a constant term.
![]() (3.2)
(3.2)
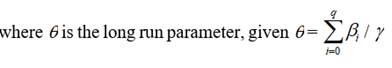
![]() represents the Error correction term, given by
represents the Error correction term, given by
![]() (3.3)
(3.3)
 (3.4)
(3.4)
The sources of data for this research were from the OPEC Annual Statistical Bulletin (ASB) for 2021, World Bank, Trading Economics and US – Energy Information Administration. OPEC ASB (2021) presented monthly data for Natural gas price, natural gas demand and crude oil price covering a period from 1990 to 2020, from which average yearly data from 1990 to 2020 was derived. While data for foreign direct investment percent GDP and GDP per capita were sourced from the US-Energy Information Administration and world bank respectively.
2.1. UNIT ROOTS TEST AND COINTEGRATION
It is now a standard practice in empirical modeling involving panel data and time series data to test for unit roots before any estimation is made from the data set. Unit roots test is necessary for time series variables to investigate trending behaviors or non-stationary behavior in the mean.
If the series has unit roots, it shows the series is unstable and therefore would lead to wrong predictions and forecasts. With unit root, the impact of a shock may be permanent. If the series has no unit root (stationary series) co-integration tests are not required, therefore long run model should be estimated.
Cointegration or linear combination test among variables in a model is a way to avoid spurious regression. Therefore, the investigation of cointegration is necessary prior to model estimation. Some commonly applied cointegration tests are the Bounds test, Cointegrating Regression Durbin–Watson (CRDW) test, the residual-based Engle-Granger-Dickey-Fuller (EGDF) cointegration test, and the Johansen COINTEGRATION TEST.
Estimation of the Lag length is done by determining the criterion with the lowest number of lags and determining the lag order for the chosen criterion.
3. RESULTS AND DISCUSSION
This section presents the results from the Estimation of Lag length, Testing the Granger Causality, Unit root test, Bounds co-integration test, model estimation and variance decomposition test.
3.1. DETERMINATION OF LAG LENGTH
The lag order determination from the lag structure of the Akaike Information criterion (AIC) shows an optimal lag order of 2 for the 5% significant interval as seen in the table below. This lag length is determined from Vector Auto Regression (VAR) model and will be reduced by one lag when estimating the VEC model.
|
Table
1 Determination of optimal
lag length |
||||||
|
Lag |
LogL |
LR |
FPE |
AIC |
SC |
HQ |
|
0 |
-564.2898 |
NA |
3.15E+11 |
40.66356 |
40.90145 |
40.7363 |
|
1 |
-462.4371 |
160.0542 |
1.34E+09 |
35.17408 |
36.60144 |
35.6104 |
|
2 |
-408.543 |
65.44286* |
2.06e+08* |
33.11022* |
35.72705* |
33.91021* |
Where LR is sequential modified LR test statistic, FPE is Final prediction error, AIC is Akaike Information criterion, SC is Schwarz information criterion and HQ Hannan-Quinn information criterion.
3.2. UNIT ROOT TEST RESULTS
The result of the unit roots tests as tabulated below shows different orders of integration among the variables. Whilst natural gas consumption and foreign direct investment indicated ‘no unit roots’ at levels, natural gas price, per-capita GDP and crude oil price were stationary after first difference.
|
Table 2 Unit root test results for the dependent variable
and the independent variables |
|||
|
Variable |
5%
Level |
ADF
t-statistics |
Result |
|
NGC |
-3.612 |
-4.239 |
Stationary at level |
|
DNGP |
-3.58062 |
-6.82213 |
Stationary after first difference |
|
DGDPI |
-3.5806 |
-4.4606 |
Stationary after first difference |
|
DNGPS |
-3.5806 |
-4.67756 |
Stationary after first difference |
|
FDI |
-3.612 |
-4.239 |
Stationary at level |
The difference in the order of integration among the variables indicates that bounds cointegration test is suitable for testing for cointegration. The result in Table 3 indicates the presence of cointegration in the 5 model equations. The is also validated in by the presence of 5 cointegrating equations in both the Trace and Max eigen value statistics in the Johansen cointegration test result in Table 4 and Table 5.
|
Table 3 Bounds cointegration test result |
||||
|
Dependent variable |
F-stat |
I (0) |
I (1) |
Remark |
|
NGC |
19.1811 |
2.86 |
4.01 |
Estimate VECM |
|
GDPI |
3.292724 |
2.86 |
4.01 |
Estimate VECM |
|
NGP |
10.95048 |
2.86 |
4.01 |
Estimate VECM |
|
NGPS |
9.859244 |
2.86 |
4.01 |
Estimate VECM |
|
FDI |
11.71481 |
2.86 |
4.01 |
Estimate VECM |
|
Table 4 Johansen cointegration
results (Trace statistic) |
||||
|
Hypothesized |
Trace |
0.05 |
||
|
No. of CE(s) |
Eigenvalue |
Statistic |
Critical Value |
Prob.** |
|
None * |
0.921093 |
171.7617 |
69.81889 |
0 |
|
At most 1 * |
0.809746 |
103.1957 |
47.85613 |
0 |
|
At most 2 * |
0.672654 |
58.39199 |
29.79707 |
0 |
|
At most 3 * |
0.501964 |
28.24008 |
15.49471 |
0.0004 |
|
At most 4 * |
0.294498 |
9.418824 |
3.841466 |
0.0021 |
|
Table 5 Johansen cointegration results (Max-Eigen statistic) |
||||
|
Hypothesized |
Max-Eigen |
0.05 |
||
|
No. of CE(s) |
Eigen value |
Statistic |
Critical Value |
Prob.** |
|
None * |
0.921093 |
68.56598 |
33.87687 |
0 |
|
At most 1 * |
0.809746 |
44.8037 |
27.58434 |
0.0001 |
|
At most 2 * |
0.672654 |
30.15191 |
21.13162 |
0.0021 |
|
At most 3 * |
0.501964 |
18.82126 |
14.2646 |
0.0089 |
|
At most 4 * |
0.294498 |
9.418824 |
3.841466 |
0.0021 |
3.4. ESTIMATION OF VECTOR ERROR CORRECTION MODEL (VECM)
The presence of cointegration among the variable shows that VECM can be estimated for the variables. The Trace and Max-eigen value tests show that there are 5 cointegrating equations at the 5% significant level. Therefore, the long run VECM estimates are given by the coefficients tabulated below.
|
Table 6 VEC Model estimation |
|||||
|
Normalized cointegrating coefficients (standard
error in parentheses) |
|||||
|
NGC |
GDPI |
NGP |
NGPS |
FDI |
|
|
1 |
-3613.351 |
-737.509 |
-177.077 |
300.7167 |
|
|
(-504.352) |
(-112.08) |
(-23.1022) |
(-29.4341) |
||
From the model coefficients the null hypothesis can be rejected against the alternative hypothesis as the T-Stat value is > 2 for all the variables. Real GDP per capita, natural gas price and crude oil price showed a direct and significant relationship with natural gas demand in the long run, indicating that natural gas consumption is enhanced by increase in economic activities as represented by GDPI. The same effect is also observed for the price of crude oil as a substitute fuel. However, of note is the direct and significant relationship observed between natural gas consumption and natural gas price in the long run.
Income elasticity estimate indicates that natural gas price exerts less impact on the natural gas consumption than real GDP per capita, which may explain the variance experienced by the natural gas price from the normal demand/price relationship. Foreign direct investment showed a reverse and significant relationship with natural gas consumption in the long run.
3.5. GRANGER CAUSALITY TEST
Although the results of both Bounds and Johansen cointegration test performed in this paper affirms the presence of a long run relationship amongst the chosen variables, it does not specify whether or not there is a causal relationship among the variable and its direction. VECM Granger causality test is performed to investigate the causal relationship among the variables in the long run. In this analysis, the null hypothesis of “All the lagged coefficients of the regressor does not cause the dependent variable” for P - values < or = 0.05 is rejected. The summary of the result is tabulated in Table 7 below.
|
Table 7 VEC Granger causality/ Block Exogeneity Wald test result |
|||
|
Dependent
Variable |
Chi-sq |
Probability |
VEC Granger
causality/ Block exogeneity wald test |
|
DNGC |
5.355539 |
0.0207 |
Reject the Null hypothesis for DGDPI |
|
DGDPI |
15.00807 |
0.0001 |
Reject the Null hypothesis for DNGP |
|
DNGP |
0.748022 |
0.3871 |
Do not reject the Null hypothesis for
any regressor |
|
DNGPS |
8.460938 |
0.0036 |
Reject the Null hypothesis for DNGC
& DGDPI |
|
3.830815 |
0.0503 |
||
|
DFDI |
3.903647 |
0.0482 |
Reject the Null hypothesis for NGC |
From the test result, while per capita GDP significantly granger cause natural gas consumption, NGC, in the long run, NGC does not cause GDPI in return. There is also a unidirectional causality between per capita GDP and natural gas price as natural gas price significantly impacts per capita GDP in the long run. Also, natural gas consumption and per capita GDP were seen to have a significant impact on the price of crude oil whereas natural gas price was not significantly granger-caused by any of the regressors.
3.6. VARIANCE DECOMPOSITION TEST
The variance decomposition is used to estimate the level of variability in the dependent variable that is lagged by its variance. It gives insight on the regressor that more strongly explains the variability in dependent variable with time. The variance decomposition of forecast error gives the percentage of expected variation in each variable that is produced by shocks from other variables. It indicates the relative impact that a variable has on another variable.
Table 8 shows the result of the variance decomposition test. For a forecast period of 5 years, natural gas consumption is largely influenced by its lag, per capita GDP, and crude oil price in the long run whereas foreign direct investment has a very insignificant influence on Nigerian natural gas consumption. Natural gas consumption also strongly influences per capita GDP and natural gas price while having a very insignificant impact on crude oil price. FDI is strongly endogenous and has its most significant impact of the price of crude oil in Nigeria.
|
Table 8 Variance decomposition for 5 - year
forecast error variance |
||||||
|
Variance Decomposition of NGCSCF: |
||||||
|
Period |
S.E. |
NGCSCF |
GDPI |
NGP |
NGPS |
FDI |
|
1 |
60.6576 |
100 |
0 |
0 |
0 |
0 |
|
2 |
97.4705 |
87.87055 |
4.277163 |
2.45114 |
0.014151 |
5.386992 |
|
3 |
126.5224 |
64.15956 |
23.6571 |
2.0765 |
2.724624 |
7.382221 |
|
4 |
141.8383 |
51.74977 |
31.21145 |
1.65684 |
8.963405 |
6.418535 |
|
5 |
150.4659 |
46.0963 |
35.28587 |
1.8455 |
11.06805 |
5.704283 |
|
Variance Decomposition of GDPI: |
|
|
|
|
||
|
Period |
S.E. |
NGCSCF |
GDPI |
NGP |
NGPS |
FDI |
|
1 |
0.2421 |
1.206543 |
98.79346 |
0 |
0 |
0 |
|
2 |
0.4034 |
19.78788 |
71.2522 |
4.53183 |
4.428091 |
2.70E-07 |
|
3 |
0.5407 |
30.74209 |
60.71382 |
2.99189 |
5.097571 |
0.454625 |
|
4 |
0.6742 |
37.21967 |
54.49588 |
2.6426 |
4.602777 |
1.039075 |
|
5 |
0.7732 |
41.58678 |
49.72499 |
2.90569 |
4.293626 |
1.488912 |
|
Variance Decomposition of NGP: |
|
|
|
|
||
|
Period |
S.E. |
NGCSCF |
GDPI |
NGP |
NGPS |
FDI |
|
1 |
1.3156 |
48.24041 |
12.96766 |
38.7919 |
0 |
0 |
|
2 |
1.6676 |
53.57751 |
14.11451 |
30.6128 |
1.390673 |
0.304474 |
|
3 |
2.007 |
58.56552 |
9.887975 |
29.7912 |
1.160701 |
0.594633 |
|
4 |
2.3982 |
60.8591 |
8.713846 |
29.1583 |
0.827126 |
0.441595 |
|
5 |
2.6723 |
63.03343 |
8.469489 |
27.3297 |
0.809898 |
0.357477 |
|
Variance Decomposition of NGPS: |
|
|
|
|
||
|
Period |
S.E. |
NGCSCF |
GDPI |
NGP |
NGPS |
FDI |
|
1 |
14.1861 |
11.43227 |
27.01281 |
30.9449 |
30.61004 |
0 |
|
2 |
21.9305 |
6.347699 |
29.28621 |
21.2066 |
39.65625 |
3.503278 |
|
3 |
27.1465 |
9.176222 |
23.81428 |
19.1403 |
39.32013 |
8.549071 |
|
4 |
30.5392 |
9.653879 |
22.04851 |
20.0238 |
36.82629 |
11.44748 |
|
5 |
32.9654 |
9.23072 |
21.53653 |
20.2743 |
36.30333 |
12.65507 |
|
Variance Decomposition of FDI: |
|
|
|
|
||
|
Period |
S.E. |
NGCSCF |
GDPI |
NGP |
NGPS |
FDI |
|
1 |
9.0043 |
9.915766 |
3.52757 |
38.3703 |
0.750288 |
47.43605 |
|
2 |
15.2687 |
29.91889 |
10.72298 |
22.1233 |
0.946005 |
36.28883 |
|
3 |
20.0381 |
42.1432 |
10.14906 |
14.1587 |
0.63225 |
32.91678 |
|
4 |
23.751 |
46.29827 |
8.640785 |
11.8039 |
0.633646 |
32.62342 |
|
5 |
26.8478 |
47.68067 |
8.430118 |
10.7436 |
0.816035 |
32.32963 |
|
Cholesky Ordering: NGCSCF GDPI NGP NGPS
FDI |
||||||
4. CONCLUSION AND RECOMMENDATION
This paper empirically investigated natural gas consumption in Nigeria as a function of natural gas price, per capita GDP, crude oil price and FDI. It applied the Augmented Dickey Fuller unit root test; Auto Regressive Distribution Lag (ARDL) Bounds test and Johansen co-integration test to confirm the presence of long run relationships among the dependent and independent variables. The VECM estimate, Granger causality test and Variance decomposition test all suggest the presence of a strong positive correlation between natural gas consumption and economic growth (represented by per capita GDP) in Nigeria, whereas natural gas price is not consumption determined.
This implies that economic policies that encourage production of goods and services in Nigeria will tend to boost natural gas consumption in Nigeria.
Finally, foreign direct investment showed negligible impact on natural gas consumption but had a much larger influence on the international crude oil prices. This suggests that the rate of influx of foreign investment into Nigeria is more influenced by international crude oil price not necessarily on the Nigerian natural gas consumption, all things being equal.
ACKNOWLEDGEMENTS
This research is sponsored by
the Petroleum Technology Development Fund, Nigeria. I also hereby acknowledge
the support I received from the management and staff of Emerald Energy
Institute in course of this research in graduate school.
REFERENCES
Barril, D., Navajas, F., (2015). Natural gas supply behavior under interventionism: The Paper 4866.case study of Argentina, The Energy Journal, 36(4). Retrieved from https://doi.org/10.5547/01956574.36.4.dbar
Bhattacharyya, S., Govinda R. (2009). Energy Demand Models for Policy Formulation, Policy Research Working
Biose, H., (2019). Gas Pipelines in Nigeria : Sine Qua Non for Economic Development, International Journal of Engineering Technologies and Management Research, 6(4), Retrieved from https://doi.org/10.29121/ijetmr.v6.i4.2019.366
Chien-Chiang, L., Yi-Bin, C. (2011), Modeling OECD energy demand: An international panel smooth transition error-correction model, International Review of Economics and Finance 25 (2013) 372-383 Retrieved from https://doi.org/10.1016/j.iref.2012.08.002
Department of Petroleum Resources, (2019), Nigeria's Gas Reserves, Retrieved from https://www.dpr.gov.ng/nigerias-gas-reserves-rise-to-200-79-trillion-cubic-feet-dpr/
Fadli F., Abu Hassan A., Nurul Syuhada B., Nurmadihah J., Zuraida M., Norazidah S., and Kamaruzaman J. (2011). A Vector Error Correction Model (VECM) Approach in Explaining the Relationship Between Interest Rate and Inflation Towards Exchange Rate Volatility in Malaysia, World Applied Sciences Journal 12 (2011), 49-56 Retrieved from https://citeseerx.ist.psu.edu/viewdoc/download?doi=10.1.1.390.8762&rep=rep1&type=pdf
Felipe F, Gokul C., Charalampos., A, Sauleh A., Siddiquic,d, Leon E., Sriram S., Matthew T., Pralit L., Nathalia C., Evelyn T., and Marshall A., (2018). The future of natural gas infrastructure development in the United States. Applied Energy 228 (2018), 149-166. Retrieved from https://doi.org/10.1016/j.apenergy.2018.06.037
Hong, W. (2013). Intelligent Energy Demand Forecasting, Lecture Notes in Energy 10, https://doi.org/10.1007/978-1 4471-4968-2_2, # Springer-Verlag London 2013. Retrieved from https://link.springer.com/book/10.1007%2F978-1-4471-4968-2
Khan, M. (2015). Modelling and forecasting the demand for natural gas in Pakistan. Renewable and Sustainable Energy Reviews 49 (2015), 1145-1159, Elsevier Ltd. Retrieved from https://doi.org/10.1016/j.rser.2015.04.154
Mundell, R.A., (1961). A theory of optimum currency areas. American Economic Review, 51(4) : 657-665.
Odhiambo, N. (2010). Energy consumption, prices, and economic growth in three SSA countries : A Comparative study, Energy Policy 38 (2010), 2463-2469. Retrieved from https://doi.org/10.1016/j.enpol.2009.12.040
Odumugbo, C. (2010). Natural gas utilization in Nigeria : Challenges and opportunities. Journal of Natural Gas Science and Engineering, 2 (2010), 310-316. Retrieved from https://doi.org/10.1016/j.jngse.2010.08.004
Oil Producers Trade Section, (2017). Harnessing Nigeria's Gas Resources, http://www.opts-ng.com/index.php/updates/harnessing-nigerias-gas-resources.
Ojide, M., Salami, D., Fatimah, K., Gaza, M., Oke, D. (2012). Impact of Gas Industry on Sustainable Economy in Nigeria : Further Estimations through Eviews. Journal of Applied Sciences, 12(21), 2244-2251. Retrieved from https://doi.org/10.3923/jas.2012.2244.2251
Omisakin, A., Oluwatosin A., Oyinlola, A. (2012). Structural Breaks, Parameter Stability and Energy Demand Modeling in Nigeria. International Journal of Economic Sciences and Applied Research, 5(2), 129-144. Retrieved from https://www.ceeol.com/search/article-detail?id=107934
Onolemhemhen, R. U., Adaji, J. J., Adenikinju, A., (2016). Forecasting the domestic utilization of natural gas in Nigeria (2015 -2020), AAPG/SPE Africa Energy and Technology conference, Kenya, December, 2015. Retrieved from https://onepetro.org/speafrc/proceedings-abstract/16AFRC/All-16AFRC/SPE-AFRC-2560895-MS/210051
Organisation of Oil Producing and Exporting Countries OPEC, (2018). Nigeria facts and figures, https://www.opec.org/opec_web/en/about_us/167.htm
Salisu, A., Ayinde,T. (2016). Modeling energy demand: Some emerging issues. Renewable and Sustainable Energy Reviews 54 (2016), 1470-1480. Retrieved from https://doi.org/10.1016/j.rser.2015.10.121
Shell, (2017). Natural gas, https://www.shell.com.ng/media/nigeria-reports-and-publications-briefing-notes/potential-in-natural-gas.html
Solarin, S. A., Shahbaz, M., (2015). Natural gas consumption and economic growth: The role of foreign direct investment, capital formation and trade openness in Malaysia, Renewable and Sustainable Energy Reviews 42(2015), 835 - 845, http://www.sciencedirect.com Retrieved from https://doi.org/10.1016/j.rser.2014.10.075
Sonibare, J., Akeredoulu, F. (2004). Natural gas domestic market development for total elimination of routine flares in Nigeria's upstream petroleum operations, Energy Policy, 34 (2006), 743-753. Retrieved from https://doi.org/10.1016/j.enpol.2004.07.006
Suganthi, L., Samuel, A. (2012). Energy models for demand forecasting-A review, Renewable and Sustainable Energy Reviews 16 (2012), 1223- 1240. Retrieved from https://doi.org/10.1016/j.rser.2011.08.014
Trading Economics, (2019). Nigeria - Total Natural Resources Rents (% Of GDP), Retrieved from https://tradingeconomics.com/nigeria/total-natural-resources-rents-percent-of-gdp-wb-data.html.
United States Energy Information Administration, (2008). U.S. Natural Gas Imports and Exports : 2007, Retrieved from https://www.eia.gov/naturalgas/importsexports/annual/archives/2009/ngimpexp07.pdf
Xiaohua Z., (2018). VECM Model Analysis of Carbon Emissions, GDP, and International Crude Oil Prices, Hindawi Discrete Dynamics in Nature and Society, 11 (2018), Retrieved from https://doi.org/10.1155/2018/5350308
|
|
 This work is licensed under a: Creative Commons Attribution 4.0 International License
© IJETMR 2014-2022. All Rights Reserved.