
|
|
|
|
Economic Viability of Basalt-based Brake Pad in NigeriaGai, Peter Friday 1 1 PhD student Department of Mechanical/Production Engineering, Faculty of Engineering and Engineering Technology, Abubakar Tafawa Balewa University Bauchi, Nigeria.2 Prof. of Mechanical Engineering, Department of Mechanical/Production Engineering, Faculty of Engineering and Engineering Technology Abubakar Tafawa Balewa University Bauchi, Nigeria.3 Prof. of Materials and Metallurgical Engineering, Director Centre for Industrial Studies Department of Mechanical/Production Engineering, Faculty of Engineering and Engineering Technology Abubakar Tafawa Balewa University Bauchi, Nigeria.4 PhD. Senior Lecturer Department of Mechanical/Production Engineering, Faculty of Engineering and Engineering Technology Abubakar Tafawa Balewa University Bauchi, Nigeria. |
|
||
|
|
|||
|
Received 08 October 2021 Accepted 01 November 2021 Published 31 December 2021 Corresponding Author Gai,
Peter Friday, gapex2003@yahoo.com DOI 10.29121/ijetmr.v8.i12.2021.1052 Funding:
This
research received no specific grant from any funding agency in the public,
commercial, or not-for-profit sectors. Copyright:
© 2021
The Author(s). This is an open access article distributed under the terms of
the Creative Commons Attribution License, which permits unrestricted use, distribution,
and reproduction in any medium, provided the original author and source are
credited.
|
ABSTRACT |
|
|
|
The
economic analysis reveals the basic information on the expenditure and profit
to an investor who is willing to invest on the production of basalt-based
brake pad in Nigeria, Nigeria has huge demand of brake as revealed by data
obtained from National Bureau of Statistics Abuja (NBS). The analysis was
based on deductive economic analysis which assumptions were made and arrived
at particular result and the costing was based on Activity-Based Costing
(ABC) where overhead and indirect cost were assigned to the related product.
The economic analysis will give an insight to an investor (s) who has been
skeptic about investing in the manufacturing of brake pad in Nigeria. The
analysis revealed that the total capital require for this investment is
#54,520,184.00 to set up a manufacturing plant with a capacity of 12,960
pieces of brake pad per day with a depreciation period of ten years. It also
showed that if the line will run at 75% efficiency, the annual production is
2,566,080 pieces of brake pads. The unit cost of production is #520.85, unit
selling price is #572.935, interest before tax of #6,797,983.869, break-even
quantity of 861,019pieces, payback period of eight months. The annual total
cost of production is #1,373,924,104.00, annual total sales revenue of
#1,470,309,952.00. Twenty-seven people are require for manning the plant. It
is clear from above information the investment is worthwhile because of the
good payback period and considering the huge demand in Nigeria. |
|
||
|
Keywords: Economic, Viability, Basalt, Brake Pad, Nigeria 1. INTRODUCTION The essence of any
research work is to impact positively on socio-economic value of Nigeria, it
is on this premise that the work sought to explore the economic viability of
commercializing the production of basalt-based brake pad in Nigeria using
Small and Medium Enterprises (SMEs). The laboratory results of basalt-based
brake pad have proven that the material is a good material for brake pad.
Hence, there is need to explore the economic benefits of the material in
commercial scale production most especially at this time when all the brake
pad manufacturing industries are shut down in Nigeria because of high cost of
imported raw materials and high instability of exchange rate. |
|
||


Manufacturing of automobile spares in developing economic like Nigeria will go a long way in meeting the demand of spare parts, improve the socio-economic status of country and create jobs for the teeming youth.
1.1. Brake Pad Demand in Nigeria Market
Demand for product or service is the cause for developing new product or expansion of production capacity or provision of the needed services. Knowing the particular time to meet this demand for products or service is very critical and important in order to satisfy the customer needs.
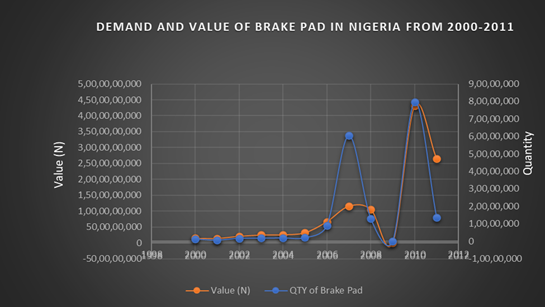
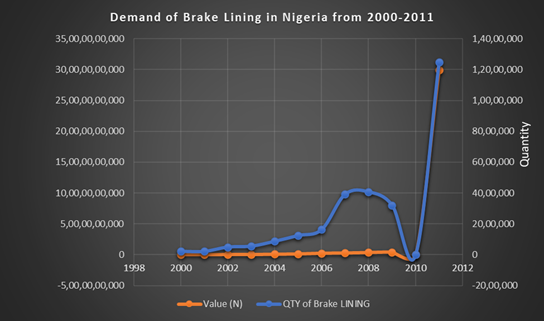
The demand for brake pad in Nigeria is high; as data obtained from National Bureau of Statistics showed that between 2000-2011 about 185,113,536 of brake pads and 28,965,552 pieces of brake linings were imported into Nigeria, valued at over 42bn Naira. This indicated that in this period, the average annual demand of brake pad in Nigeria is 15,426,113 for brake pad and over 2 million pieces of brake lining valued at about #3.5 billion.
|
|
|
Figure 1 Demand
and value of brake pad in Nigeria from 2000-20211 (source: data from NBS) |
|
|
|
Figure 2 Demand
and value of brake linings in Nigeria from 2000-2011 (source: data from NBS) |
According to Nigeria Blueprint Newspaper of October 29th, 2020, reported by Binta Shama, Professor Husaini Doko Ibrahim the Director General of Raw Materials Research and Development Council (RMDC), stated that it is very important to have brake pad manufacturing outfit in Nigeria that will use high percentage of raw materials locally source within the country. He furthered stated that the high dependence on imported raw materials has caused the shutdown of brake pad manufacturing outfits that were existing in Nigeria among which are Feredo, was situated in Ibadan, Mintex was established in Kano, and Fenok, was situated in Onitsha, Apex brake pads was manufactured in Lagos, Edison was located in Nnewi. Nigeria Blueprint Newspaper of October 29th, (2020).
The information given above is a clear indication that Nigeria as a country is in dire need of brake pad manufacturing industries to reduce to the dependence on importation by providing alternative local materials within the country.
For a new product to be developed there are two fundamental questions to answer and these are:
1) what is the total cost of producing the new product?
2) will end user be eager to pay for the product at that cost?
To response to the question above first, a cost analysis must be done and ascertain whether the total cost of producing the new product is within the cost of existing product or not. If it is not, then the cost elements have to be reviewed. Secondly a market feasibility study must be conducted to have first-hand information on the market demand and price, then evaluate if your pricing will give you competitive advantage.
Economic
Analysis
The economic analysis x-rayed the cost and benefits involve in the local production of basalt-based brake pad and the viability of the production for Small and Medium Enterprises (SMEs) in Nigeria for the purpose of improving Nigeria’s economic status and creating employment for the youth.
To achieved this, the work determined the total production costs and total revenue gotten from products sold. this information is vital to know if the product has economic value.
It is also important to know the total capacity of the manufacturing equipment because production volume influence the average cost of production this is because as the production volume increase the average cost decreases because the fixed cost does not change with production volume hence the total cost decreases. Thus, the lower the average cost the better the profitability.
The uncertainty of price is very crucial because the basalt-based brake pad must compete with other brake pads from different manufacturer. Consumers always look at price and quality as factors in determining their choice for product. To determine the price a certain percentage of margin can be added to the total cost of production but bearing in mind that the price can compete favourably with other competitors while the investors also go home smiling.
2. Review of Product Costing
The review gives an information on how costing of products evolved overtime are as follows:
2.1. Traditional Costing System
The traditional costing system is a method of assigning factory overhead to products or services based on the quantity of production resources used.
Brignall (1997), stated that the traditional accounting system (TAS) assigns the manufacturing expenses to the products produced based on plant overhead rate or on two-stage allocation system. In his findings the plant overhead rate assigns cost on a single on based on the total factory, but the two-stage allocation assigns production overhead cost based on departmental activities under this system.
Blocher, et al, (1999), in their work they evaluated and find fault in the traditional costing system for presuming product directly absorbs the resources of the organization, hence, it is difficult to manage the cost.
Hansen and Mowen (2000), in their researched proposed that the traditional costing system assumed that the objects consume resources, hence these systems see the cost as cost source. Therefore, it is difficult to manage cost. Nonetheless, in traditional costing systems, underlying axiom is that costs can be managed because they are not aware about the driving factor of cost.
Kaplan, (1988), in his approached towards traditional costing system accepts that no single system can sufficiently proffer solution to the needs made by the diverse functions of the cost system. He said organization needs cost system to carry out three primary functions: inventory valuation for financial reporting purposes, operational control for performance and productivity evaluation and individual product cost measurement. Kaplan emphasis on requirement and importance of costing system for performing various functions.
Cooper and Kaplan (1998) debated that inventory costing for financial reporting purpose function is arguably fulfilled adequately by conventional costing systems, such system could not explain what the shop floor manager should do to manage cost, improve performance and their systems tended to distort product cost for strategic marketing purpose, particularly in high overhead contents.
(Sakurai,1996, Cooper and Kaplan, 1998 and Blocher, et al, 1999), opined that conventional costing systems are based on a two-stage procedure. Under the two-stage allocation procedure direct costs are traced to products, overhead costs are assigned to cost centres and then to production output. In the second stage, the traditional costing system assigns overhead expenses from the centres to products using volume-based cost drivers. This two-stage allocation procedure, however, fails to furnish information that can be used to cost management and better performance.
2.2. Activity-Based Costing (ABC)
Activity Based Costing (ABC) was developed to overcome some of the challenges of Traditional Based costing. The basic distinction between the two is the pools method, in the traditional based costing it pools cost to the department and to the object i.e the product while in activity-based costing it pools cost to the activity centre then to the product (Edmond et al, 2020)
Dickinson and Lere (2003). Revealed that the ABC is a costing system that provides important information for decision making in manufacturing cost.
Afonso (2002), state that activity-based costing become popular in the 80s when it was developed by professors Robert Kaplan and Robin Cooper, its important contribution in the eighties fold over the traditional costing method.
Thyssen et al. (2006). Stated that ABC model was a response to the need for better assess costs in modern production environments and to clear the doubt and meet expectation of managers on the variable costing and full costing of product.
Pike et al. (2011), in their view said that in an attempt to reduce waste during production, modern manufacturing outfits have adapted the philosophy of lean manufacturing to achieve waste reduction and optimize production processes. This quest for waste minimization and revenue maximization called for the need of improvements in traditional accounting systems. This is because the TCS was not fit for efficiently in lean model.
Askarany et al. (2010), Stated that Activity Based Costing suggests for organization the knowledge of cause and consequence between the expenses and activities demands, as well as the direct costs of these tasks to cost products.
2.3. Time-Driven Activity-Based Costing
The “Time-Driven Activity-Based Costing” (TDABC) is a costing model that considers time as the persuader costing. Its reason is to allocate costs of activities based on time consumed per activities.
Kaplan and Anderson (2007). Stated that the (TDABC) method can compute simply and concisely the cost to a targeted degree, enabling firms to conduct more evaluation of the costs by outlining the tasks that add a higher ratio of value juxtapose to those who, though add value, give rise to big operating costs resulting to less benefits for the company. The advantage over ABC is in simplifying the costing process.
Oker and Adiguzel (2010). Stipulated that the TDABC abolish the costly process of research, in order to gather information on the cost assigned to resources and tasks before channeling it to the cost of product.
2.4. Value Stream Costing (VSC)
The Value Stream Costing (VSC) results from the development of cost accounting on the basis of Lean Manufacturing concept and Lean Accounting. The method follows the theory of plotting the value stream, which uses the concepts provided by Lean to map and identify the value stream of the production process.
McVay et al. (2013) proposed that VSC is a system that reveal the costs with base in value stream able to unveil more important information to Lean companies, this costing system for Lean companies offering better internal cost management.
These costing techniques can be combined in costing a particular product or services.
Darwish and Waguish (2020), developed two optimization models for activity based costing and Traditional costing technique for manufacturing field in job shop. The two models considered a bi-directional relationship between hourly rate and annual hours on each equipment. The model was developed mainly to minimize total cost of manufacturing taking into cognizance varying machine hourly rate. The model was solved using traditional cost technique. The ABC model gives better competitive advantage in terms of hourly rate which allows better advantage from competitors.
Tang et al. (2012), conducted a researched on a better cost estimation and product pricing model through input-output in the form of decision model for operations analysis. The model surveys activity-based rates, raw materials and purchased components pricing when utilized in production and the cost of defected items.
Myrelid and Olhager (2019), suggested a hybrid cost approach for mixed process environment job shop, flow shops and assembly lines in order to establish a cost allocation for products produced by manufacturer. They resolved that lean accounting cost model is to be assigned to assembly lines, throughput accounting cost model to flow shops and traditional accounting cost to job shop environment.
Zhuang and Chang (2017) proposed a mixed integer programming model to determine the optimal product mix for production process using time driven activity-based costing (TDABC). The labour and machine rates were taken as constants and adjustment was not taken in consideration.
3. Matreials and Methods
3.1. Materials
The materials used for the production of the basalt brake pad are Basalt powder, bronze powder, cast iron powder, Glass fibre and phenolic resin
3.2. Methods
The methodology used to arrive at the total cost associated with the production of basalt-based brake pad. These costs are:
· Variable
· Fixed
· Total
· Average
· Unit.
And the others as:
· Revenue
· Net profit
· Break-even
Variable cost
These costs change as the volume of production change within a period. This cost includes outsource labour, raw materials, packaging, labels, energy, and utilities.
![]() 1
1
Where:
Vc is variable cost.
Q is quantity of Materials.
Uc is unit cost.
Fixed Costs (FC)
The fixed cost is a cost that does not depend on production volume and this include the following costs: building and infrastructure, plant equipment, insurance, interest on loan, hire labour and depreciation.
Total Cost (Tc)
Total cost is the sum of the variable cost and the fixed cost, it is mathematical expressed as:
![]() 2
2
Average Cost (Ac)
The average cost which can also be referred to as mean is calculated as the total cost (Tc) divided by the total output (Qp).
Thus, average cost is:
Average cost ![]()
Or ![]()
Or
![]() 3
3
Revenue
Revenue is the total amount of money
realized from the sales of products in this case the brake pad. mathematically
expressed as:
Revenue = Unit price * Quantity of
product sold
R = ![]() 4
4
Where:
R = revenue, UP = unit price and Q= quantity sold
Net Profit
Net profit is the difference between the
revenue and the total cost of production. The total cost should include
operation expenses, taxes and others. Net profit can also be referred to as
bottom line or net earnings.
The net profit is mathematically
expressed as:
![]() 5
5
Np is the net profit.
Tr is the total revenue.
Break-even Analysis
Break-even cost is the point where the cost of producing one unit is equal to selling price of the that one unit, which means that at this point there is neither a profit nor a loss. Break-even cost of production should be a reference for the price of a product if a manufacturer should recover the cost of production.
Breakeven quantity = fixed
costs / (sales price per unit – variable cost per unit)
![]() 6
6
Pay-Back Period
Pay-back period (PBP) This is
the time taken for a business to recover an investment. This gives a business
an insight on whether to go for the investment or look for alternative
investment.
![]() 7
7
Profit-Volume analysis
For any business to be
sustainable it must generate profit otherwise it will seize to be in the market
over time. So, profit is one of the very important indices in business
consequently, it cannot be ignored.
![]() 8
8
4.
Result
Manning Distribution
The manning distribution was done considering each equipment in workstation and the number of people required to operate the equipment and number of shifts needed. Also, the qualification of the personnel was another factor considered to ensure the capability of the personnel. The renumeration was referenced to the federal government salary scale as shown in Table 1.
|
Table 1 Manning distribution and overhead cost |
|||||
|
Number
of staff |
Designation |
Department |
Qualification |
Consolidated
monthly salary (#) |
Federal
Government salary scale (#) |
|
1 |
Factory
manager |
operations |
Bsc/HND
Engineering |
86,000 |
81,555.25
(GL08-S15) |
|
1 |
Production
manager |
production |
ND
mechanical Engineering |
65,000 |
65,041.75
(GL07-S15) |
|
1 |
Maintenance
supervisor |
Engineering |
ND
mech/elec. Engr’ng |
65,000 |
65,041.75
(GL07-S15 |
|
1 |
Accountant |
Finance |
ND
Account and finance |
65,000 |
65,041.75
(GL07-S15) |
|
1 |
Storekeeper/
distribution officer |
Supply
chain |
SSC |
38,750 |
30,316.167 |
|
3 |
Maintenance
Technician |
Engineering |
NTC
mech/elec. Engr’ng |
116,250 |
30,316.167 |
|
3 |
Quality
inspector |
Quality
Assurance |
NTC/SSCE |
116,250 |
30,316.167 |
|
12 |
Machine
operator |
production |
NTC
mech/elec. Engr’ng |
465,000 |
30,316.167 |
|
3 |
Assistant
operator |
Production |
Craft
Cert |
99,000 |
30,316.167 |
|
1 |
Housekeeper |
HSE |
Ability
to speak and write |
30,000 |
30,316.167 |
|
Total |
---- |
---- |
---- |
1,146,250 |
|
Equipment and Facility cost
The equipment cost was arrived at based on online price of www.alibaba.com and personal online engagement with the sales representatives of the equipment. The energy cost was assumed based on equipment power rating as obtained from the original equipment manufacturer (OEM) and the Jos Electricity Tariff. The cost of drilling borehole was obtained from quotation of Aquagem Geological and Mining Engineering Company Zarmaganda Rayfield Road Jos.
These values are shown in Table 2.
|
Table 2 Equipment and Facility cost |
||||
|
Item |
Cost
in Dollar |
Cost
in Naira |
Depreciation
period (yrs) |
Depreciated
value/Labour per month (N) |
|
Brake
pad front and back mould hot press machine with four moulding stations
Capacity 12,960 pcs/ day (42kW) (online sales www.alibaba.com) |
31,000 |
15,810,000 |
10 |
131,750 |
|
Mixer
Model JHF20 25 rev/min (2kW) |
5,080 |
2,590,800 |
10 |
21,590 |
|
Oven
(3kW) |
8,000 |
4,080,000 |
10 |
34,000 |
|
Shipping,
clearing, transportation and installation |
|
6,000,000 |
10 |
50,000 |
|
Building |
|
15,000,000 |
15 |
83,333.333 |
|
Borehole,
overhead tank and accessories |
|
6,000,000 |
10 |
50,000 |
|
Electronic
Scale |
----- |
150,000 |
3 |
4,167 |
|
Labour |
|
---- |
--- |
1,146,250 |
|
Insurance
of Machineries and structures (0.9% of total cost) to be paid annually and
renewable |
|
--- |
--- |
37,110.6 |
|
Subtotal |
|
49,563,800 |
|
1,426,450.933 |
|
Contingency
10% of subtotal |
|
4,956,380 |
|
|
|
Grand
Total |
|
54,520,180 |
|
1,426,450.933 |
Note, an exchange rate of N510/dollar was used looking at the instability of the exchange rate.
Raw Materials Cost
The raw materials used in the production of the brake pad need to be analyzed in terms of volume, weight and unit cost this analysis is shown in Table 3, Table 4.
The total mass of the friction pad (Mbp) is 0.2062kg
The density of the friction pad (ρfp)
is 2781.33kg/m3
The volume = ![]() =
= ![]() =
=
![]() = 7.413x10⁻⁵m3.
= 7.413x10⁻⁵m3.
The % volume and mass contribution of the
raw materials is as shown in Table 3.
|
Table 3 Volume, bulk density and mass of materials used |
|||||
|
S/N |
Material |
%
Volume fraction |
Volume
(m3) |
Bulk
Density (kg/m3) |
Mass
(kg) |
|
1 |
Basalt
powder |
38 |
2.81721x10⁻⁵ |
2,201.00 |
0.050268026 |
|
2 |
Bronze
powder |
12 |
8.89646x10⁻⁶ |
6,266.60 |
0.04519182 |
|
3 |
Glass
fibre powder |
12 |
8.89646x10⁻⁶ |
2,670.00 |
0.019256649 |
|
4 |
Cast
iron powder |
26 |
1.92757x10⁻⁵ |
5,281.80 |
0.082523514 |
|
5 |
Phenolic
resin |
12 |
8.89646x10⁻⁶ |
1240 |
0.008943163 |
|
6 |
Total |
100 |
7.41372x10⁻⁶ |
---- |
0.206183171 |
Raw Materials Cost
The cost of raw materials is in unit cost
and this cost involve sourcing the materials and process the materials into
powder. The cost is shown in Table 5.
|
Table 4 Materials cost |
||||
|
S/N |
Material |
Mass (kg) |
Unit cost (N/kg) |
Total cost (N) |
|
1 |
Basalt
powder |
0.062006866 |
2300 |
142.62 |
|
2 |
Bronze
powder |
0.055745238 |
2700 |
150.51 |
|
3 |
Glass
fibre powder |
0.023753557 |
1000 |
23.75 |
|
4 |
Cast
iron powder |
0.101794815 |
600 |
61.07 |
|
5 |
Phenolic
resin |
0.01131614 |
1000 |
11.31 |
|
6 |
Back
plate |
0.134 |
400 |
53.6 |
|
7 |
Sub
total |
--- |
----- |
442.86 |
|
8 |
Packaging |
---- |
----- |
50.5 |
|
9 |
Distribution |
----- |
----- |
6 |
|
10 |
Total |
---- |
----- |
499.36 |
Assuming 4% of the total machineries cost will be spent on maintenance per month
Therefore, spending on maintenance per month = 49,480,800x0.04 = 1,979,232
|
Table 5 Energy and Maintenance cost |
|
|
Description |
Cost (#) |
|
Energy cost per month using 22 days as average
working days considering equipment rating and office use total (kWhr 26,400 @
#45.00 JED tarriff) |
1,188,000 |
|
Maintenance |
1,979,232 |

Best on production line installed capacity 12,960 pcs/day.
Assuming the line will run at 75% efficiency and 22 working days/month.
Therefore, daily average production will be = 12960x0.75 = 9720pcs/day
![]()
Monthly production = 9720 x 22 = 213840pcs
Energy & Maintenance cost per unit absorption per
month = ![]() = #14.811/pc
= #14.811/pc
Variable cost
Therefore, the cost of raw materials,
packaging, distribution, energy and maintenance = 499.36+14.811 = #514.171
Variable cost per month = variable unit
cost x quantity produced per month = 514.179x 213840 = #109,931,470.2/month.
Manufacturing cost per unit

= ![]() = #520.85/pc
= #520.85/pc
Therefore, the cost of producing one
brake pad is = #520.85
Manufacturing cost per month = variable
cost per month + fixed cost per month
=
520.85 x213,840 + 1,426,450.933 = #112,805,014.933
The selling price is determining by
adding a percentage margin to the total cost of production and distribution, as
a rule of thumb 10% is okay.
Therefore, selling price = 520.85 +
520.85x10% = #572.935
Total revenue per month assuming all
products produce are sold
= 572.935x213840 = #122,516,420.4, table
8 shows the sales revenue for twelve months.
Gross profit per month = total monthly
revenue – total monthly manufacturing and distribution costs.
= 572.935 x 213840 – 112,805,014.933 =
#9,711,405.467
Assuming 30% as cost of sales =
9,711,405.467x0.3 = #2,913,421.6401
Therefore
Earnings before interest and tax (EBIT) =
9,711,405.467 – 2,913,421.6401 = #6,797,983.8269
Break-even Quantity (BeQ)
BEQ = ![]() =
= ![]() = 861,019units
= 861,019units
Pay-back Period
Pay-back period (PbP) = ![]() =
= ![]() =
8.02 months
=
8.02 months
Table 6 showed the summary of
costs and production volume over a period of one year.
|
Table 6 Break-even Analysis |
||||||
|
Month |
Quantity |
Fixed cost |
Variable cost |
sales revenue |
Total cost |
Average cost |
|
Dec |
0 |
54,520,184 |
0 |
0 |
54,520,184 |
49,240,800 |
|
Jan |
213840 |
54,520,184 |
109950326.6 |
122516420.4 |
164,470,511 |
769.1288376 |
|
Feb |
427680 |
54,520,184 |
219900653.3 |
245032840.8 |
274,420,837 |
641.6499188 |
|
Mar |
641520 |
54,520,184 |
329850979.9 |
367549261.2 |
384,371,164 |
599.1569459 |
|
Apr |
855360 |
54,520,184 |
439801306.6 |
490065681.6 |
494,321,491 |
577.9104594 |
|
May |
1,069,200 |
54,520,184 |
549751633.2 |
612582102 |
604,271,817 |
565.1625675 |
|
Jun |
1,283,040 |
54,520,184 |
659701959.8 |
735098522.4 |
714,222,144 |
556.6639729 |
|
Jul |
1,496,880 |
54,520,184 |
769652286.5 |
857614942.8 |
824,172,470 |
550.5935482 |
|
Aug |
1,710,720 |
54,520,184 |
879602613.1 |
980131363.2 |
934,122,797 |
546.0407297 |
|
Sep |
1,924,560 |
54,520,184 |
989552939.8 |
1102647784 |
1,044,073,124 |
542.4996486 |
|
Oct |
2,138,400 |
54,520,184 |
1099503266 |
1225164204 |
1,154,023,450 |
539.6667838 |
|
Nov |
2,352,240 |
54,520,184 |
1209453593 |
1347680624 |
1,263,973,777 |
537.3489852 |
|
Dec |
2,566,080 |
54,520,184 |
1319403920 |
1470197045 |
1,373,924,104 |
535.4174865 |
|
|
|
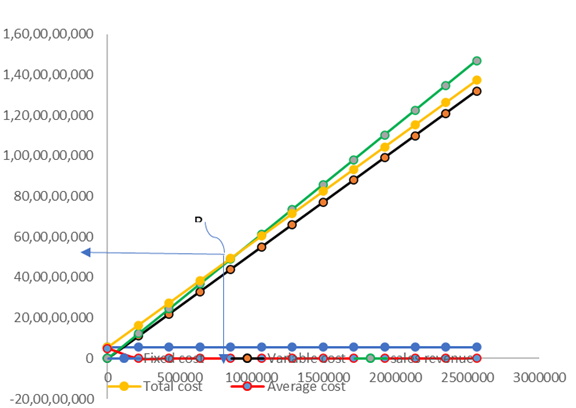
Figure 3 Break-even
analysis |
5. DISCUSSION OF RESULTS
Fixed Cost
The fixed cost was calculated to be
54,520,180.00 this is the amount require to set up the manufacturing plant of
the brake pad. This amount will be depreciated over a period of 10years for
equipment and fifteen years for building after which the plant book value will
zero except if the investment is recapitalize.
Variable/unit Cost
The variable cost of the basalt-based
brake pad was calculated to be #514.179 (five hundred- and fourteen-naira
sixty-two kobo only). This cost involved cost of raw materials, packaging and
distribution of producing one unit of the product, this cost increase as
production increase.
Unit Cost
The unit cost is the total cost involved
in the production of one brake pad, the unit is #520.85 (five hundred- and
fourteen-naira, eighty-five kobo). This cost involved variable cost and fixed
cost. It is also referred to manufacturing cost.
Unit Selling Price
The selling price is the price at which
the product is sale and customers are willing to pay for the value of what they
will get. The selling price is the sum variable cost, fixed cost involved in
producing a unit product plus the percentage margin. The selling price was
calculated to be #572.935 (five hundred and seventy-two, naira ninety-eight
kobo only) against the #1000 – 1250 obtain in the present market.
Average Cost
Figure 3 shown the average cost
of the basalt brake pad continues to decline as production volume continue to
increase, the average cost per piece in the first month of was #769.128 and
continue to decrease and after twelve months of production is #535.417. This
explained the advantage of mass production the higher the volume production the
less the average cost because the fixed cost does not change with volume.
Sales Revenue
Figure 3 showed that the
monthly generated revenue by the line if the average efficiency is maintained
at 75% is #122,516,420.4 if all the products produced are sold. The revenue is
the product of selling price and the total products produce for the month.
Break-even Point
Figure 3 showed the break-even
quantity is 861,019 units, at this quantity the total cost of production is
equal to the total sales volume. This means that the investor neither make gain
nor loss from the business.
Earnings Before Interest and Tax (EBIT)
The earnings before interest and tax for
the basalt-based brake pad is #6,797,983.869 within a month. That means the
business gains before tax is #6,797,983.869 in one month, so annually it will
be #81,575,806.428
Gross Margin
Gross margin calculated is
#11,137,813.827 for one month production and this is the difference between the
sales revenue and the total cost of production.
Pay-back-period
The payback period of the calculated showed in equation 8 that the investor will recoup his/her investment within eight months of good production and sales.
The complete break-even analysis is shown in figure 8.
Annual Production.
Figure 3. showed the annual production of the plant is 2,566,080 pieces of brake pad this is far less than the annual demand of brake in Nigeria is 15,426,113 pieces.
6. Conclusion
In view of the economic indices from the analysis investment in basalt-based in Nigeria is the way to go because business has short payback period, good margin and there is abundant market in Nigeria. It will be good if the government of Nigeria will encourage local investors into production of brake pads and other automobile spare parts by given incentive and bringing legislative that will discourage importation of these products.
REFERENCES
Afonso, P. S. L. P. (2002). Sistemas de custeio no âmbito da contabilidade de custos: o custeio baseado nas actividades, um modelo e uma metodologia de implementação (Dissertação de mestrado). Universidade do Minho, Braga
Askarany, D., Yazdifar, H., & Askary, S. (2010). Supply chain management, activity-based costing and organisational factors. International Journal of Production Economics, 127(2), 238-248. Retrieved from https://doi.org/10.1016/j.ijpe.2009.08.004
Dickinson, V., & Lere, J. C. (2003). Problems evaluating sales representative performance.Industrial Marketing Management, 32(4), 301-307. Retrieved from https://doi.org/10.1016/S0019-8501(02)00203-1
Kaplan, R. S., & Anderson, S. R. (2007). Time-driven activity-base costing : a simpler and more powerful path to higher profits. Massachusettes: Harvard Business School Press.
Maskell, B. H., & Baggaley, B. (2004). Practical lean accounting : a proven system for measuring and managing the lean enterprise. New York : Productivity Press.
McVay, G., Kennedy, F., & Fullerton, R. (2013). Accounting in the lean enterprise : providing simple, practical, and decision-relevant information. New York : Productivity Press.
Myrelid, A. and Olhager, J. (2019), Hybrid manufacturing accounting in mixed process environments : A methodology and a case study, International Journal of Production Economics, vol. 210, pp. 137- 144, 2019. Retrieved from https://doi.org/10.1016/j.ijpe.2019.01.024
Nigeria Blueprint Newspaper of October 29th, (2020), reported by Binta Shama.
Nigeria Demand for Brake Pad and Linings (2000-2011) Data from National Bureau ofStatistics Abuja Nigeria.
Oker, F., & Adiguzel, H. (2010). Time-Driven Activity Based Costing : an Implementation in a manufacturing company. Journal of Corporate Accounting & Finance, 22(1), 75-92. Retrieved from https://doi.org/10.1002/jcaf.20646
Pike, R. H., Tayles, M. E., & Mansor, N. N. A. (2011). Activity-based costing user satisfaction and type of system : A research note. The British Accounting Review, 43(1), 65-72. Retrieved from https://doi.org/10.1016/j.bar.2010.12.001
Tang, S., Wang, D. and Ding, F.-Y. (2012), "A new process-based cost estimation and pricing model considering the influences of indirect consumption relationships and quality factors," Computers & Industrial Engineering, vol. 63, pp. 985-993, 2012. Retrieved from https://doi.org/10.1016/j.cie.2012.06.010
Thyssen, J., Israelsen, P., & Jørgensen, B. (2006). Activity based costing as a method for assessing the economics of modularization-a case study and beyond. International Journal of Production Economics, 103(1), 252-270. Retrieved from http://dx.doi.org/10.1016/j.ijpe.2005.07.004
Zhuang, Z.Y. and Chang, S.C. (2017) Deciding product mix based on time-driven activity-based costing by mixed integer programming. Journal of Intelligent Manufacturing, vol. 28, pp. 959-974, 2017. Retrieved from https://doi.org/10.1007/s10845-014-1032-2
|
|
 This work is licensed under a: Creative Commons Attribution 4.0 International License
© IJETMR 2014-2021. All Rights Reserved.