
|
|
|
|
STUDENT PERCEPTION OF ONLINE LEARNING DURING COVID: FINDINGS FROM A INDIAN UNIVERSITYVinti K. Agarwal 1 1 Professor, Community Connect & School of Business Studies, Sharda University, India |
|
||
|
|
|||
|
Received 05 September 2021 Accepted 20 September 2021 Published 31 October 2021 Corresponding Author Vinti
K. Agarwal, vinti.agarwal@sharda.ac.in DOI 10.29121/ijetmr.v8.i10.2021.1042 Funding:
This
research received no specific grant from any funding agency in the public,
commercial, or not-for-profit sectors. Copyright:
© 2021
The Author(s). This is an open access article distributed under the terms of
the Creative Commons Attribution License, which permits unrestricted use, distribution,
and reproduction in any medium, provided the original author and source are
credited.
|
ABSTRACT |
|
|
|
The
pandemic threw student lives in disarray as they were forced to transition
overnight to an online system of education for which they and the faculty
were least prepared. In addition to the uncertainty relating to academic schedules,
mode of examinations and evaluation patterns, students were forced to adapt
to learning online without the facility of books, laboratories, libraries,
computer systems and interactive classrooms. What was the perception of
students regarding online learning as a result of this quick transition has
been explored through a case of private university in Delhi-NCR region with
an enrolment of 12000 students. The students were administered a survey with
questions on the economic impact of the pandemic, ownership of digital
devices, access to internet, and perception of online education. The 2463
student responses received indicated that perception of online learning was
quite low even at the level of higher education despite the access to
smartphones and internet. The factors scores relating to perception of
quality of online education however were found to significantly vary across
age, ownership of device and economic impact of covid. |
|
||
|
Keywords: Online education, Higher Education, Covid, Pandemic, Online learning,
Student Perception, Quality, India 1. INTRODUTION The pandemic and its
requirement of social distancing required education to be delivered online.
This resulted in a natural experiment to determine whether digital education
could be applied on a mass scale and its overall acceptability among
students. Online learning has been often touted as a possible medium to make
education accessible to large number of learners at lower costs (Deming et al. 2015). It
would also help to improve reach to remotely placed learners who may also be
working. China has used a combination of
online learning methods to increase enrolment in higher education
quite successfully (Zhiting et al. (2003). Whether this
can be done in India requires a detailed study. As per estimates provided by the Ministry
of Human Resource Development, Government of India, there are 37.4 million
students in the age category of 18-23 enrolled in higher educational
institutions in India (Nanda, (2019).
Higher education in India is offered by both private and public players
wherein cost in government affiliated institutions would be considerably
lower than that in private institutions The GER ratio in higher education |
|
||


is only 26.9 in 2018-19 (Nand (2019) which clearly outlines the issues in access, cost and demand-supply imbalance in higher education. Public funding in higher education has in general been declining in South Asian economies and that has heightened the challenges of increasing enrolment rates (Tilak (2015). There has also a mushrooming of private educational institutions in higher education which has somewhat crowded out public institutions to some degree (Tilak (2014). Therefore improving access to higher education is a formidable challenge. Therefore there is some merit in exploring online education as a means to reach out to large sections of the population at relatively lower cost levels as compared to offline education which requires substantial investment in resources. This is through the lower costs of transportation, accommodation as well as reduction in institutional costs (Dhawan (2020). It is however important to also view the current limitations in introducing online learning since a vast majority of learners would not be able to access online education. As per NSO figures in 2017-18, only 24% of Indian households have Internet facility and only 16% of India’s households receive 1–8 hours of electricity per day (Rahman (2021) .
We explore through the perception of large number of students from a specific University whether online education even with access to internet connectivity and digital device is perceived to find favor with students. The University located in Delhi-NCR region has an enrolment of over 12000 students consisting of undergraduate, post-graduate, diploma and doctoral students. It also has 14 different functional full-fledged schools thus having a very broad spectrum of students from various disciplines. Nearly all these students would have access to internet connectivity and at least a smartphone device. The perception of these students relating to online learning could provide sufficient indication as to whether online education can succeed in the context of India and if it can what are the barriers to the same.
2. Literature Review
Issues of quality in online education remain a major concern even in developed countries. Evidence suggests that online education continues to be majorly used as an add-on rather than as an exclusive medium of education for most learners. Further, the preference for online education varied across learners with usually older students preferring the convenience of online education (Doyle(2009)). Online education does have the benefit of unbundling education but that again is attractive to senior learners who are already in the job market and look to specific content to gain work specific skills. It does appear that digital education is far from replacing the conventional classroom teaching with peer to peer interaction at the undergraduate level (Bert van der Zwaan. (2017)). Evidence also suggests that the future models of higher education are more likely to adopted a blended learning approach (Bonvillian and Singer (2019)), although the percentage mix of offline and online is likely to vary depending on the preference of the learner, the subject and course content, technology advancements and respective universities capacity and intent. (Sahin et al.. (2008)
Even in developed countries like the United States, research suggests that online education did not improve affordability and only ended up producing ‘poor outcomes’ especially among ‘underprepared and disadvantaged students’ (Fain (2019). A comprehensive report on online brought out in 2019 by SynEd among others things pointed out that students require a high degree of ‘self-motivation, self-regulation and organization’ to be able to manage online courses without the presence of a physical teacher (SynEd (2019) . Therefore till the time there is regular and substantive interactivity among teachers and students in online mediums of education, quality in online education is not likely to be achieved, nor would it lead to satisfaction among students relating to their learning outcomes. In fact as per studies conducted by (Lee et al. (2005) (Mitchell et al. (2005) confirmed that students enjoyment of distance education is a critical factor in their acceptance and usage of online learning (Sahin et al. (2008)). There are also practical difficulties in adapting a face to face course into an online one with sufficient loss of interactivity, peer to per learning and experimentation and practical application (Kenzig et al. (2015). Not all courses can be successfully migrated to the online platform and even if it is possible, learning outcomes are necessarily not similar to the offline learning.
In addition, there are a wide variety of delivery
mechanisms even in online education. Proper LMS for online learning ensure
students have access to teaching videos, power point presentations, reading
material and at times even transcripts of videos. They can both download and
upload assignments and evaluation is done online. Online education can be
delivered in various ways but in all cases requires proper planning beforehand
and must be offered asynchronously. It can therefore be through a learning
management interface based on sound instructional technology or can also
consist of recordings of offline blackboard lectures. (McPherson and Bacow (2015)
The one adopted by India in the wake of the pandemic was simply the transition from the physical classroom to an online synchronous system of teaching. There was simply no time to adapt and invest since the academic calendar had to be adhered to. The teaching was synchronous and students were required to access the class through the links provided. There was no formal use of a learning management system as used in a formal online learning system which provides for asynchronous learning. This was similar to other impromptu responses used by other higher educational institutions even in western countries which do not have a proper online education footprint (Kelly and Columbus (2020).
3. Online Education in India
The lockdown announcement to ensure social distancing resulted in a across the board adoption of online learning even in India which traditionally has largely depended on class-room based learning. There are only some universities that offer distance based education in select courses while some educational institutions have experimented with a variety of technology led online education initiatives but those are mostly targeted to more discerning executive learners who want to pursue higher education while working. Some online educational initiatives in the higher education space have largely focused on courses relating to management, finance, artificial intelligence and analytics. There is however little to suggest that it has caught on in a big day with majority of student learners. There has been however some government backed initiatives to introduce online learning through the SWAYAM initiative by Ministry of Human Resource Development.(Gupta (2020) The University Grants Commission(UGC) [i] through its advisories to Universities have been trying to not only enhance the course offerings but also to encourage Universities to popularize the same as making some of them count towards the total credit earned by the students in their academic transcripts.[ii] This has been a very structured mechanism of the Government to make education easily accessible through a MOOC based approach.
4. University Response
Although the first formal lockdown of 21 days was announced only on March 24, 2020 (Hebbar (2020) , the UGC had passed an advisory on March 21, 2020 to ensure students stay home and ‘Work from Home’ was made applicable to faculty to ensure continuation of academic schedules (www.ugc.ac.in. (2020). The fear psychosis was extremely high due to the uncertainty about the level of preparation of medical institutions to be able to handle a runaway pandemic in a 1.3 billion populated country where levels of hygiene and sanitation are already low. High urban density makes voluntary social distancing a luxury and therefore limiting contact was adopted as being the only way out to arrest the spread of the pandemic.
Due to the pandemic, the University almost overnight carried out training of the faculty so that the terms of physical, blended and online modes of education became standard lexicon in their communication vocabularies. They were also put through crash practical training on platforms of Zoom, Google Meet and MS-teams. Faculty in addition used a combination of email, Whatsapp and sometimes Google classroom to facilitate backup communication with students especially when students did not turn up for online classes. Although the announcement of a lockdown was initially slated to be projected to be only that of 21 days, it got extended to almost a year with no signs of the contagion abating. Slowly and steadily, the faculty adapted to taking classes online along with the necessary evaluations. The examinations department also spelled out some protocols of conducting and designing online examinations which depending on the student and faculty feedback were subject to revision.
As the online conduct of classes became a protracted affair juxtaposed with a steep economic slowdown, the University started receiving distress communication from its students most of it related to their inability to pay fee installments. The faculty shared their multiple challenges of teaching online which had much to do with internet connectivity and issues in student engagement. While there was enormous pressure to reduce fees which students justified because education was pushed online, there was parallel pressure on the Universities to keep operations rolling. Faculty and Non-faculty personnel had to be paid salaries, technology up gradation required significant investment, and there were unavoidable fixed operating and financial expenses. In this scenario, the University with a view to understand the impact of Covid on educational plans of students decided to carry out a student survey in the months of July-August 2020. The survey was able to give some insights to the University regarding the financial stress of students and they appropriately responded by making allowances in certain heads of expenses such as hostel and mess fees, liberal grace times to students to pay, offered installment payment facilities and even generous scholarships. Although the survey focused on generating some insights relating to educational planning in the wake of the pandemic, it also aimed at eliciting student perception of online learning. By the time this survey was carried out, the students had already been studying online for 3 months and were therefore in a position to share their perceptions.
5. Purpose of the study
While most of the questions in the survey were aimed to provide management with some critical understanding of student feedback, for the purposes of this paper we have limited our results to only some aspects related to perception of online learning and related it to certain variables of age, gender, economic difficulty and access to digital devices. This is to provide a contextual understanding of whether or not online learning will be successful in the Indian context using students studying in a reasonably better of economic setting where at least basic access to internet and devices is there. We wanted to ascertain whether these factors played a role in the overall perception of online learning and more important, based on the experiences of students, whether they felt that quality in online education could be achieved.
While all the responses emanate from a single university, the number of responses is sufficiently large and are collected from students studying in 10 different functional disciplines such as engineering, management, social sciences, education, pharmacy, social sciences, law, allied health sciences, basic sciences and agriculture. The UGC is a regulatory board for all universities regardless of their public or private status and the advisories on higher education are therefore applicable to all universities. It is therefore hoped that the results would have a certain degree of validity across students studying in other higher educational institutions
Further too put things in the proper context, we would like to clarify that the definition of studying online in this article simply implied replacing the replacing the offline lecture mode of teaching to online teaching mainly through Zoom and Google Meet.
6. Methods
The survey was sent out via a Google form via the specific Google group of students pursuing respectively their under-graduate, graduate, and doctoral education. A total of 6 reminders were sent resulting in a total of 2742 observations. After the removal of duplicate observations, there were a total of 2463 observations. While removing duplicates, a consistent policy of retaining only the latest observations while deleting the earlier ones was followed. Since the survey was administered to students who have limited attention spans and even lower desire to answer surveys, questions had to be limited and chosen carefully. Some of the questions that that the survey focused on were:-
1) What was the extent of economic impact on the families of students?
2) How open would their parents be to allow students to attend physical classes?
3) Who do they contact in case of any difficulty?
4) What is the student perception about online learning?
5) What kind of institutions were they and their family members considering to pursue education?
6) What was their overall yearly budget for education?
7) What speed of internet connections were they using?
8) What were the digital devices did they have?
Participants
There were 1187 observations from female students (48% of total responses), while 1272 responses were received from males (52% of total observations). Only 3 students did not specify gender. 85% of the respondents were undergraduate students while 13% respondents were post-graduate students. Responses from the balance category students constituted only 41 students and were divided into categories of doctoral students, diploma students, integrated and other courses. (See Table 1) Because of the predominant number of undergraduate students responding to the survey, 72% of the respondents student were 21 years and below, 25% were between 22-25 years and only 3% of were above the age of 25 years. 91% of those who responded were stationed within India.
|
Table 1 Gender and Course Profile of Respondents |
|||||||
|
|
Undergraduate |
Postgraduate |
Doctoral |
Diploma |
Integrated |
Other |
Total |
|
Female |
1,016 |
156 |
3 |
9 |
1 |
2 |
1,187 |
|
Male |
1,076 |
171 |
6 |
14 |
4 |
2 |
1,273 |
|
Prefer
not to say |
3 |
3 |
|||||
|
Total |
2,095 |
327 |
9 |
23 |
5 |
4 |
2,463 |
Since the University is residential, it attracts students from all parts of the country. However off the responses received from the respondents, one found that 42% of the responses were from the state of Uttar Pradesh where the University was located, followed by 23% from Delhi and another 11% from Bihar. There was also sprinkling of participation from at least 25 other States and 1 Union Territory.
Data Analysis
With a view to ensure the findings are easily understood, much of the findings have been presented in terms of percentage analysis although one has also used chi-square and factor analysis to understand relationships between various variables. Exploratory factor analysis (EFA) has been used to construct summary indices on perception of quality of online education and whether it was possible to deliver quality education online. These indices were used to deconstruct the perception of online education as per different student categories of age, gender, ownership of devices and economic impact of covid. The cleaning and coding of data was done majorly in Excel. Statistical analysis was done on Stata version 14. All graphs were created in Excel.
7. Findings
The perception of online education in the wake of the pandemic would besides age and gender may also be affected by the degree of economic impact of covid and the ownership of digital devices. Both these factors are important in scaling up online learning among economically disadvantaged groups and those with limited access to digital devices. Therefore respondents were asked to self- categorize the degree of economic impact with quantification of the same.
Economic Impact of Covid
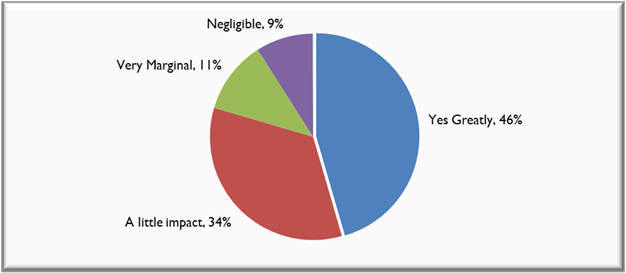
As shown in Figure 1, approximately 46% of the students said that they and their families suffered greatly with respect to the economic impact of Covid. Another 34% said that there was a little impact, while 11% said the impact was only marginal. Only 9% said that the economic impact was negligible. Given the desire of students to get fee waivers and fee reductions, there may be some element of heightened expression of the negative economic impact. Nevertheless there can be no denial of significant economic fallout on the families of students.
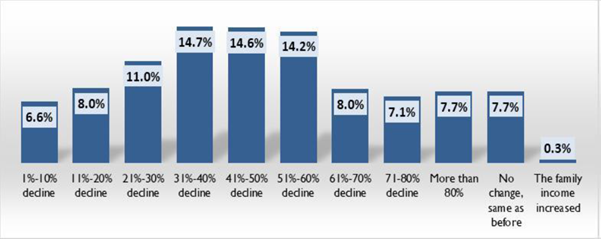
The students were further asked to quantify the
economic decline in monthly household income in percentage terms. These results
have been given in Figure II. %.
For 25% of the respondents, the economic percentage decline was 30% or lower.
For 45% of the respondents, the percentage decline in income would range in between
31% to 60%. For 23% of the respondents, the impact was particularly severe and
ranged from 60% to more than 80%. Considering the midpoint of the class
intervals and the relative frequency, the average decline in income of
respondents worked out to be 41%.
A chi-square test between the categories of income
decline and the perception of overall decline given by respondents was carried
out and it found to be significant at 1% significance level. This implied that a greater perception of
negative economic impact was significantly correlated to a higher assessment of
family income decline. Therefore the overall magnification of economic decline
by students may not be significant. .
Further, it was found that those who had said that the economic impact was severe, their assessment of average economic family decline was around 57.5%, those who said there was a little impact, it was 33.5% and those who said that it was only marginal, it was 29.8%.
|
|
|
Figure 1 Students Perception of Economic Impact of Covid on their
Families |
Based on the views expressed in the survey, students reported that the lockdown had resulted in either reduction in earnings, completed stoppage of salaries or cuts in dearness allowance and incentives. Some of the student reported losses in their family businesses and some others mentioned complete shutdown of their business. The comments also suggested that businesses that depended on direct purchasing power of consumers, or were labor intensive were more impacted. A fair number of students also felt that the University needed to reduce fees due to the economic slowdown. Some in addition also justified fee reduction due to education being carried online and non-presence of students in the university. Some mentioned reservations about having to pay hostel fees although they were not within the hostel. Some in addition mentioned that they were being forced to pay fees and break fixed deposits. Some mentioned individual problems such as specific members losing jobs or suffering from covid.
|
|
|
Figure 2 Student
Quantification of Decline in Family Income |
Access to Internet and Devices
Around 86% of the students were using mobile internet to pursue their education and only round 28% had access to broadband/Wi-Fi. This means that around 14% of respondents were using both mobile data as well as Wi-Fi. This implied that majority of students did not have high speed internet access. The students from Jammu & Kashmir had specific issues relating to 2G connectivity as hindering access to online classes. Mobile internet therefore will have limitations in high speed connectivity and therefore may not be very friendly to many LMS systems. Students cited many difficulties in accessing MS-Teams owing to the high data requirement.
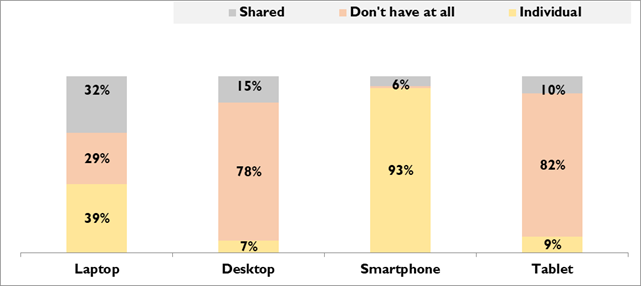
As seen from Figure 3, 93% of the students have smartphones. Therefore basic device access may not be a problem although the quantum and quality of internet access can present a challenge to some students stationed in remote areas. Further the efficiency of students in doing their assignments in the absence of a computer is likely to be constrained. Students do make use of computer labs in the University and not having access to one would affect the regularity and quality of assignments.
It also was apparent that most students do not have tablets or desktops. They do however have access to laptops which may either be individual or shared. The total access to laptops is around 70% but 32% of the respondents said that they share the same. Smartphones have small screens and limited functionalities in being able to type, compute, and search thus affecting execution of assignments. The students were forced to do handwritten assignments which would not find favor with most of them.
Further about 51% of the respondents only own a smartphone and not any other device. Around 29% of the respondents own both a laptop and smartphone. Around 11 respondents or less than 1% of respondents do not own any digital device. There would be around 13% of the respondents which may not be having any smartphone but may be having access to other devices either individually or shared.
|
|
|
Figure 3 Students Access to Devices |
Perception of Online Education
The survey queried students about their perception
about online education using certain statements wherein we used a 3- point
Likert scale of least agree with, somewhat agree with and strongly agree with.
A 3 point scale was chosen in view of the target audience being students to
make it simple for them to answer. The results have been given in Table 2. We gave a score
of 1 to a response of least agree with, 2 to a response of somewhat agree with
and 3 to a response of strongly agree. Based on weighted average of scores,
only about 25% of the respondents would say that online education is as
effective as offline education, 32% said that online education said it is not
all effective, while another 32% said it is only half as effective as online
education. Even for the statement that quality in online education can be
achieved with joint effort of faculty, students and administration, only 41%
actually seemed to concur with it. Given these results, it is more than
apparent that online education is not something that is sustainable for a long
period of time. Some amount of blended learning can be explored but given these
results, total reliance on online learning is a model that will not find favor
with students.
|
Table 2 Perception of Online
Education |
||||
|
Least agree with |
Somewhat agree with |
Strongly agree with |
Weighted Average |
|
|
Online education
is not at all effective |
37% |
32% |
31% |
32% |
|
Online education
is only half as effective as offline education |
28% |
50% |
22% |
32% |
|
Online education
is as effective as offline education |
62% |
29% |
9% |
25% |
|
Online education
with interactivity built in can be also a great learning experience |
25% |
52% |
23% |
33% |
|
Students need to
invest attention and interest to get the best possible takeaways from online
education |
13% |
41% |
46% |
39% |
|
Delivering online
education requires even more investment of time and effort by faculty |
19% |
39% |
43% |
37% |
|
Delivering online
education requires substantial investment in technology and resources |
11% |
36% |
53% |
40% |
|
Quality in online
education can be achieved with joint effort of faculty, students, and
administration |
10% |
36% |
53% |
41% |
Disaggregating Perception of Online Education
The Kaiser-Meyer-Olkin Measure of Sampling Adequacy indicating the proportion of variance in variables that might be caused by underlying factors stood at 0.764 which indicated the suitability of factor analysis in deriving perceptions about online education. Bartlett's test of sphericity testing the hypothesis that the correlation matrix is an identity matrix, was significant c2 (df=28, N = 2463) = 3664.877, p < .01. Hence factor analysis was very much suitable to derive meaningful factors relating to online education.
Eight questions relating to perception of online education were factor analyzed using iterated principal factor analysis with promax (oblique) rotations using 2 factors only. The second factor had a Eigen value close to 1 but explained 32% of the variation. Since the factors were assumed to be correlated, hence Promax rotation was used. The correlation between factors was .294. The Eigen values and respective cumulative variance are given in Table 3.
|
Table 3
Extraction of Factors |
|||
|
Variable |
Loadings for Factor 1 |
Loadings for Factor 2 |
Communality |
|
Online education is as effective as offline education |
0.6411 |
-0.1318 |
0.428 |
|
Online education is only half as effective as offline education |
0.0772 |
0.2271 |
0.058 |
|
Online education is not at
all effective |
-0.6001 |
0.1036 |
0.371 |
|
Online education with interactivity built in can be also a great learning
experience. |
0.6812 |
0.1463 |
0.485 |
|
Students need to invest attention and interest to get the best
possible takeaways from online education |
0.4150 |
0.3993 |
0.332 |
|
Delivering online education requires even more investment of time
and effort by faculty |
-0.1351 |
0.6572 |
0.450 |
|
Delivering online education requires substantial investment in
technology and resources |
-0.1668 |
0.6945 |
0.510 |
|
Quality in online education can be achieved with joint effort of
faculty, students and administration |
0.2950 |
0.5358 |
0.374 |
Based on oblique rotations, only 6 statements were retained. The statement of online education is only half as effective as offline education was discarded while the statement of students need to invest attention and interest to get the best possible takeaways from online education was almost equally loading on both factors and hence discarded. As a result the Cronbach alpha test was used on respectively only 3 statements each. The factor loadings are given in Table 4.
|
Table 4 Factor Loadings |
|||
|
Variable |
Loadings for Factor 1 |
Loadings for Factor 2 |
Communality |
|
Online education is as effective as offline education |
0.6411 |
-0.1318 |
0.428 |
|
Online education is only half as effective as offline education |
0.0772 |
0.2271 |
0.058 |
|
Online education is not at
all effective |
-0.6001 |
0.1036 |
0.371 |
|
Online education with interactivity built in can be also a great
learning experience. |
0.6812 |
0.1463 |
0.485 |
|
Students need to invest attention and interest to get the best
possible takeaways from online education |
0.4150 |
0.3993 |
0.332 |
|
Delivering online education requires even more investment of time
and effort by faculty |
-0.1351 |
0.6572 |
0.450 |
|
Delivering online education requires substantial investment in
technology and resources |
-0.1668 |
0.6945 |
0.510 |
|
Quality in online education can be achieved with joint effort of
faculty, students and administration |
0.2950 |
0.5358 |
0.374 |
The first factor was labeled as, “Perception of students of quality in online education and had an acceptable Cronbach alpha score of 0.67 with an average inter-item correlation of 0.399 Table 5. The second factor was labeled as “Perception of students that quality in online education is possible” and had an acceptable Cronbach alpha score of 0.644 with an average inter-item correlation of 0.376 Table 6
|
Table 5
Reliability for Factor 1 |
|||||
|
Item |
Sign |
Item test corr. |
Item-rest corr. |
Inter-item corr. |
alpha |
|
OE is as effective as offline education |
+ |
0.7817 |
0.4905 |
0.3815 |
0.5523 |
|
OE is not at all effective |
- |
0.7593 |
0.4508 |
0.4335 |
0.6048 |
|
OE with interactivity built in can be also a great
learning experience |
+ |
0.7815 |
0.4903 |
0.3819 |
0.5527 |
|
Test scale |
|
|
0.3990 |
0.6657 |
|
|
Table 6 Reliability for Factor 2 |
|||||
|
Item |
Sign |
Item test corr. |
Item-rest corr. |
Inter-item corr. |
alpha |
|
Delivering OE requires even more investment of time
and effort by faculty |
+ |
0.7772 |
0.4765 |
0.3465 |
0.5147 |
|
Delivering OE requires substantial investment in
technology and resources |
+ |
0.7836 |
0.4881 |
0.3319 |
0.4984 |
|
Quality in OE can be achieved with joint effort of
faculty, students and administration |
+ |
0.7320 |
0.3984 |
0.4501 |
0.6208 |
|
Test scale |
|
|
0.3762 |
0.6440 |
|
Categorizing Quality of Online Education
The factor scores were then subjected to a one-way ANOVA across the categorical values of gender, age, economic impact of covid and access to laptop, desktop, tablet and smartphone. The frequencies of each of the within categories of the categorical variables are shown in Table 7.
|
Table 7 Frequency
of Within Categories of Categorical Categories used in ANOVA |
||
|
|
Category |
Frequency |
|
Gender |
Female |
1187 |
|
Male |
1273 |
|
|
Prefer not to say |
3 |
|
|
Age Brackets |
<18 years |
19 |
|
18-21 years |
1744 |
|
|
22-25 years |
593 |
|
|
26-29 years |
81 |
|
|
30 years and above |
26 |
|
|
Economic Impact of Covid |
Yes Great |
1121 |
|
A little |
838 |
|
|
Very Marginal |
282 |
|
|
Negligible |
220 |
|
|
Other |
2 |
|
|
Laptop access |
Don’t have |
716 |
|
Shared |
788 |
|
|
Individual |
959 |
|
|
Desktop access |
Don’t have |
1931 |
|
Shared |
364 |
|
|
Individual |
168 |
|
|
Smartphone access |
Don’t have |
26 |
|
Shared |
141 |
|
|
Individual |
2296 |
|
|
Tablet access |
Don’t have |
2008 |
|
Shared |
237 |
|
|
Individual |
218 |
|
The results of the one-way ANOVA for Factor 1 have been
given in Table 8. Based on the one way results of ANOVA for the
factor of ‘Perception in Quality in Online Education’ it is apparent that
gender is not significant, but age, economic impact due to covid and access to
a laptop, desktop and tablet is significant.
Older age groups are much more likely to derive quality from online
education and those having a proper device such as laptop and desktop are more
appreciative of online education.
Only 6% of students did not own a smartphone and only 9% of the students had access to an individual tablet. For that matter the overall access to a desktop, shared or individual was only 22%. Results however clearly demonstrate that device access improves outcomes significantly and at the higher education level, a proper device of laptop or desktop can significantly improve quality perception.
|
Table 8 One
way ANOVA test for Perception of Online Education |
|||
|
|
Anova Result |
Means |
Statistical Significance |
|
Gender |
one-way ANOVA (F(2,2463) = 2.83 p =
.0590) |
Female: 1.102 Male: 1.164 |
Significant only at 10% level with male students rating
perception of online education slightly higher than female students |
|
Age |
one-way ANOVA (F(4,2463) =
12.91, p =
.0000) |
18-21 yrs: 1.062 22-25 yrs: 1.231 26-29 yrs: 1.736 >30 yrs: 1.870 |
Significant at 1% level with older age group students rating of
online education higher than younger age group students |
|
Economic Impact of Covid |
one-way ANOVA (F(4,2463) = 7.43, p =
.0000) |
Yes great: 1.022 A little: 1.250 V. marginal: 1.292 Negligible: 1.046 |
Significant at 1% level. Those who suffered economically more
rated the perception of online education lower than those who suffered a
little or marginally |
|
Ownership of Laptop |
one-way ANOVA (F(2,2463) =
31.03, p =
.0000) |
Don’t have: 0.944 Shared: 1.056 Individual: 1.337 |
Significant at 1% and those who had access to a laptop rated
online education quality as higher than those who did not |
|
Ownership of Smartphone |
one-way ANOVA (F(2,2463) = 4.37 p =
.0128) |
Don’t have: 0.982 Shared: 0.883 Individual: 1.150 |
Significant only at 5% and only those who had an individual
smartphone rated online education quality as higher as those who did not.
However there were very few who did not own a smartphone |
|
Ownership of Desktop |
one-way ANOVA (F(2,2463) = 8.51 p =
.0002) |
Don’t have: 1.088 Shared: 1.259 Individual: 1.376 |
Significant at 1% implying those who had access to a desktop
rated online education quality as higher than those who did not |
|
Ownership of Tablet |
one-way ANOVA (F(2,2463) = 13.93 p =
.0000) |
Don’t have: 1.079 Shared: 1.360 Individual: 1.384 |
Significant at 1% implying that those who had an individual
tablet rated online education quality as higher than those who did not.
However very few students had access to a tablet compared to those who did
not. |
The results of the one-way ANOVA for Factor 2 have been given in Table 9. ANOVA results for perception that it is possible to improve quality in online education was only marginally significant in variables related to economic impact of covid and ownership of laptop. None of the other factors impacted the perception that quality in online education can be possible.
|
Table 9 One
way ANOVA results for Perception of Quality in Online Education is Possible |
|||
|
|
Anova Result |
Means |
Statistical Significance |
|
Gender |
one-way ANOVA (F(2,2463) = 2.34, p =
.0968) |
Female: 4.508 Male: 4.408 |
Only significant at 10% implying that gender does not affect
perception that that quality in online education can be improved |
|
Age |
one-way ANOVA (F(4,2463) = 0.88 p =
.4750) |
18-21 yrs: 4.442 22-25 yrs: 4.462 26-29 yrs: 4.629 >30 yrs: 4.709 |
Not significant which implies that across age groups, there is no
difference in perception that quality in online education can be improved |
|
Economic Impact of Covid |
one-way ANOVA (F(4,2463) = 2.43 p = .0454) |
Yes great: 4.430 A little: 4.533 V. marginal: 4.469 Negligible: 4.291 |
Marginally significant at 5% but only in some categories. Only
those who said economic impact of covid was little or marginal had perception
scores above those who said the economic impact was great |
|
Ownership of Laptop |
one-way ANOVA (F(2,2463) 3.54 p = .0292) |
Don’t have: 4.362 Shared: 4.484 Individual: 4.504 |
This was significant only at 5% whereby those who had laptops
perceived that there was a possibility of increase on quality in online
education |
|
Ownership of Smartphone |
one-way ANOVA (F(2,2463) = 3.05 p = .0476) |
Don’t have: 4.239 Shared: 4.248 Individual: 4.471 |
Marginally significant only bordering at 5% whereby only those
who had individual smartphones had higher perception scores above those who
did not have or had shared phones. |
|
Ownership of Desktop |
one-way ANOVA (F(2,2463) = 1.41 p = .2433) |
Don’t have: 4.442 Shared: 4.548 Individual: 4.421 |
Not significant |
|
Ownership of Tablet |
one-way ANOVA (F(2,2463) = 0.38 p = .6805) |
Don’t have: 4.460 Shared: 4.485 Individual: 4.396 |
Not significant |
8. Conclusions
The results although limited to a specific university gave enormous insights on student perception on online education. The preponderance of student dependence on mobile internet and usage of smartphones somewhat reduces options of relying on learning management systems that are bandwidth heavy. Even if we were to disregard issues of equity and access in online education delivery models, it is apparent that even in institutions where students had access to smartphones; perception of quality in online education was poor. This clearly indicates that digital education is only a short term measure till the pandemic abates.
Further as per ANOVA results, it is apparent that perception of quality varies as per attributes of age, economic status and ownership of device. Undergraduates are hardly in a position to be self-motivated or regulated hence age will be an important variable in quality perception of online education. Ease of access of online material through laptops and desktops would no doubt improve the learning experience and therefore result in superior online education perceptions. It also improves user experience and encourages practical application of learning.
However, the perception that quality in online education can be improved is generally poor across all categories and therefore, unless there is a paradigm shift in technological progress, the brick and mortal model of education is here to stay. At best some components of course delivery can be introduced digitally subject to device availability and internet connectivity. Further introduction of online education requires a great deal of investment in learning systems, pedagogy and technology. The approach to online education has to be considerably reoriented and cannot be simply a replacement of the classroom to the computer screen. Interactivity and peer to peer learning are other important elements that also need to be factored in to get possible results. There may be also a number of courses which require practical application and require a lab environment. Besides this, we need to consider variables which affect online learning such as long screen time and associated physical discomfort which will affect efficiency of the student. Research may also been needed into the role of academic spaces of library, classrooms, activity rooms and meeting places which are important differentiators of quality of learning.
The natural experiment of a forced online learning has brought about a relatively realistic assessment of the efficacy of online learning. It requires a paradigm shift in the current systems of learning as well as an ecosystem to make it successful in universities. This would be possible only in some select universities who can afford to make that dedicated investment. Realizing the limitations of total online learning, Universities and policy bodies are exploring the possibilities of blended learning.
Whether or not online education will be successful or not, will depend on whether there is sufficient demand for it. That demand will be a function of the quality perception of online learning and whether it results in suitable learning and placement for the student. These findings will hopefully provide academic stakeholders and related policy makers to take an informed view of the overall feasibility and the model of online education to be adopted in a country like India with a young population, poor internet access and even poorer digital device availability
REFERENCES
Bert van der Zwaan. (2017). Digital or campus teaching? In Higher Education in 2040: A Global Approach (pp. 141-147). Amsterdam University Press. Retrieved from https://doi.org/10.1515/9789048535163
Bonvillian, W. B., & Singer, S. R. (2019). The Online Challenge to Higher Education. Issues in Science and Technology, 29(4), 23-30.
Deming, B. D. J., Goldin, C., Katz, L. F., & Yuchtman, N. (2015). Can Online Learning Bend the Higher Education Cost Curve ? The American Economic Review, 105(5, Papers and Proceedings of the One Hundred Twenty-Seventh Annual Meeting of the American Economic Association), 496-501. Retrieved from https://doi.org/10.1257/aer.p20151024
Dhawan, S. (2020). Online Learning: A Panacea in the Time of COVID-19 Crisis. Journal of Educational Technology Systems, 49(1), 0047239520934018. Retrieved from https://doi.org/10.1177/0047239520934018
Doyle, W. R. (2009). Online Education: The Revolution that Wasn't. Change, 41(3), 56-58.Retrieved from https://doi.org/10.3200/CHNG.41.3.56-58
Fain, P. (2019, January 16). Takedown of Online Education. Retrieved from https://www.insidehighered.com/digital-learning/article/2019/01/16/online-learning-fails-deliver-finds-report-aimed-discouraging
Gupta, N. (2020, May 1). SWAYAM E-learning Portal | Know Courses, Enrolment Process, Certifications. Jagranjosh. Retrieved from https://www.jagranjosh.com/articles/swayam-e-learing-portal-know-courses-certifications-enrolment-process-1585025896-1
Hebbar, N. (2020, March 24). PM Modi announces 21-day lockdown as COVID-19 toll touches 12. The Hindu. Retrieved from https://www.thehindu.com/news/national/pm-announces-21-day-lockdown-as-covid-19-toll-touches-10/article31156691.ece
Kelly, A. P., & Columbus, R. (2020). College in the Time of Coronavirus: Challenges Facing American Higher Education. In American Enterprise Institute.Retrieved from https://www.aei.org/wp-content/uploads/2020/07/College-in-the-Time-of-Coronavirus.pdf
Kenzig, M. J. (2015). Lost in Translation: Adapting a Face-to-Face Course Into an Online Learning Experience. Health Promotion Practice, 16(5), 625-628. Retrieved from https://doi.org/10.1177/1524839915588295
Lee, M. K. O., Cheung, C. M. K., & Chen, Z. (2005). Acceptance of Internet-based learning medium: the role of extrinsic and intrinsic motivation. Information & Management, 42(8), 1095-1104. Retrieved from https://doi.org/https://doi.org/10.1016/j.im.2003.10.007
McPherson, M. S., & Bacow, L. S. (2015). Online higher education: Beyond the hype cycle. Journal of Economic Perspectives, 29(4), 135-153. Retrieved from https://doi.org/10.1257/jep.29.4.135
Mitchell, T. J. F., Chen, S. Y., & Macredie, R. D. (2005). The relationship between web enjoyment and student perceptions and learning using a web based tutorial. Learning, Media and Technology, 30(1), 27-40.Retrieved from https://doi.org/10.1080/13581650500075546
Nanda, P. K. (2019, September 21). India's higher education student population grows by 8 lakh: HRD ministry. Mint. Retrieved from https://www.livemint.com/education/news/india-s-higher-education-student-population-grows-by-8-lakh-hrd-ministry-1569081600712.html
Rahman, A. (2021). Using Students ' Experience to Derive Effectiveness of Induced Emergency Online Learning at Undergraduate Level : Evidence from Assam Higher Education for the Future, 8(1), 71-89.Retrieved from https://doi.org/10.1177/2347631120980549
Sahin, I., Shelley, M., Journal, S., July, N., & Shelley, M. (2008). Considering Students ' Perceptions : The Distance Education Student Satisfaction Model. Journal of Educational Technology & Society, 11(3), 216-223.
SynEd. (2019). Education as Commodity: The Case Against Online Education: The Quarterly Review of Innovative Applications in Alternative Education. Retrieved from https://syned.org/wp-content/uploads/reportOUT/Report_OUT_2020Q1.pdf
Tilak, J. B. G. (2014). Private higher education in India. Economic and Political Weekly, 49(40), 32-38.Retrieved from https://doi.org/10.1177/2347631114558192
Tilak, J. B. G. (2015). Higher Education in South Asia: Crisis and Challenges Higher Education in South Asia : Crisis and Challenges. Social Scientist, 43(1/2), 43-59.
www.ugc.ac.in. (2020). No Title. Retrieved from https://www.ugc.ac.in/pdfnews/7248697_UGC-Advisory---Permission-to-work-from-home-in-view-of-COVID-19.pdf
Zhiting, Z., Xiaoqing, G., & Qiyun, W. (2003). A Panorama of Online Education in China.Education al Technology, 43(3, Special Issue: Onine Learning and Information Technology in the Asia Pacific Region: Perspectives, Issues and Divides), 22-27.
[i] Details about University Grants Commission can be
taken from its website: https://www.ugc.ac.in
[ii] The following document details some of the FAQs about
the SWAYAM initiative: https://www.aicte-india.org/sites/default/files/FAQ_SWAYAM.pdf
|
|
 This work is licensed under a: Creative Commons Attribution 4.0 International License
© IJETMR 2014-2021. All Rights Reserved.