
|
|
|
|
Hyperspectral Image Band Selection based on Subspace ClusteringZhijun Zheng 1 1 School of Information and Electronic Engineering, Zhejiang University of Science and Technology, China |
|
||
|
|
|||
|
Received 22 July 2021 Accepted 08 August 2021 Published 24 August 2021 Corresponding Author Zhijun
Zheng, zjzheng9999@163.com DOI 10.29121/ijetmr.v8.i8.2021.1014 Funding:
This
research received no specific grant from any funding agency in the public,
commercial, or not-for-profit sectors. Copyright:
© 2021
The Author(s). This is an open access article distributed under the terms of
the Creative Commons Attribution License, which permits unrestricted use, distribution,
and reproduction in any medium, provided the original author and source are
credited.
|
ABSTRACT |
|
|
|
Aiming
at the problems in hyperspectral image classification, such as high
dimension, small sample and large computation time, this paper proposes a
band selection method based on subspace clustering, and applies it to
hyperspectral image land cover classification. This method considers each
band image as a feature vector, clustering band images using subspace
clustering method. After that, a representative band is selected from each
cluster. Finally feature vector is formed on behalf of the representative
bands, which completes the dimension reduction of hyperspectral data. SVM
classifier is used to classify the new generated sample points. Experimental
data show that compared with other methods, the new method effectively
improves the accuracy of land cover recognition. |
|
||
|
Keywords: Hyperspectral Image, High Dimensionality, Subspace Clustering, Feature
Selection, Sparse Optimization 1. INTRODUTION The hyperspectral
sensor can simultaneously obtain the surface image information of continuous
bands to obtain an image cube, in which two dimensions correspond to the
spatial dimension and the third dimension corresponds to the spectral
dimension. The large amount of
information contained in the image cube makes it possible to recognize ground
objects Anzhu Y U, Bing L, Zhipeng X. (2019), Feng Z, Yang S, Wang M. (2019), Fuding Xie, Cunkuan Lei, Fangfei Li. (2019), Gao Q, Lim S, Jia X. (2019), He N, Paoletti M E, Juan Mario Haut (2019). However, because the data dimension is too
high, it increases the temporal and spatial complexity of ground object
classification and recognition. In
addition, due to the small number of labeled training sample points, the
problem of "dimension disaster" is caused, which reduces the
accuracy of pixel classification and recognition. Therefore, dimension reduction becomes the
key to solve the problem. Currently,
there are two kinds of dimension reduction methods: feature selection and
feature extraction. Feature extraction
requires transforming the original data into a new feature space. Compared with feature extraction, feature
selection method only selects a feature subset from the original feature set
to participate in the subsequent classification and recognition task, thus
retaining the physical meaning of the original feature. In hyperspectral classification, features
correspond to spectral bands, so feature selection is also called band
selection. |
|
||


Currently, there are many dimensional-reduction methods
for hyperspectral image classification. For example, the fuzzy
C-means and gray scale optimization method was proposed in literature Jiang X. Linear (2011). The
subsection principal component analysis method was proposed in literature Kefeng Li, Quanzhen Huang (2019). The
salient feature extraction method was proposed in literature Md Rashedul Islam, Boshir Ahmed, Md Ali Hossain (2019). A spectral
spatial hyperspectral image classification method based on multi-scale
conservative smoothing and adaptive sparse representation was proposed in
literature Ren R, Bao W. (2019). Literature
Venkatesan R, Prabu S. (2019) proposed to use deep
learning recursive neural network to classify features of hyperspectral
images. The spectral spatial feature extraction method for
hyperspectral image classification was proposed in literature Wang A, Wang Y, Chen Y (2019).
The above method of band selection is carried out in its original space. In fact, high-dimensional data is usually not evenly distributed in its original space, but in its embedded low-dimensional subspace Wei Li, Yan Huang, C.-C (2017), Xiangpo Wei, Xuchu Yu, Bing Liu (2019). For example, face image data under different illumination Zhang J, Li C G, You C (2019), moving tracks of objects in videos Zhao W, Du S. (2016) etc. Therefore, this paper proposes a hyperspectral image classification method based on subspace clustering. Based on the self-expression property of the data, the sparse representation of each band image is obtained through a global sparse optimization process. Based on the sparse representation, the similarity matrix between the band images is established, and the spectral clustering algorithm is used to cluster the band images. Then, a band is selected from each category to form a subset of bands, and the dimension reduction of hyperspectral data is completed. SVM classifier is used to classify and identify ground objects on the dimensionless sample points. The experimental data show that the new method can effectively improve the accuracy of ground object recognition compared with other band selection methods.
2. Hyperspectral image classification process
The space-borne hyperspectral imager is able
to capture spectral signals from the earth's surface in different bands as it
travels along the geostationary satellite orbit. Because the
absorptance and reflectance of signals in the same band are different for
different substances on the surface, the spaceborne hyperspectral imager
obtains two-dimensional images of different bands, and two-dimensional images
of all bands constitute a data cube, as shown in Figure 1.
The left side of Figure 1 represents a hyperspectral image data cube, and each layer in the figure corresponds to a two-dimensional image of a band. The cube has three dimensions, I, J and K. I and J represent the length and width of the two-dimensional image of the band. K stands for spectral dimension. Each pixel in the 3D data can be regarded as the reflection intensity of a surface substance (such as soil, desert, city, etc.) to different bands of spectral signals. Because different substances have different reflectance to spectral signals of different bands, the relationship curve between spectral bands and spectral values of pixels can be drawn, which is called spectral curve. According to different spectral curves, different surface materials in hyperspectral images can be classified. A waveband image signal is represented as bk. The spectral curve of a pixel is represented as a vector p of K dimensions.
|
|
|
Figure 1 Hyperspectral image
classification process |
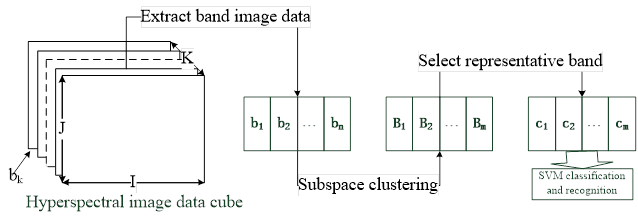
Given a hyperspectral image data set B=[b1,b2,...,bn],
where each column represents the image data of a band, the subspace clustering
method is used to cluster the image data of all bands to obtain the clusters {B1,B2,...Bm}.
And then the cluster center is selected as the representative band ci
in each clusters to form the band subset {c1,c2,...cm},
from which the hyperspectral pixel features p are constructed. Thus,
the dimension reduction of hyperspectral image pixel features is completed, and
the hyperspectral pixels are classified and recognized by SVM classification
method on the dimensional-reduction data.
3.
Band image clustering
In machine learning, signal and image processing,
computer vision, pattern recognition and other applications, high-dimensional
data is everywhere. Images have millions of pixels, video data has
millions of data frames, and text data has thousands of
features. High-dimensional data not only increases the spatial and
temporal complexity of the algorithm, but also reduces the accuracy of
classification and recognition, which is commonly called the "dimensional
disaster" problem. However, high-dimensional data are usually
not evenly distributed in the feature space, but in the embedded
low-dimensional subspace. Finding the low-dimensional subspace is not only
beneficial to reduce the space-time complexity of the algorithm, but also can
improve the accuracy of classification and recognition. In this
paper, each band image is regarded as a data point and subspace clustering
method is used to cluster the band image data. Then, a
representative band is selected from each class to form a subset of the band to
realize dimension reduction of hyperspectral image data.
Assume
that U={u1,u2,…,um}
represents linear subspace, where ui represents the ith
subspace. The dimensions of the subspace are represented as D={d1,d2,…,dm},
where, the dimensions of the ith subspace are represented as di. The
image data of all bands are represented as B=[b1,b2,...,bn],
where bi represents the image data of the ith band.
Subspace clustering algorithm can calculate the number and dimension of subspace, and can cluster the original band image data. The clustering process is divided into two steps. Firstly, for each band image, a global sparse optimization method is used to find the information encoding in the subspace. Then, the similarity matrix is constructed with the information, and the original data is clustered by spectral clustering method.
3.1.
GLOBAL SPARSE OPTIMIZATION
According
to the self-expression attribute of data, the image of each band can be
represented as a linear combination of the images of other bands: ![]() . Among
them,
. Among
them, ![]() . When
the number of band images in subspace is larger than the subspace
dimension
. When
the number of band images in subspace is larger than the subspace
dimension ![]() , the
solution of this problem is not unique. Among all the solutions,
there is a sparse solution whose non-zero elements correspond to data points
from the same subspace, and whose number of non-zero elements corresponds to
the dimensions of the subspace
, the
solution of this problem is not unique. Among all the solutions,
there is a sparse solution whose non-zero elements correspond to data points
from the same subspace, and whose number of non-zero elements corresponds to
the dimensions of the subspace ![]() . That
is, a band image data point from the
. That
is, a band image data point from the ![]() dimension subspace
dimension subspace ![]() can be
represented as a linear combination of
can be
represented as a linear combination of ![]() other band images from the subspace
other band images from the subspace ![]() . In
order to obtain this sparse solution, the design optimization problem is as
follows:
. In
order to obtain this sparse solution, the design optimization problem is as
follows:
![]() Equation
1
Equation
1
Therein,![]() represents
represents
![]() norm.
For all band images, the global sparse optimization problem is designed as
follows:
norm.
For all band images, the global sparse optimization problem is designed as
follows:
![]() Equation 2
Equation 2
Therein,![]() is the coefficient matrix, each column of which corresponds
to a sparse representation of a band image.
is the coefficient matrix, each column of which corresponds
to a sparse representation of a band image. ![]() is the diagonal element of the matrix
is the diagonal element of the matrix ![]() .
.
3.2.
Spectral clustering
The sparse representation ![]() of each band image data
of each band image data ![]() is obtained by optimizing the problem (2). Non-zero elements of
is obtained by optimizing the problem (2). Non-zero elements of ![]() correspond to data
points from the same subspace, and the number of non-zero elements corresponds
to the dimensions of the subspace. With these sparse expression vectors,
the spectral clustering method can be used to cluster the band image. The
undirected weighted graph is first established
correspond to data
points from the same subspace, and the number of non-zero elements corresponds
to the dimensions of the subspace. With these sparse expression vectors,
the spectral clustering method can be used to cluster the band image. The
undirected weighted graph is first established ![]() ,
wherein,
,
wherein, ![]() is the set of
vertices, each vertex corresponds to a band image data point.
is the set of
vertices, each vertex corresponds to a band image data point. ![]() is the set of edges, each edge
is the set of edges, each edge ![]() has a weight
has a weight ![]() that represents the
similarity of the vertices
that represents the
similarity of the vertices ![]() and
and![]() . All the similarities form the similarity
matrix
. All the similarities form the similarity
matrix ![]() , which is a non-negative symmetric matrix. Let
, which is a non-negative symmetric matrix. Let
![]() ,
The similarity of the vertices
,
The similarity of the vertices ![]() and
and![]() is defined as
is defined as![]() . On the basis of weighted graph and similarity matrix,
spectral clustering method is used to cluster the band image data. The pseudo-code
of subspace clustering based band Selection algorithm (SCBS) is as follows:
. On the basis of weighted graph and similarity matrix,
spectral clustering method is used to cluster the band image data. The pseudo-code
of subspace clustering based band Selection algorithm (SCBS) is as follows:
Algorithm
1:SCBS
Input: Collection of images in hyperspectral image data
![]() ;
;
Step 1: Solve the global sparse optimization problem
(2) and obtain the sparse representation ![]() of the band
image;
of the band
image;
Step 2: Construct undirected weighted graph ![]() ,Calculate its similarity matrix
,Calculate its similarity matrix ![]() ;
;
Step 3: On the basis of
similarity matrix, spectral clustering algorithm is applied to obtain band
image clustering ![]() ;
;
Step 4: The cluster center of each cluster is selected
to form the band feature subset ![]() ;
;
Output: Feature set of selected bands ![]() .
.
4. RESULTS AND DISCUSSIONS
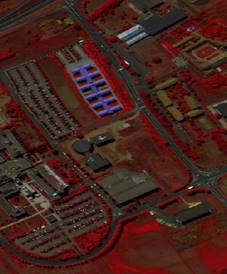
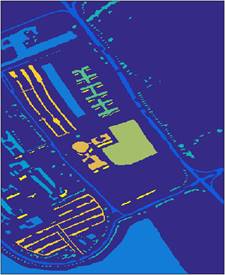
In order to verify the effectiveness of the hyperspectral image classification method (SCBS) based on subspace clustering, experiments were carried out on real hyperspectral data sets. The hyperspectral data set Pavia University was selected. Pavia University data is hyperspectral data taken by the German Reflective Optics Spectrographic Imaging System (ROSIS-03) on the University of Pavia, Italy. The spectral imager can continuously image 115 bands in the wavelength range of 0.43 to 0.86μm, and the spatial resolution of the image is 1.3m. Among them, 12 bands are eliminated due to the influence of noise, so generally the image formed by the remaining 103 spectral bands is used. The size of this data is 610×340, so it contains a total of 207,400 pixels. However, it contains a large number of background pixels and only 42,776 pixels containing ground objects. These pixels contain a total of 9 types of ground objects. These include trees, Asphalt roads, Bricks, Meadows, etc., as shown in Table 1. Figure 2(a) is the pseudo-color image extracted from the three bands (80,60 and 20) and superimposed by the two-dimensional matrix as the three channels of the RGB image, and Figure 2(b) is the real ground object annotation map. There are altogether 9 feature categories, as shown in Table 1.
|
|
|
|
(a) pseudo-color image (80,60,20) (b)
real ground object annotation map Figure 2 Pavia University data set |
|
For hyperspectral image data, the number of labeled
training sample points is different for each category, so the training set is
selected in a certain proportion for each category, and the number of test set
samples is 200. Then different dimension reduction methods are used
to reduce the training set and test set. Finally, the SVM classifier
was trained with the dimension reduction training set, and the SVM test was
carried out with the dimension reduction test set. Finally, the classification
accuracy of each dimension reduction method was obtained, which was repeated
for 10 times to get the average value. KPCA (Principal component
analysis) method and SPCA-NMI method in literature Kefeng Li, Quanzhen Huang (2019) were selected for
comparison with the method in this paper.
|
Table 1 Features of
Pavia University data set |
||
|
The category number in the data
set |
Class name |
the
number of labeled training sample points |
|
1 |
Asphalt |
6631 |
|
2 |
Meadows |
18649 |
|
3 |
Gravel |
2099 |
|
4 |
Trees |
3064 |
|
5 |
Painted metal sheets |
1345 |
|
6 |
Bare Soil |
5029 |
|
7 |
Bitumen |
1330 |
|
8 |
Self-Blocking Bricks |
3682 |
|
9 |
Shadows |
947 |
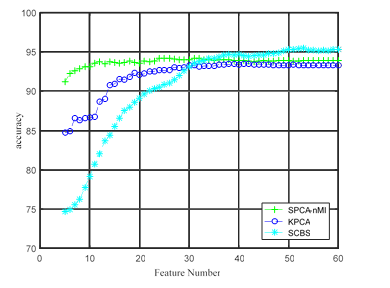
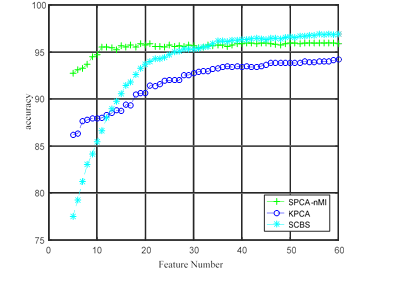
In the experiment, 5%, 10% and 15% labeled training sample points from each feature category were selected from the Pavia University data set to constitute the training set. The dimensionality reduction feature number ranges from 5 to 60. Three experimental results were obtained, as shown in Figure 3 (a) is the classification accuracy graph of 5% training sample set, Figure 3(b) is the classification accuracy graph of 10% training sample set, and Figure 3 (c) is the classification accuracy graph of 15% training sample set.
|
|
|
(a)
Classification accuracy graph of 5% training sample set |
|
|
|
(b) Classification accuracy graph of 10% training
sample set |
|
|
|
(c)
Classification accuracy graph for the 15% training sample set Figure 3 Relationship between feature
number and SVM classification accuracy |
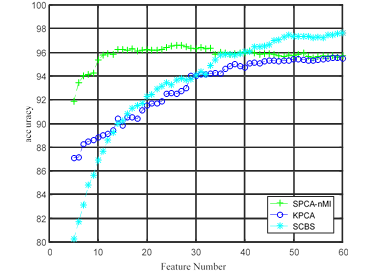
It can be seen from the relation diagram of
classification accuracy in Figure 3 that:
1)
The classification accuracy of all kinds of
algorithms increases with the increase of the number of training samples. This
is because the more training samples, the closer the support vector selected by
the SVM classification model is to the classification boundary, and the better
the classification hyperplane can be found, thus improving the classification
accuracy.
2)
The classification accuracy of SCBS method
proposed in this paper is relatively low at the beginning, because SCBS is a
feature selection method. When the number of features is small, the
discriminant ability of the features selected by the new method is limited, so
the classification accuracy is low. The other two methods are
PAC-based data dimension reduction methods. The principal component selected by
them represents the maximum variance direction of the original data, and
integrates the discriminant ability of all features, so they can show high
classification accuracy when the number of features is
small. However, with the increase of feature number, the
classification accuracy based on PCA method improves slowly, and even slightly
decreases, because the discriminant ability of the selected principal components
is rapidly weakened, and the correlation between features is not taken into
account, which leads to the decrease of classification accuracy. The
classification accuracy of SCBS method has been steadily
improved. After the feature number is greater than 30, SCBS
gradually surpasses the other two algorithms. It shows that the
selected features of SCBS method gradually cover the representative feature
sets, so the SCBS method has high discriminant ability. Moreover,
the subspace learning method can find the subspace embedded in the data and
avoid the interference between the features, so the classification accuracy has
been on the rise.
5. CONCLUSIONS
In order to solve the "dimensional disaster" problem of hyperspectral image data, a hyperspectral image classification method based on subspace clustering is proposed. In the new method, the waveband images are regarded as data points. According to the self-representation characteristics, the sparse representation of each data point is established by solving a global sparse optimization problem, and then the similarity matrix between the data points is constructed. Based on the similarity matrix, the spectral clustering algorithm is used to cluster the band images, and the cluster center of each class is selected as the representative band to form the band subset, and the hyperspectral pixel features are established by the band subset, and then the classification and recognition are carried out. Experimental data show that the new method improves the accuracy of hyperspectral image classification.
REFERENCES
Anzhu Y U, Bing L, Zhipeng X. (2019) Salient Feature Extraction Method for Hyperspectral Image Classification. Acta Geodaetica et Cartographica Sinica. Retrieved from https://doi.org/10.11947/j.AGCS.2019.20180499
Feng Z, Yang S, Wang M. (2019) Learning Dual Geometric Low-Rank Structure for Semisupervised Hyperspectral Image Classification. IEEE Transactions on Cybernetics, (99),1-13. Retrieved from https://doi.org/10.1109/TCYB.2018.2883472
Fuding Xie, Cunkuan Lei, Fangfei Li. (2019) Unsupervised Hyperspectral Feature Selection based on Fuzzy C-means and Grey Wolf Optimizer. International Journal of Remote Sensing, 40(9),3344-3367. Retrieved from https://doi.org/10.1080/01431161.2018.1541366
Gao Q, Lim S, Jia X. (2019) Spectral-Spatial Hyperspectral Image Classification Using a Multiscale Conservative Smoothing Scheme and Adaptive Sparse Representation. IEEE Transactions on Geoscience and Remote Sensing, (99),1-13. Retrieved from https://doi.org/10.1109/TGRS.2019.2915809
He N, Paoletti M E, Juan Mario Haut (2019). Feature Extraction With Multiscale Covariance Maps for Hyperspectral Image Classification. IEEE Transactions on Geoscience & Remote Sensing, 57(2),755-769. Retrieved from https://doi.org/10.1109/TGRS.2018.2860464
Jiang X. Linear (2011) Subspace Learning-Based Dimensionality Reduction. IEEE Signal Processing Magazine, 28(2),16-26. Retrieved from https://doi.org/10.1109/MSP.2010.939041
Kefeng Li, Quanzhen Huang (2019). Cross-pose Face Recognition by Integrating Regression Iteration and Interactive Subspace. Journal on Wireless Communications and Networking, (1),1-8. Retrieved from https://doi.org/10.1186/s13638-019-1429-x
Md Rashedul Islam, Boshir Ahmed, Md Ali Hossain (2019). Feature Reduction Based on Segmented Principal Component Analysis for Hyperspectral Images Classification. International Conference on Electrical, Computer and Communication Engineering (ECCE). IEEE, 2019. Retrieved from https://doi.org/10.1109/ECACE.2019.8679394
Ren R, Bao W. (2019) Hyperspectral Image Classification Based on Belief Propagation with Multi-features and Small Sample Learning. Journal of the Indian Society of Remote Sensing, 47(5),1-10. Retrieved from https://doi.org/10.1007/s12524-018-00934-y
Venkatesan R, Prabu S. (2019) Hyperspectral Image Features Classification Using Deep Learning Recurrent Neural Networks. Journal of Medical Systems, 43(7). Retrieved from https://doi.org/10.1007/s10916-019-1347-9
Wang A, Wang Y, Chen Y (2019). Hyperspectral Image Classification based on Convolutional Neural Network and Random Forest. Remote Sensing Letters, 10(11),1086-1094. Retrieved from https://doi.org/10.1080/2150704X.2019.1649736
Wei Li, Yan Huang, C.-C (2017). Jay Kuo. Video-Based Human Motion Capture Data Retrieval via Normalized Motion Energy Image Subspace Projections. IEEE International Conference on Multimedia and Expo (ICME) Worksohp on Emerging Multimedia Systems and Applications. IEEE,1-7. Retrieved from https://doi.org/10.1109/ACCESS.2020.3030258
Xiangpo Wei, Xuchu Yu, Bing Liu (2019). Convolutional Neural Networks and Local Binary Patterns for Hyperspectral Image Classificatio. European Journal of Remote Sensing, 52(1),448-462. Retrieved from https://doi.org/10.1080/22797254.2019.1634980
Zhang J, Li C G, You C (2019). Self-Supervised Convolutional Subspace Clustering Network, CVPR,1-10. Retrieved from https://doi.org/10.1109/CVPR.2019.00562
Zhao W, Du S. (2016) Spectral-Spatial Feature Extraction for Hyperspectral Image Classification: A Dimension Reduction and Deep Learning Approach. IEEE Transactions on Geoscience and Remote Sensing, , 54(8),4544-4554. Retrieved from https://doi.org/10.1109/TGRS.2016.2543748
|
|
 This work is licensed under a: Creative Commons Attribution 4.0 International License
© IJETMR 2014-2021. All Rights Reserved.