
COPPER OXIDE THIN FILM SYNTHESIS, CHARACTERIZATION AND APPLICATION AS CATHODE IN PHOTOELECTROCATALYTIC CELL FOR METHYL ORANGE DEGRADATION
Abstract
A copper oxide thin film was synthesized through a copper sheet annealing process that was carried out using a gas stove, furnace and 1000 W tungsten lamp. The product and its photocurrent response were measured using a potentiostat and then characterized by XRD, SEM and EDX. Furthermore, the copper oxide was applied as a photocathode in a photoelectrochemical cell with Platinum (Pt) as the anode for methyl orange degradation, and the thin film annealed at 60 sec produced the highest current density. According to XRD and EDX results, copper oxide structure was dominated by Cu2O, while SEM showed the presence of a Cu2O porous surface. Methyl orange solution degradation also showed the best result for the copper oxide annealed at 60 sec and in all pH variations, while the best degradation was obtained at pH 1.
Keywords
Cu2O, Photocurrent, Methyl Orange, Degradation
INTRODUCTION
Contamination by organic pollutants such as dyes, pesticides, and hazardous toxic chemicals is increasing due to the rapid industrial development (Ismail et al., 2019; Kasinathan, Kennedy, Elayaperumal, Henini, & Malik, 2016; Mageshwari, Nataraj, Pal, Sathyamoorthy, & Park, 2015; Saikia et al., 2015). Organic dyes are one of the main sources of industrial wastewater. These organic dye pollutants are highly toxic and have considerable detrimental effects on human health, the environment and aquatic ecosystems (Ismail et al., 2019; Khan, Kamal, Ali, Asiri, & Khan, 2019; Ramezani, Zahedi, Bahrami, & Nemati, 2019; Sharma & Bhattacharya, 2017). Amongst various pollutants, methylene blue and methyl orange are the main ones found in wastewater (John, Tharayil, & Somaraj, 2017; Kushwaha, Gupta, & Chattopadhyaya, 2014; Sahu, Satpati, & Mohapatra, 2019). Methyl orange (MO) is an intensely colored toxic compound used in textile industry. It changes from red (at pH 3.1) to orange-yellow (at pH 4.4) (John et al., 2017). A number of physical and chemical techniques have been reported for the removal of dye compounds such as adsorption, biodegradation, ozonation, filtration, coagulation and advanced oxidation processes such as Fenton's catalytic reaction and Semiconductor photocatalysts (Aggarwal, 2016). One of the methods for organic dye waste treatments is using photocatalytic process with semiconductors as catalysts and it has received great attention during the last three decades (Aggarwal, 2016; Kuriakose et al., 2017; Kuriakose, Avasthi, & Mohapatra, 2015; Muthirulan, Devi, & Sundaram, 2017; Sahu, Choudhary, Khan, Pandey, & Mohapatra, 2019; Sahu, kuriakose, Singh, Satpati, & Mohapatra, 2018; Singh et al., 2017; Singh, 2015; Singh, Satpati, & Mohapatra, 2017).
Copper oxide as a p-type semiconductor provides promising results for solar energy conversion (Abd-Ellah, Thomas, Zhang, & Tong, 2016; Sullivan, Zoellner, & Maggard, 2016; Wick & Tilley, 2015), photoelectrochemical water splitting for hydrogen production (Luo et al., 2016; Ma, Hofmann, Litke, & Hensen, 2015; Wang et al., 2016) and photoelectrocatalytic degradation for hazardous waste treatments (Koiki & Arotiba, 2020; McMichael, Fernández-Ibáñez, & Byrne, 2021; Muthukumaran et al., 2020; Safarvand, Naser, Samipourgiri, & Arjmand, 2020; Yu, Shu, Zhou, Ren, & Liu, 2018). Furthermore, Cu2O is cheaply produced, abundant, environmentally friendly, and less toxic compared to other narrow bandgap semiconductors (Guzmán, Farkhondehfal, Tolod, Hernández, & Russo, 2019; Wick et al., 2015).
Semiconductor photocatalysts have been used as a promising method for the removal of organic contaminants because its not only degrade but also cause complete mineralization of pollutants to H2O, CO2 and mineral acids. In photoelectrocatalytic dye degradation, Cu2O semiconductor when irradiated with photon energy greater than its bandgap, electrons (e-) are excited from the valence band (VB) to the conduction band (CB) while creating holes (h+) in the valence band. A small percentage of electrons and holes migrate to the semiconductor surface and participate in redox reactions to cause dye decomposition that is converted into non-toxic end products (Cui, Yang, & Zhao, 2017) or produce highly reactive superoxide radicals (O2−), while holes in VB react with adsorbed H2O or OH- to form highly reactive superoxide radicals in aqueous solutions (Ismail et al., 2019; Rameshbabu, Kumar, Karthigeyan, & Neppolian, 2016; Sharma et al., 2017).
There are several methods for Cu2O thin film synthesis, namely by electrodeposition (Mahmood, Tezcan, & Kardaş, 2017; Vequizo, Zhang, & Ichimura, 2015; Yang, Xu, Wu, & Diao, 2016), spray pyrolysis (Bi, Wu, Xia, Li, & Zhang, 2019) and spin coating (Eskandari, Sangpour, & Vaezi, 2014; Oku, Yamada, Fujimoto, & Akiyama, 2014). But preparation of Cu2O from Cu sheet with heating at ambient atmosphere have not been done before. Therefore, in this research was aimed to utilize the Cu2O (Copper Oxide) thin film synthesized from copper sheet through an annealing process (using gas stove, furnace, and 1000W lamp) as a photocatalyst for methyl orange degradation. By using simple techniques compared to the existing ones, easier replication of the copper oxide products on a large scale is expected.
MATERIALS AND METHODS
MATERIALS
The chemicals and solvents were obtained from a commercial source (Merck) and used without further treatment. Copper sheet 10 cm x 10 cm was obtained from online shop.
SYNTHESIS OF Cu2O
A copper sheet with dimensions of 5 cm x 1 cm x 0.1 cm was cleaned with acetone. After drying, it was subjected to a variety of heating times. The heaters included an LPG stove, furnace (600 ºC) and 1000 W tungsten lamp. Then, the Cu2O thin film formed on the copper sheet was characterized and used for further experiments.
TESTING AND CHARACTERIZATION
Photocurrent response assessed by current-voltage measurement was used to determine the sample’s ability as a photocathode. The current-voltage was measured using a Potentiostat and Galvanostat (CS-150) with three electrodes. Cu2O sample on the copper sheet was used as working electrode, while platinum and Ag/AgCl were used as anode and reference electrodes, respectively. Then the three were immersed in a 0.1 M Na2SO4 electrolyte solution at pH 9.0. The measurement was carried out with and without irradiation every 5 sec using a 1.5 AM simulated light at the initial potential of 0.5 V to the final -1.0 V (vs. Ag/AgCl) with a scanning rate of 10 mV/s. The measured potential stated as Ag/AgCl was then converted to RHE. Besides, the Cu2O sample was characterized by its surface morphology using SEM, and the chemical elemental composition was determined using EDX (Phenom Pro-X desktop SEM with EDX). XRD analysis [PANalytical X Pert3 Powder X-ray diffractometer (Cu Kα, Ni) filter] was used to identify the crystal structure and grain size.
PHOTOELECTROCATALYTIC DEGRADATION OF METHYL ORANGE
A Cu2O photocathode synthesized at varied heating times and a platinum anode were assembled as shown in Figure 1 .
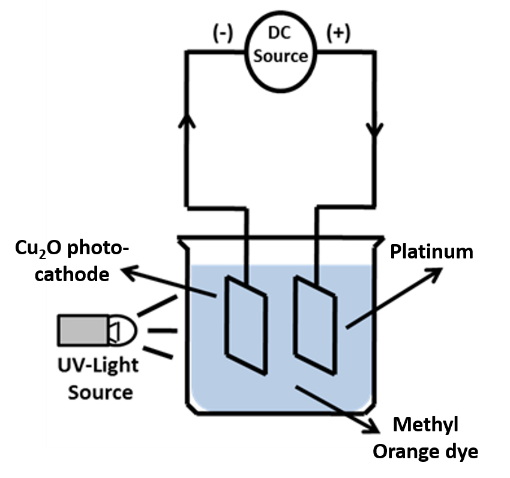
The photocathode of the Cu2O sample and platinum were put in a 50 mL of 5 mg/L methyl orange solution with pH variation of 1, 7, 8 and 12. Then, the degradation process was carried out at 0, 15, 30, 45, 60, 75 and 90 min by irradiation using a 20-Watt UV lamp and a bias potential of 0.5 V. The concentration of methyl orange solution before and after degradation were measured using a UV-Vis spectrophotometer (PG Instruments T60 UV-Vis Spectrophotometer).
RESULTS AND DISCUSSIONS
SYNTHESIS OF Cu2O
Copper sheet which was originally metallic red after heating with stove, turned brick red and formed a blackish colored layer. This color change indicated there had been a change in the copper sheet surface area. Oxygen atoms migration from oxygen gas in the interface area caused physical and chemical interactions on the copper sheet surface to ensure a bond occurs between Cu and O atoms, hence copper oxide is formed as shown in Equation 1 .
CURRENT-VOLTAGE MEASUREMENT
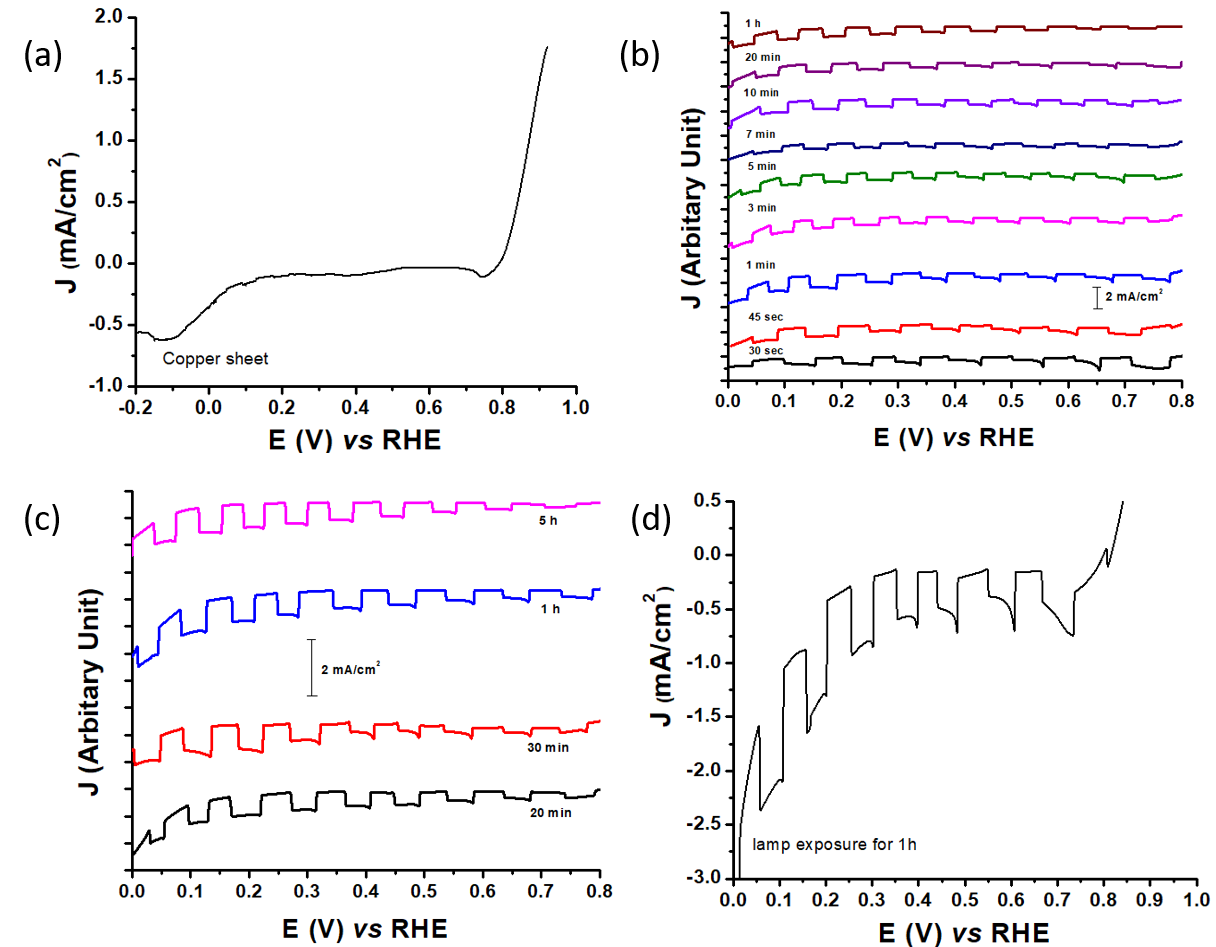
Current-Voltage (J-V) measurement was intended to determine whether the synthesized material provided semiconductive properties by showing the photocurrents. Furthermore, the result for synthesized Cu2O on the copper sheet sample before and after heating can be seen in Figure 2 .
According to Figure 2 (a), the copper sheet produced a little current because the sheet used was not 100% pure as shown in the XRD characterization result. Furthermore, they were heated using a gas stove with time variations as shown in Figure 2 (b). The current density values at 0.185 V vs RHE of copper plates heated for 30, 40, 60, 180, 300, 420, 600, 1200 and 3600 sec were 0.72, 0.86, 1.15, 0.77, 0.72, 0.53, 0.81, 0.72 and 0.78 mA/ cm2, respectively. Those heated using a furnace with time variations are shown in Figure 2 (c). The current density values at 0.13 V vs RHE of copper plate heated for 20 min, 30 min, 1 h and 5 h were 0.78, 1.14, 1.16 and 1.03 mA/cm2, respectively. The one heated using a 1000 W lamp for 1 hour showed a current density value of 0.9 mA/cm2 at 0.2 V vs RHE. Therefore, the copper sheet heated with a gas stove produced a better result than the other heaters because besides producing heat, there was also air presence and as oxygen source to oxidize copper. But, when using a furnace, there was no oxygen source in the heating atmosphere.
CHARACTERIZATION
This was carried out using XRD, SEM and EDX, while the samples utilized were copper sheets and Cu2O with the highest current density value, namely heating with a gas stove for 1 min. The X-ray diffraction data of the samples are shown in Figure 3 .
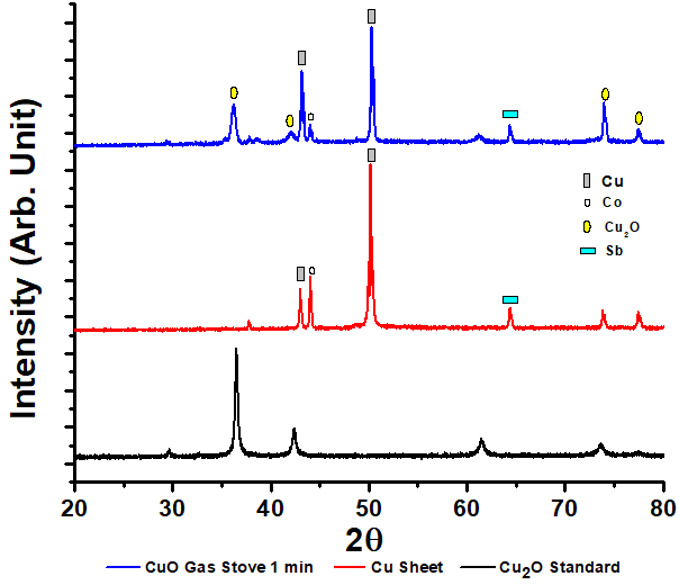
The sample XRD spectra peaks were matched with Cu2O (RRUFF no R050384) and Cu (MATCH no entry 96-151-2505) standard data. Copper sheet samples diffraction pattern showed peaks at 2θ values of 43.013 and 50.153º which almost coincided with the standard peaks at 2θ of 42.980 and 50.100º. This indicated Cu sheet used contained Cu with a crystal size of 52 .47 nm. In addition, the Cu peaks found in the sheet samples at 2θ of 44.030º indicated cobalt (Co) presence based on the standard MATCH no entry 96-901-1619. The Co peaks appearance indicated the Cu sheet used was not 100% pure. The copper oxide sample heated with the gas stove for 60 sec showed the Cu peaks were at 2θ of 43.177 and 50.295º. Besides, some other peaks appeared at the 2θ of 36.202, 42.026. 73.970 and 77.451º which coincide with the standard Cu2O RRUFF no R050384 at 2θ of 36.400, 42.200, 73.500 and 77.500º. This showed that by heating treatment, the copper sheet reacted with oxygen from the air, thereby causing copper oxidation to Cu2O with a crystal size of 30.78 nm. In addition to the Cu and Cu2O peaks, there was one peak at 2θ of 44.030º which indicated cobalt presence based on the standard MATCH no entry 96-901-1619.
SEM-EDX analysis was used to determine the sample surface morphological structure and percentage composition. The samples’ SEM analysis results are presented in Figure 4 .
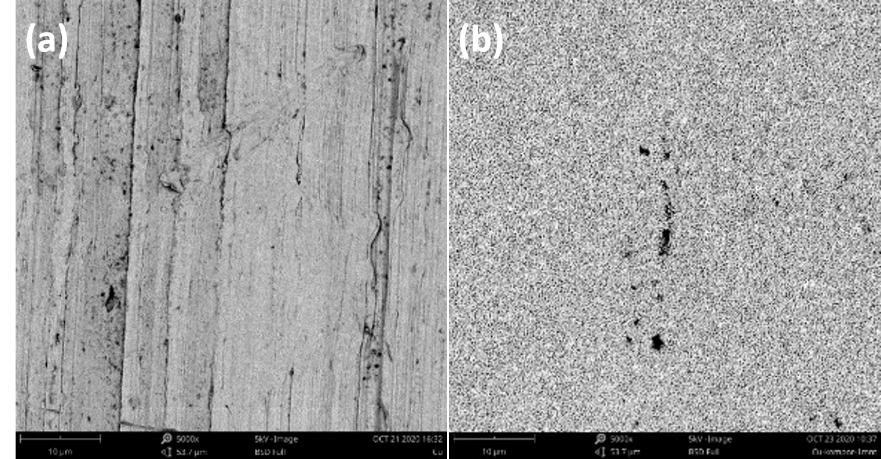
According to Figure 4 , the Cu sheet SEM results showed a smooth surface. But on heating for 60 sec, the copper oxide sample surface morphology turned rough like a clot due to oxygen influence which indicated copper oxide was formed as Cu2O. The oxide formation stage began with interface region molecules dynamics because collisions occurred between Cu and O atoms. Each element composition present in the sample is presented in Table 1 .
|
Sample |
Elemental composition (% Mass) |
|
|
Cu |
O |
|
|
Initial copper sheet |
100 |
0 |
|
Copper sheet after heating 60 sec |
87.06 |
12.94 |
The copper sheet sample EDX analysis results showed only copper element was present, while the sample heated for 60 sec showed there were O elements besides the Cu with a composition of 12.94 and 87.06% respectively. This showed Cu2O was formed on heating for 60 sec as supported by the XRD analysis which proved the Cu2O sample on heating for 60 sec has formed Cu2O peaks on its diffractogram.
METHYL ORANGE (MO) PHOTOELECTROCATALYTIC DEGRADATION USING COPPER OXIDE PHOTOCATHODE
MO maximum wavelength was obtained by scanning from 200 to 800 nm of 5 mg/L MO solution at various pH, and the results are shown in Figure 5 .
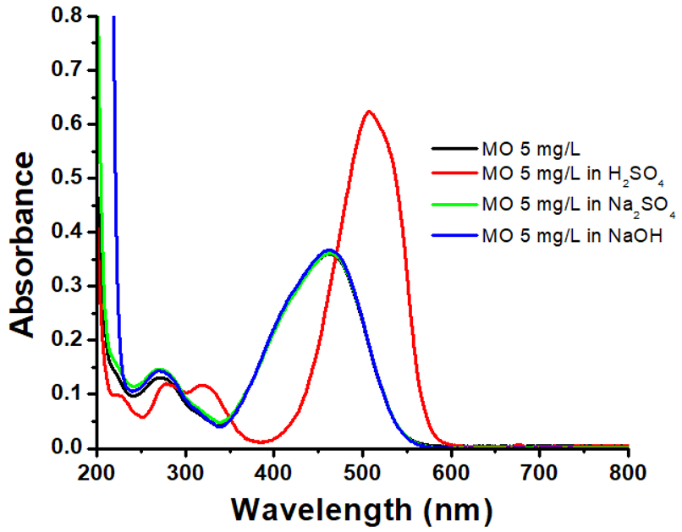
According to Figure 5 , the maximum wavelength of 5 mg/L MO was 462 nm with an absorbance of 0.360. When adjusting the pH to be neutral or alkaline using Na2SO4 or NaOH solution, there was no maximum wavelength shift, but it was still at 462 nm with absorbances of 0.361 and 0.368, respectively. When the pH was adjusted to be acidic using H2SO4, there was a color change from bright orange to red, while the maximum wavelength and absorbance also became 508 nm and 0.623. Methyl orange changed from an azo structure (orange color) to a quinoid (red) with a pH value changing from 4.4 to 3.1. Meanwhile, the maximum absorption peak shifted from 463 nm in almost neutral conditions to 507 nm at pH 2.0, due to lone pair delocalization in the azo group. The MO structural change at different pH also caused an increase in the peak intensity at its maximum absorption wavelength (Oku et al., 2014). A wavelength increase indicated an increase in delocalization.
The degradation process was carried out using 5 mg/L MO solution with a varied pH of 1, 7, 8 and 12, and copper oxide obtained by gas stove heating for 30 sec, 45 sec, 1 min, 3 min and 5 min. This treatment aimed to determine heating time and pH conditions effect on copper oxide ability as a photocathode in methyl orange degradation. The degradation was assessed by measuring the absorbance at 508, 462, 462 and 462 nm according to MO maximum wavelength at pH 1, 7, 8 and 12, respectively.
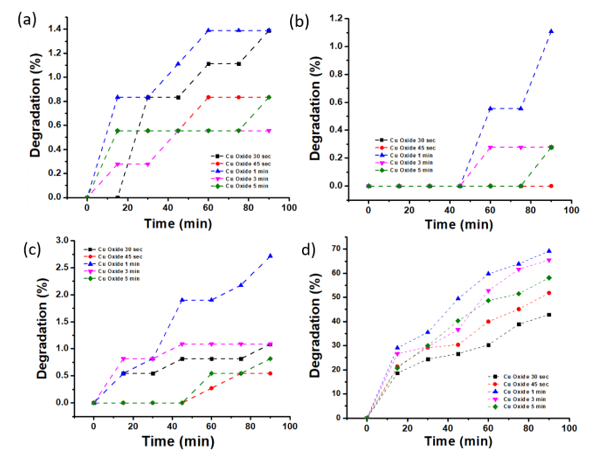
Based on Figure 6 (a) - (d), the highest reduction occurred in copper oxide samples with a heating time of 60 sec and degradation for 90 min. The highest degradation percentage was 69.18% at an acidic pH, followed by 2.72% at an alkaline pH, 1.39% in the original MO conditions (pH 8) and 1.11% in Na2SO4 solution (pH 7). The best degradation at low pH of MO solution can be explained by the copper oxide zeta potential. The zero-point of the pHzpc charge for copper oxide is 9 [40] and the Cu2O surface is abundant with hydroxyl. Therefore, the surface became positively charged (combined with H+) because the pH was lower than pHzpc or negatively charged (when reacting with OH–) because of being greater than pHzpc [41–43]. The positively charged surface accelerated electrons transfer under acidic conditions, hence facilitating electron-hole pairs’ separation. Electrons reacted with the O2 adsorbed on the catalyst surface to produce H2O2. Both H2O2 and h+ (redox potential of 1.8 V and 3.0 V vs. NHE, respectively) are strong oxidants, leading to methyl orange degradation. Although hydroxyl radicals readily form in alkaline media with lots of hydroxyls, OH oxidant power is lower than that of holes. Hence, a low degradation rate was obtained under alkaline conditions. Another reason for methyl orange degradation under acidic conditions was the structural change when the pH was below 3.1. Quinoids have relatively lower bond energies, which are more prone to photodecomposition than azo structures [42, 44]. The irradiation duration also affected the hydroxyl radicals’ amount produced to degrade the dye. The longer the reaction, the more interactions occurred between the photons and photocatalyst. This is consistent with the data that stated 90 min degradation led to the smallest absorbance and largest percentage.
During the process, copper oxide varied in heating time as a photocathode which was illuminated and also experienced holes and electrons generation by light. The electrons reduced water to H2, while the hole migrated to the outer circuit and returned to the solution through the platinum anode and oxidized water to produce OH- which in turn degraded methyl orange into H2O, CO2 and other by-products. Copper oxide ability to vary the heating time was also proven by current density appearance when PEC measurements were carried out. This emerging density of currents showed copper oxide produced electron-hole pairs to reduce water. Based on the measurement results of destruction and current density in Figure 6 and Figure 2 , the copper oxide with 60sec heating time produced the highest current density value, namely 1.15 mA/cm2 at 0.185 V versus RHE and the highest degradation results in the methyl orange solution of all pH variations. This showed copper oxide with a heating time of 60 sec was the optimum sample for methyl orange degradation. The Cu sheet by heating on a gas stove for 60sec in oxygen and heat presence, converted copper into a copper oxide layer, namely Cu2O which was formed on top of the Cu sheet. The increased heating time caused the oxide layer that formed or stuck to the Cu sheet surface to peel off because of being too thick. Meanwhile, the time was too short, causing the copper oxide layer formation to be not optimal.
CONCLUSION
Copper oxide with 60 sec heating time produced the highest current density value, namely 1.149 mA/cm2 at 0.185 V versus RHE and the highest degradation results in methyl orange solution of all pH variations. The degradation values for copper oxide heated for 60 sec were 69.18, 2.72, 1.39, and 1.11% at pH 1, 12, 8, and 7, respectively. Conclusively, the best degradation of methyl orange was obtained at pH 1.
ACKNOWLEDGEMENTS
The authors are grateful for the fund provided through the National Budget for the Faculty of Science and Mathematics, UNDIP Fiscal Year 2020 No: 2002/UN7.5.8/PP/2020.
