
INDEX AND RISK LEVEL OF LANDSLIDES ON ROAD AND BRIDGES LOCATED ON NATIONAL ROADS (CASE STUDY: KERINCI DISTRICT AND SUNGAI PENUH CITY, JAMBI PROVINCE)
Abstract
The regency of Kerinci and The city of Sungai Penuh are among the areas prone to landslides, which can impact roads and bridges on national roads. This study aims to determine the index and risk level of landslides on roads and bridges located on national roads in both regions. The index and risk level assessment are carried out by analyzing disaster risk factors, namely: hazard, exposure, vulnerability, external context and capacity. Assessment methods and variables are taken based on the Guidelines for the Implementation of Risk Analysis for Natural Disasters Affecting Roads and Bridges. The mapping of landslide risk based on the Geographical Information System (GIS) is compiled based on scoring and weighting all parameters, as well as an overlay among all constituent parameters. Based on the sampling results of ten samples of national road sections in the Kerinci Regency and Sungai Penuh City, the risk level of hazard, exposure, vulnerability, external context and road management capacity is divided into two classes, namely the Low class about 7.19 km (= 8.72 %) with seven short roads located within the city and the Medium class, which is 75.31 Km (= 91.28 %), with three roads connecting the cities.
Keywords
GIS, Landslides, National Roads, Risk Assessment
INTRODUCTION
The economic growth of a developing country depends on a good level of road transportation that be accessed to facilitate business activities (Dimnwobi, Nwokoye, Ekesiobi, & Igbanugo, 2017). There is a causal relationship between investment in transportation infrastructure and economic development (Aschauer, 1991). Transport infrastructure has a long-term positive impact on economic development (Alam, Li, Baig, Ghanem, & Hanif, 2020). Road construction, as a form of human activity, has an influence on landslides. Road construction that results in changes in slope angle and additional loads on the slopes, as well as steep topography and high rainfall, causes a high potential for landslides (Safeland, 2011).
Disaster is an event or series of events that threatens and disrupts the life and livelihood of the community which is caused either by natural factors and / or non-natural factors as well as human factors resulting in casualties, environmental damage, property loss and psychological impacts (Republic, January 11, 2021). Landslide is a form of erosion where soil displacement occurs at one time and involves a large volume of soil. Landslides occur due to the sliding of a volume of soil above an impermeable layer that is water-saturated (Munir, 2006). Indonesia is often hit by landslides due to rainfall and earthquakes (Cepeda, Smebye, Vangelsten, Nadim, & Muslim, 2010).
Kerinci Regency is one of the areas in Jambi Province, which is prone to landslides, floods and other disasters. 75 percent of the Kerinci area is categorized as disaster-prone (Karim, Lova, Budaya, Yanita, & Ahmad, 2019). Many disasters have occurred in Kerinci, especially entering the rainy season. Landslides are disrupting traffic flow in Kerinci Regency as it covers the road. Therefore, special attention is needed to minimize the occurrence of landslides in Kerinci Regency and Sungai Penuh City.
There are 7 national roads in Kerinci Regency and 5 national roads in Sungai Penuh City. There were 13 landslides in 2020 and 2021 on national road sections in both Kerinci regency and Sungai Penuh City (Jambi_National_Road_Implementation_Agency, 2021). The frequency of continuous landslides is found on the Sanggaran Agung-Sei Penuh road section with a length of 16.77 kilometers, which is the main transportation route connecting Kerinci district with Sungai Penuh City; the Sungai Penuh-Siulak Deras/Letter W road section with 22.24 kilometers and Sungai Penuh-West Sumatra border with a length of 36.30 kilometers which is the main transportation route that connects the City of Sungai Penuh with West Sumatera Province. The road section is a national road as stipulated in the (Decree of the Minister of Public Works and Public Housing of the Republic of Indonesia Number 248/KPTS/M/2015 concerning the Designation of Roads in the Primary Road Network according to their Function as Arterial Roads (JAP) and Collector-1 Roads, 2015), as it has a strategic function in supporting connectivity between provinces.
Geographical, geological and hydrological conditions of Kerinci Regency and Sungai Penuh City are natural factors that cause landslides along these national roads, and these natural phenomena have a negative impact on road users. One of the most effective methods to prevent and minimize damage due to landslides is to carry out comprehensive planning and risk assessment (Skrzypczak, Kokoszka, Pytlowany, & Radwański, 2020).The high potential for landslides in Kerinci Regency requires a risk analysis of landslides. Therefore, to minimize the occurrence of disasters that will cause losses in the form of material and property and the safety of the surrounding population, it is necessary to analyze the risk of landslides in the area to determine the potential distribution of landslides, especially on national roads. The risk management has also been included as one of the variables in the analysis of green road project management (Chang & Lin, 2018).
(Ministry_Of_Public_Works, 2014) provide an implementation guideline used to explain the steps taken in carrying out a natural disaster risk analysis for roads and bridges such as providing guidance for road work units/Technical Implementing Units in conducting risk analysis in order to obtain an overview of the risk level of road network elements as input for road and bridge planners in mitigating natural disasters and providing guidance in making natural disaster risk maps for road infrastructure and bridges. In this guideline, the assessment uses the risk index concept. Risk assessment is carried out to find out how much damage or loss is likely to be experienced in the event of a disaster. The natural disaster risk index model is divided into five component factors in the risk function for each type of threat, namely the hazard factor, the exposure factor, the vulnerability factor, the external context factor and the capacity factor. The threats considered are the threat of earthquakes, floods, volcanic eruptions, landslides and tsunamis. Sub contractors are the components of the factors that affect each factor and indicators are a parameter used to describe the influence of factors on the value of the risk index. There are three classification results for each indicator, namely the low, medium and high.
METHODOLOGY
The research that will be carried out is a risk study to find out how much the possibility of damage or loss that will be experienced in the event of a landslide, this study uses the concept of a risk index. The risk index concept is an assessment done by indicating a specific scale or rating of disaster risk. Each indicator is given a certain predetermined description and is described by an index value. Each indicator index value will contribute to the landslide risk index value.
The data entered will be assessed in the form of an index value, which is the conditioning of each indicator in the form of a certain value, which is not the actual value, but is a comparison of the conditions of each indicator. Each condition/characteristic of the indicator has a different index value, which the results will be displayed in 3 (three) classifications, namely: low, medium and high. The Landslide Disaster risk index model is used as the risk analysis. The list of indicators for each sub-factor and factor of landslide can be seen in Table 1 .
From Table 1 above, it can be seen that each indicator has an equal contribution to the risk index value. The weight of the indicator is obtained from the following :
Notes:
w = Weight of indicator
n = number of indicator
|
FACTOR |
Weight %*) |
SUB FACTOR |
Weight %**) |
Indicator Code |
Weight %***) |
INDICATOR |
|
A |
B |
C |
D |
E |
F |
G |
|
HAZARD |
12.50 |
Soil Vulnerability Index |
12.50 |
L.1 |
4.17 |
Locations of roads on the map of ground motion threat |
|
|
|
|
|
L.2 |
4.17 |
Daily rainfall |
|
L.3 |
4.17 |
The frequency of landslides around the road |
||||
|
EXPOSURE |
16.67 |
Physical |
8.33 |
L.4 |
4.17 |
Road length |
|
L.5 |
4.17 |
Total length of the bridge |
||||
|
|
|
Population |
4.17 |
L.6 |
4.17 |
Traffic volume |
|
|
|
Economics |
4.17 |
L.7 |
4.17 |
Product Domestic Regional Bruto (PDRB) of Province/District/City located nearby roads |
|
VULNERA BILITY |
41.67 |
Physical |
41.67 |
L.8 |
4.17 |
Existing road conditions |
|
L.9 |
4.17 |
Existing bridge conditions |
||||
|
L.10 |
4.17 |
Road terrain classification |
||||
|
L.11 |
4.17 |
Number of bridges on roads |
||||
|
|
|
L.12 |
4.17 |
Subgrade type |
||
|
|
|
|
|
L.13 |
4.17 |
Soil capacity around the bridge |
|
L.14 |
4.17 |
Availability of alternative routes/roads |
||||
|
L.15 |
4.17 |
Slope water system |
||||
|
L.16 |
4.17 |
Slope/cliff safety building |
||||
|
L.17. |
4.17 |
Availability of drainage system |
||||
|
EXTERNA L CONTEXT |
12.50 |
Economics |
4.17 |
KE.1 |
4.17 |
Economics development of city functions |
|
|
Politics |
4.17 |
KE.2 |
4.17 |
City functions in politics/government |
|
|
|
|
Human Activities |
4.17 |
KE.3 |
4.17 |
Pool printing on road slopes |
|
CAPACITY |
16.67 |
Planning |
4.17 |
KAP.1 |
4.17 |
Institutional readiness for emergency response and recovery |
|
|
|
Human Resource |
8.33 |
KAP.2 |
4.17 |
Availability of resources |
|
KAP.3 |
4.17 |
PDRB of Province/District/City nearby |
||||
|
Access and Mobility |
4.17 |
KAP.4 |
4.17 |
Access and mobility of resources |
Each indicator in the risk index model has a value according to its condition, which is called the indicator index value. Mathematically, the risk index model (model R) used is formulated in Equation 2 , which is the EDRI: Earthquake Disaster Risk Index (Davidson, 1997) .
Notes:
Ri = Risk index value for disaster i
Hi = Index value for hazard indicator
Ei = Index value for exposure indicator
Vi = Index value for vulnerability indicator
Exi = Index value for external context indicator
Ci = Index value for capacity indicator
W = Weight for each factor
i = Type of threat (example: landslide, earthquake, flood, etc)
Risk factors consist of hazard, exposure, vulnerability, external context and capacity. Each risk factor is assessed by the indicator index value contained in each factor and sub-factor. Each indicator index value is directly proportional to the risk index value, except for capacity. The indicator index value is inversely proportional to the risk index value.
In this guideline, the indicator of index value for the capacity factor is given in the form of a risk index value, which is inversely proportional to the value for other factors. The better the index value for capacity, the smaller the risk index value will contribute to the risk index value. Each indicator will be multiplied by one weight value. The risk index value is the sum of all the weighted values multiplied by the indicator index value. The weight of each indicator has an equal contribution to the value of the disaster risk index.
After obtaining the maximum and minimum risk index value, it is then can be classified to obtain the risk level. The range of classification for the risk index value can be seen in Figure 1 .
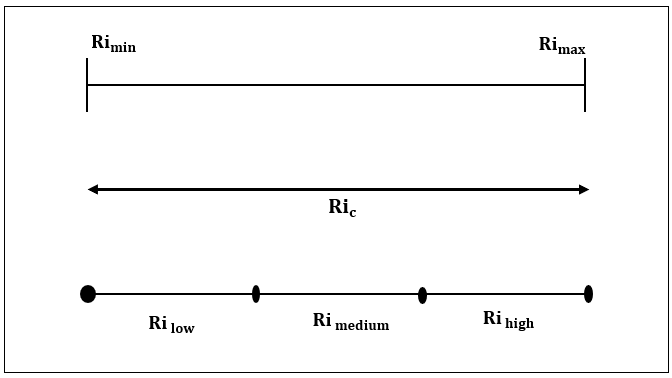
Notes:
Ri min = minimum risk index value
Ri max = maximum risk index value
Ri c = the difference between maximum and minimum risk index value
• The lower limit of the value range is obtained from the following calculation:
• The upper limit of the value ranges is obtained from the following calculation:
The range of risk index value classification will divide the value into three level; high, medium and low. The research is limited to National Roads, which are scattered in Kerinci Regency and Sungai Penuh City. These sections of the National Road are in areas prone to landslides. Details of the National Roads in question are shown in Table 2 .
|
No. |
Road Number |
Road Name |
Road Length (Km) |
Jap (Km) |
Jkp-1 (Km) |
||
|
1 |
37 |
Sanggaran Agung - Sei Penuh |
16.77 |
- |
16.77 |
||
|
2 |
37 |
11 |
K |
Jln. Diponegoro (Sungai Penuh) |
0.25 |
- |
0.25 |
|
3 |
37 |
12 |
K |
Jln. Cokroaminoto (Sungai Penuh) |
0.61 |
- |
0.61 |
|
4 |
37 |
13 |
K |
Jln. M. Yamin (Sungai Penuh) |
0.58 |
- |
0.58 |
|
5 |
37 |
14 |
K |
Jln. Martadinata (Sungai Penuh) |
2.60 |
- |
2.60 |
|
6 |
37 |
15 |
K |
Jln. Sultan Thaha (Sungai Penuh) |
1.70 |
- |
1.70 |
|
7 |
38 |
Sungai Penuh - Bts. Prov. Sumbar |
36.30 |
- |
36.30 |
||
|
8 |
38 |
11 |
K |
Jln. A. Yani (Sungai Penuh) |
0.33 |
- |
0.33 |
|
9 |
38 |
12 |
K |
Jln. Soekarno-Hatta (Sungai Penuh) |
1.12 |
- |
1.12 |
|
10 |
43 |
Sungai Penuh - Siulak Deras/Letter W |
22.24 |
- |
22.24 |
||
|
SUB TOTAL |
82.50 |
- |
82.50 |
||||
The research to be carried out is a descriptive analysis combined with the Geographical Information System (GIS) approach, so that the results obtained can be displayed in the form of a qualitative map. The landslide risk index model on roads and bridges is used because this model uses relative proportions and a simple concept that makes it easy for users to analyze and make decisions.
RESULTS AND DISCUSSION
Information technology, especially technology related to Geographical Information Systems (GIS) is very helpful in providing information. Geographical Information Systems (GIS) can be used to overlay various indicators that cause landslides on roads.

Based on the formulation of previous research, landslide risk is assessed through a disaster risk index of each hazard risk factor, exposure, vulnerability, external context, and the capacity of road managers during the emergency response and recovery period formulated in the equation above. The Risk Index Map is constructed using Spatial Analysis - Overlay - Intersect of each factor. There are 3 (three) classifications of the indicator index for each indicator used, namely the low, medium, and high. Based on the spatial analysis that has been carried out, a map of landslide hazard on national road is obtained which can be seen in Figure 2 .
Based on the results of the analysis carried out, it is known that the length of 7.19 km or 8.72% has a low risk level and 75.31 km or 91.28% is at a moderate risk level. There are no national roads in Sungai Penuh City and Kerinci Regency, which have a high level of risk. The results of risk analysis can be seen in Table 5; Table 4; Table 3 .
|
Risks |
Upper and Lower Limit Value |
|
R low |
1.08 – 1.69 |
|
R medium |
1.69 – 2.31 |
|
R high |
2.46 – 2.92 |
|
No. |
Road Length (Km) |
Road Name |
Risk Index (R) |
Risk Level |
|
1 |
16.77 |
Sanggaran Agung - Sei Penuh |
1.71 |
Medium |
|
2 |
0.25 |
Jln. Diponegoro (Sungai Penuh) |
1.25 |
Low |
|
3 |
0.6 |
Jln. Cokroaminoto (Sungai Penuh) |
1.25 |
Low |
|
4 |
0.59 |
Jln. M. Yamin (Sungai Penuh) |
1.25 |
Low |
|
5 |
2.61 |
Jln. Martadinata (Sungai Penuh) |
1.25 |
Low |
|
6 |
17 |
Jln. Sultan Thaha (Sungai Penuh) |
1.25 |
Low |
|
7 |
36.3 |
Sungai Penuh - Bts. Prov. Sumbar |
1.96 |
Medium |
|
8 |
0.31 |
Jln. A. Yani (Sungai Penuh) |
1.25 |
Low |
|
9 |
1.13 |
Jln. Soekarno-Hatta (Sungai Penuh) |
1.25 |
Low |
|
10 |
22.24 |
Sungai Penuh - Siulak Deras/Letter W |
1.79 |
Medium |
|
Risk Classification |
Length (Km) |
Percentage (%) |
|
Low |
7.19 |
8.72 |
|
Medium |
75.31 |
91.28 |
|
High |
- |
- |
CONCLUSION
There are only two classes of landslide hazard index values in Sungai Penuh City and Kerinci Regency, namely low and medium. Seven roads that are classified as low, namely Jln. Diponegoro, Jln. Cokroaminoto, Jln. M. Yamin, Jln. Martadinata, Jln. Sultan Thaha, Jln. A. Yani, Jln. Soekarno-Hatta, while 3 (three) roads are classified as medium, namely the Sanggaran Agung - Sei Penuh, Sungai Penuh - West Sumatra border and Sungai Penuh - Siulak Deras / Letter W. The Risk Level of Landslide Hazard on National Roads in Sungai Penuh City and Kerinci Regency based on the level of hazard risk, exposure, vulnerability, external context and road management capacity, is divided into two classifications, i.e: (a) Low, which is about 7.19 Km (8.72%), and (b) Medium, with a length of 75.31 Km (91.28%).
