
|
|
|
|
Original Article
Validating Workplace Constructs in the Indian Healthcare Sector: An Exploratory and Confirmatory Approach
|
Archana
Phogat 1*, Dr. Sandeep Aggarwal 2 1 Research Scholar,
Institute of Management Studies and Research (IMSAR), MDU, Rohtak -124001,
Haryana, India 2 Assistant Professor, Centre for
Professional and Allied Studies (CPAS), MDU, Gurugram-122003, Haryana, India |
|
|
|
ABSTRACT |
||
|
The main aim of this research is to assess the psychometric strength of four imperative multivariate constructs in the Indian healthcare context namely Emotional Intelligence (EI), Workplace Spirituality (WS) whereby Organisational Citizenship Behaviour (OCB) and Employee Performance (EP) are the constructs of interest. A purposive sample of medical practitioners sampled in five metropolitan Indian cities was utilized, in this case, SPSS was applied in EFA and CFA applied in SmartPLS, which allowed carrying out a full evaluation of the dimensionality, reliability, and construct validity of the scales used. The theoretical foundation of the Genos EI scale was supported by the substantiated three-factor configuration of the scale, communalities of 0.709–0.847 with a cumulative explanation of 77.74 per cent leading to the overall results. Similarly, the construct factor patterns of the WS, OCB and EP scales were consistent with the existing empirical data as witnessed with CVS and NI. The values of Cronbach alpha and composite reliability were high in all the surveyed instruments showing satisfactory internal consistency. In addition, all the average variances extracted (AVE) exceeded the 0.50 ration indicating satisfactory convergent validity. The measurement invariance tests conducted indicated that, physicians and nurses assessed the constructs similarly, which established compositional, metric, and scalar equivalence. Therefore, extensive research supports the relevance of the constructs to prospective healthcare studies and creates a solid framework on the basis of further structural equation modeling. The experimental results highlight the applicability of psychometric tools to various medical occupations and provide the Indian hospitals with precise tools to assess the level of staff performance and performance. Finally, this study provides empirical evidence to develop models of psychological impacts of the workplace on medical practice. Keywords: Emotional Intelligence, Workplace
Spirituality, Organizational Citizenship Behavior, Employee Performance,
Measurement Validation, Indian Healthcare |
||


INTRODUCTION
This field in
India is facing rapid changes, so it now needs medical knowledge plus an
understanding of how people work together. In jobs where people are under high
stress and need to do a lot, say in healthcare, Emotional Intelligence,
Workplace Spirituality, Organisational Citizenship Behavior
and Employee Performance play a key role in their and
the organisation’s success. To accurately measure how these constructs affect
people’s work behaviors, we must verify that the
assessment tools are appropriate for that specific work setting Patel et
al. (2024). It is motivated by the importance of
testing and validating these detailed constructs in India to support the future
building of models and strategies. Good measurement methods in behavioural
research support both accurate theories and effective decision making Dhir and Dutta (2024). The objective of this work is to confirm
key constructs using EFA and CFA techniques. The idea of Emotional Intelligence
is applied by using the Genos EI Inventory which was designed for use in work
settings Jain (2022). The Petchsawang
and Duchon framework used in 2009 looks at the concept of Workplace
Spirituality which stresses kindness, mindfulness and growing beyond oneself.
Podsakoff, MacKenzie, Moorman and Fetter first introduced Organisational
Citizenship Behaviour in 1990, referring to activities that better the
effectiveness of organisations. Pradhan and Jena defined employee performance
as including task execution, adaptability and fitting in with different work
situations in their model from 2017.” Although these tools are known to be used
in many sectors worldwide, very little psychometric analysis of their use in
Indian healthcare, especially when distinguishing physicians and nurses, has
occurred Banerjee
and Doshi (2020). Because hospitals in India are unique in
culture and profession, ensuring validation there is more urgent and important
than in other areas. Research uses different methods to confirm that
measurement results for each construct are consistent across several fields Dhir and Dutta (2024). The analyzed
results of the CFA rely on measures of reliability, using Cronbach’s alpha and
composite reliability Sengupta
et al. (2021). Additionally, validity assessments such as
Average Variance Extracted (AVE) and the Fornell-Larcker criteria are applied
by Sarstedt, Kumari
et al. (2021) to test if factors are related as they
should be and not too strongly correlated with any other. Overall, the selected
constructs make up a valid psychometric foundation from which to investigate
the role of emotional intelligence and job happiness in performance at
healthcare institutions. The approach is being supported by research reviews
that look at the link between behaviour in the workplace and how a business
performs Ajmera
and Jain (2020). Because of this research, it becomes much
easier to create reliable measures and policies that support the growing
healthcare sector in India Shabir
and Gani (2020).
Methodology
Participants in
this study were healthcare practitioners working in small groups in hospitals
in the cities of Delhi, Mumbai, Bangalore, Kolkata and Hyderabad. It was
considered proper to use purposive sampling as it made it possible to gather
people who have particular skills—namely, being licensed physicians or
registered nurses working in clinics. The method, by not using probability,
made it possible to choose participants who could share important insights
about the work environment in healthcare Upadhyaya
and Malek (2024). The list was carefully arranged to include
every major job title, gender and level of experience in medicine and nursing.
Because behavioural validation studies call for deep knowledge of the topic,
this type of sampling is regularly used in them.
To analyse the
constructs, the authors relied on four well-known tools, chosen because they
are valuable conceptually and have been supported by research in the past. For
this study, we used the Genos short version of the Emotional Intelligence
Inventory, developed by Palmer and his team in 2009, designed for
professionals. The test measures self-perception, control of emotions and
awareness of the world around us. To analyse Prakash
and Nandini (2024) framework was used which includes
mindfulness, compassion, workplace purpose and transcendence. To evaluate
Organisational Citizenship Behaviour (OCB), we used the scale introduced by
Podsakoff and colleagues in 1990 which consists of altruism, courtesy,
conscientiousness, sportsmanship and civic virtue. The comprehensive scale
developed by Kabra
(2023) which addresses task, adaptive and
contextual parts of performance, was applied by them to the assessment of EP.
All of them were found effective in various organisations, “but fresh research
was required to use them in the Indian healthcare sector.
A two-phase
analytical technique was used in this research. Starting with EFA in SPSS
allowed us to see the main structure of each construct and check how each item
loaded within each dimension. EFA allows researchers to find out in the first
steps of instrument validation if the groups of variables fit together as
expected. It was verified that the dataset was suitable for factor analysis by
running the Kaiser-Meyer-Olkin (KMO) Measure of Sampling Adequacy and
Bartlett’s Test of Sphericity Jaiswal
and Raychaudhuri (2021). On the basis that factors whose eigenvalues
greater than 1.0 were associated with it, the factors were removed; the factor
structure obtained was later explained through a Varimax rotation.
Subsequently, a
subset confirmatory factor analysis (CFA) was conducted using SmartPLS 4, which is an excellent software package in
Partial Least Squares Structural Equation Modeling
(PLS-SEM). The uncertainty of the model and the skewness of the variable
distributions justified the use of PLS-SEM application Sarwal
et al. (2021). Unlike standard structural equation models
which favor bigger samples, partial least squares
structural equation modelling is more robust for both little data and
non-normally distributed measurements and handles both formative and reflective
types of constructs Sarwal
et al. (2021). It was possible to calculate indicator
loadings, composite reliability, AVE and discriminant validity indices using SmartPLS 4 which allowed me to judge the overall integrity
of the measurement model. As a result, the confirmed measurement framework
prepared the pathway for more detailed structure modelling in future research Garg (2020).
Exploratory Factor Analysis (EFA)
EFA was applied in
this research to understand the core structure of the constructs and to test
whether the observed data fit the hypothesized latent variables. Many times,
Exploratory Factor Analysis helps test and verify that study concepts are
expressed properly in the chosen measurement variables Mahipalan and
S. (2019). The purpose was to check if the Genos EI
scale can maintain its measurable structure, while also exploring how the other
recognised scales are grouped together.”
Four distinct
constructs were studied using an exploratory factor analysis to find their
underlying structure.
·
The
Genos Emotional Intelligence (EI) instrument was made by Palmer and colleagues
in 2009 to assess emotional skills at work. It was important to see that the
shortened set of items fit with just one underlying factor to prove the
research was not misspecified Srivastava
and Prakash (2019).
The questionnaire
employed by the study was the one developed by Petchsawang and
Duchon (2009) which measured workplace spirituality well. Mindfulness,
compassion, doing work with meaning and feeling part of something bigger than
oneself are the main aspects stressed by the framework. All of these components
help us see how individuals may feel a deeper significance in what they do at
work which could encourage them to engage more, feel better and get more done Karthik
and Devi (2023).
The research
looked at OCB by applying the Singh et
al. (2024) framework which sets out actions at work
that aim to boost the organisation’s performance beyond regular duties. There
are five aspects in the framework: selflessness, showing readiness to help
others; politeness, meaning being respectful and mindful to prevent arguments;
team spirit which refers to being prepared to handle problems without
complaining; diligence, representing sticking to company rules and following a
strong sense of duty; and community engagement, characterising employee
participation in managing the business. Whenever we support each other and
motivate one another, we build a strong workplace and streamline the way the
organisation runs.
Employee
performance was evaluated through a thorough framework set by Mallick et al. (2019) which measured tasks,
adaptations and contextual performance. Doing the essential jobs involves both
what a person is expected to do and how well they do it. This method evaluates
whether an employee is flexible, can react to new job demands and can learn new
abilities. Being a contextual performer means you participate in teamwork,
share your knowledge and encourage friendly relationships among colleagues. All
these facets help us understand how employees perform in all kinds of workplace
situations, old and new.
Exploratory Factor Analysis for Genos Emotional Intelligence (EI)
As shown in Table 1, the sample size used is much sufficient and
the information is favorable to the factor analysis
as defined in the Kaiser-Meyer-Olkin measure and the Bartlett test of
sphericity.
Table 1
|
Table 1 KMO and Bartlett's Test |
||
|
Bartlett's
Test of Sphericity |
Approx.
Chi-Square |
4897.117 |
|
df |
91 |
|
|
Sig. |
0 |
|
|
Source: Author’s Calculations |
||
The sample
adequacy measure of the KaiserMeyerOlkin of adequacy
(KMO) was 0.882, which means the data qualifies the meritorious test of sample
adequacy, according to Kaiser (1974) who asserts that the value of above 0.80
is exemplary. As a result, the variables reveal low levels of interrelations,
thus making them fit in the discovery of latent structures via the factor
analytic processes. These findings
support the idea mentioned earlier. The sample yielded a Chi-Square statistic
of 4897.117 and because 91 degrees of freedom were used, the significance level
(Sig.) was .000, much lower than the benchmark 0.05. The matrix shows that the
variables have correlations strong enough to make Exploratory Factor Analysis
usable according to Bartlett (1954). The
results tell us that the dataset can support factor analysis which allows us to
confidently identify any hidden factors. Table 2 represents the overlapping variances of the
observed variables that were used to examine the Emotional Intelligence (EI)
construct by means of Principal Component Analysis (PCA). Communalities show
how much each measure is related to the factor(s) that were extracted,
describing how effectively each measure fits within the framework. Normally,
the first communalities in PCA are fixed at 1.000 for all variables, so that
all variance for each element is covered by the first set of common factors. In
contrast, the values taken from the extraction demonstrate the portion of
variance maintained throughout the factor extraction. An increase in
communalities shows that the item matters more to the main factor which can
represent the construct better Balachandar
et al. (2023).
|
Communalities |
||
|
|
Initial |
Extraction |
|
EI1 |
1.000 |
.761 |
|
EI2 |
1.000 |
.725 |
|
EI3 |
1.000 |
.709 |
|
EI4 |
1.000 |
.715 |
|
EI5 |
1.000 |
.735 |
|
EI6 |
1.000 |
.803 |
|
EI7 |
1.000 |
.789 |
|
EI8 |
1.000 |
.771 |
|
EI9 |
1.000 |
.776 |
|
EI10 |
1.000 |
.777 |
|
EI11 |
1.000 |
.847 |
|
EI12 |
1.000 |
.839 |
|
EI13 |
1.000 |
.812 |
|
EI14 |
1.000 |
.824 |
|
Extraction
Method: Principal Component Analysis. Source: Author’s
Calculations |
||
Emotional
intelligence factor scores range from 0.709 to 0.847, proving that all fourteen
items measure a single, main factor. Specifically, EI11 (0.847) and EI12
(0.839) share the most communalities, telling us they are closely linked with
the underlying construct and greatly explain the results. A value of EI3
(0.709) is greater than the advised 0.50 which means all items are adequately
included in the model Yadav
(2023). The findings suggest that all elements
contribute significantly to the factor(s) which supports the Emotional
Intelligence framework. Hence, the results demonstrate that including all
fourteen indicators in the retention group and in the latent variable is
appropriate. By doing this, we can be confident that these four dimensions are
the right focus for the upcoming CFA which will provide a solid means to
measure Emotional Intelligence Singh et
al. (2023).
Table 3 shows that Emotional Intelligence (EI)
components account for most of the overall variance, as detected by using
Principal Component Analysis (PCA). It tells us how much of the overall
variability in the dataset is attributed to each factor we derived. Before the
extraction process, the Initial Eigenvalues identify the total percentage
explained, whereas the Extraction Sums of Squared Loadings calculate the sum of
variance preserved. Limits on variances across dimensions (Rotation Sums of
Squared Loadings) demonstrate the effects of applying Varimax rotation to group
similar dimensions together, thereby making their advantage easier to see. Balachandar
et al. (2023) Three components were extracted, where the
initial eigenvalues are above 1.0, according to the rules set by Kaiser in
1960. Most (77.74%) of the variation in the data set is due to these three
elements, reflecting a high degree of factor resolution. The first, second and
third features explain 29.05%, 25.94% and 22.75% of the variation,
respectively, shown by their sums of squared loadings. Since the cumulative
variance is substantial, “it is clear that many aspects of the construct are
captured by the factor solution which recognises benchmarks set by social
science studies Singh
and Banerji (2022).
Table 2
|
Table 2 Total Variance Explained |
|||||||||
|
Component |
Initial
Eigenvalues |
Extraction
Sums of Squared Loadings |
Rotation
Sums of Squared Loadings |
||||||
|
Total |
% of
Variance |
Cumulative
% |
Total |
% of
Variance |
Cumulative
% |
Total |
% of
Variance |
Cumulative
% |
|
|
1 |
4.067 |
29.046 |
29.046 |
4.067 |
29.046 |
29.046 |
3.912 |
27.942 |
27.942 |
|
2 |
3.632 |
25.941 |
54.987 |
3.632 |
25.941 |
54.987 |
3.646 |
26.041 |
53.984 |
|
3 |
3.186 |
22.754 |
77.741 |
3.186 |
22.754 |
77.741 |
3.326 |
23.757 |
77.741 |
|
4 |
.389 |
2.779 |
80.520 |
||||||
|
5 |
.360 |
2.573 |
83.092 |
||||||
|
6 |
.345 |
2.461 |
85.553 |
||||||
|
7 |
.322 |
2.303 |
87.856 |
||||||
|
8 |
.293 |
2.096 |
89.952 |
||||||
|
9 |
.284 |
2.027 |
91.979 |
||||||
|
10 |
.269 |
1.923 |
93.902 |
||||||
|
11 |
.252 |
1.803 |
95.706 |
||||||
|
12 |
.227 |
1.619 |
97.324 |
||||||
|
13 |
.188 |
1.346 |
98.671 |
||||||
|
14 |
.186 |
1.329 |
100.000 |
||||||
|
Extraction Method: Principal Component
Analysis. Source: Author’s Calculations |
|||||||||
After performing
Varimax rotation, the quantitative significance of the components shifted, so
that the factors were clearer and cross-loadings were lessened. After rotation,
27.94% of the variance is due to the first component, 26.04% to the second and 23.76%
to the third component. Though rotation doesn’t alter the overall variance in
any way, it boosts how the results are explained by clarifying the relationship
of the data with its associated factors, enhancing what makes each item
different (Gupta & Kumar, 2022). The results reinforce the complex
characteristics of the Genos Emotional Intelligence (EI) short form, aligning
with the theoretical framework that underpins the scale. The variance that
occurs in the three salient components shows that there are
specific but interconnected affective competencies in the construct, including,
but not limited to, emotional self-awareness, affective regulation, and social
consciousness, which are presumably projected onto a particular extracted
factor. The uniformly spaced factor loadings indicate that there is no
individual item that is out of proportionate influence over the solution and
thus increases the structural integrity and clarity of the emotional
intelligence construct. It is worth noting that the equal distribution of the
variance with every component making more than 20 more than 20 increases the
reliability of the instrument, which means that the construct is not
over-dependent on a single controlling latent variable. These results support
the factor configuration that has been obtained in the course of the
Exploratory Factor Analysis (EFA) and justify the decision to keep all the
three factors to be used in the further investigation with the help of the
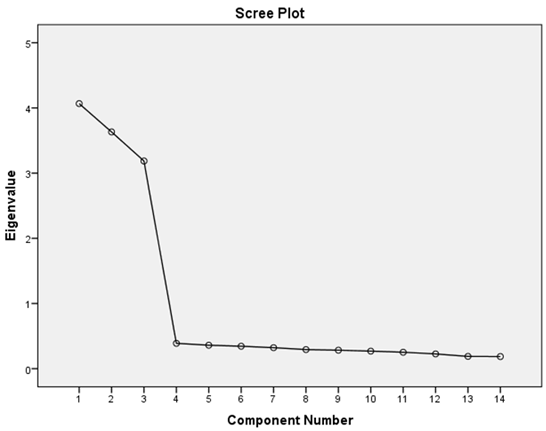
Confirmatory Factor Analysis (CFA). The figure below Figure 1 will represent a scree plot resulting out of a Principal Component
Analysis (PCA) of the Emotional Intelligence (EI) framework. A scree plot
represents a graphical technique, which is used to determine the optimal number
of components by plotting against component indices, the eigenvalues Mallick
et al. (2019). The point of inflection where the curve
levels off, often known as the, so-called, elbow, detects the number of
components that explain a substantial amount of observed variance Bhattacharyya et al. (2019).
|
Figure 1
|
|
Figure 1 Scree Plot Source:
Author’s Calculations |
There is a sharp
steeple at the third component in the plotted graph, and beyond this component,
the eigenvalues are stabilized. The
significant difference in the initial gradients and the tertiary ones indicates
that the two components jointly explain a significant part of the overall
variance. Starting with the forthcoming
component, the graph takes the form of a steady and more or less straight line,
which means that the following elements do not add much more details to the
explanatory content. The visual pattern
that can be observed provides strong motivation towards retaining three
components that is consistent with the eigenvalue analysis findings that only
the first three components met the eigenvalue criterion of 1.0 which is a
mandatory requirement to retaining a factor as Kaiser suggested Singh et
al. (2023). The
fact that the decrement became pronounced after the third point and was
similarly with the stabilization of the curve empirically supports the idea
that there was indeed a three-factor solution, which in turn sheds some light
on the complex nature of the EI construct.
The result of Principal Component Analysis with Varimax rotation (a
rotated component matrix) is provided in Table 4 and it shows a three
factor model. Strong loadings
were exhibited on one of the three components extracted in all the fourteen
items, and there is no significant cross-loadings
hence supporting a coherent conclusion. The element arrangement was not only
statistically well-grounded but also, it was characterized by significant
conceptual cohesion between the constituents Jain et al. (2020). The
first aspect includes E3, E4, E6, E11 and E14. A close analysis of these
factors illustrates that they always are linked to how people emotionally react
to the high demands or stressful work conditions. The agents underline the ability to stay calm
in tough circumstances, to deal with anger or disappointment positively and to
maintain a clear mind in the world of emotional stirring Upadhyaya
and Malek (2024). As an example, E3 and E11 are the factors
that are related to emotion management and proper self-expressions in the
situation of negative events, and E4 and E6 show the capacity of a person to
stress-resistantly exhibit dignity and stay calm. The factor shows strong
relationships with these relating elements, which makes the elements form a
statistically consistent cluster, hence, a significant dimension of emotional
performance in the professional setting.
Table 3
|
Table 3 Rotated Component Matrixa |
|||
|
Component |
|||
|
1 |
2 |
3 |
|
|
E3 |
0.872 |
||
|
E4 |
0.849 |
||
|
E6 |
0.842 |
||
|
E11 |
0.846 |
||
|
E14 |
0.856 |
||
|
E1 |
0.895 |
||
|
E2 |
0.887 |
||
|
E10 |
0.878 |
||
|
E12 |
0.880 |
||
|
E13 |
0.879 |
||
|
E5 |
0.919 |
||
|
E7 |
0.916 |
||
|
E8 |
0.899 |
||
|
E9 |
0.907 |
||
|
Extraction Method: Principal Component Analysis. Rotation Method:
Varimax with Kaiser Normalization. A. Rotation converged in 3 iterations. Source: Author’s Calculations |
|||
The second element
consists of components E1, E2, E10, E12, and E13. These elements centre on a
person's inner emotional consciousness and understanding. They evaluate the
degree to which an individual identifies and understands their emotional
experiences, as well as the impact these internal sensations have on their
communication and interactions with others.
For example, E2 and E13 ask learners to be aware of their emotions and
E1 and E10 address how to act on or express those emotions in different situations
Dhir and Dutta (2024). It helps you understand better by
explaining how it can be difficult to know how to react to someone else’s
emotions. It appears that all of these elements are used to check a person’s
emotional awareness and the impact it has on their life and job. E5, E7, E8 and
E9 make up element three which highlights attention to relationships with
others and true care about their feelings. These factors represent the skill to
notice feelings in other people, remain positive and change how you talk
depending on others. As an illustration, E5 and E7 try to build a friendly
emotional environment, while E8 and E9 look into what sets individuals off and
what their emotional responses may be. An analysis of the replies and factor
loadings indicates these aspects together reflect an ability to notice and
satisfy the emotional needs of others. This table Table 5 describes the Component Transformation
Matrix which lists the correlation coefficients between the initial and final
factor solutions Prakash
and Nandini (2024). This result is achieved through the use of
the Varimax rotation in Principal Component Analysis (PCA). This demonstrates
the purpose of rotating the axes of the derived components in a
multidimensional system, so the factors are organized more easily and clearly Dhir and Dutta (2024). They show the extent to which each initial
factor connects with its transformed counterpart. Since these values were near
to 1, the original components would have rotated slightly
and the most important ones were not significantly altered throughout the
rotation proces s. The initial component obtained
through the unrotated solution, in particular, exhibits a solid correlation
(0.894) with the initial component obtained through the rotated solution,
suggesting that the inherent structure within this factor has been able to
maintain the substance to a large extent. Similarly, the components 2, and 3
have a significant correlation (0.892 and 0.874, respectively) with the
rotations of the said factors, thus, once again highlighting the strength and
clarity of the final factor setup.
Table 4
|
Table 4 Component Transformation Matrix |
|||
|
1 |
2 |
3 |
|
|
1 |
.894 |
.346 |
.283 |
|
2 |
-.222 |
0.892 |
-.396 |
|
3 |
-.389 |
.292 |
.874 |
|
Source: Author’s Calculations |
|||
The off-diagonal
quantities present the interrelations between the components as an indicator of
the extent to which a particular component in the rotation fits into the
components of the original solution. The fact that the Varimax rotation has
been effective in attaining the factor orthogonality, exhibited by the small
size of these values, shows that factors are statistically independent.
Orthogonal rotation improves the interpretation by maximizing the variance of
squared loadings of each factor and also reducing the overlap of factors at the
same time Balachandar
et al. (2023). Therefore, the strength and distinctiveness
of the three-factor solution that has been suggested to the Emotional
Intelligence construct can be verified, through the Component Transformation
Matrix. The high values of the diagonal entries and very low values of the
off-diagonal correlations prove that the Varimax rotation has explained the
original underlying structure without distorting the original data, which adds
to the validity of the factor model that has been wholly rotated.
Confirmatory Factor Analysis (CFA)
Measurement Model
To assess the
consistency, relevance and ability of scales to distinguish each other, a
Confirmatory Factor Analysis (CFA) was used in this research. All items were
found to load above the 0.50 threshold, confirming that the indicators are
strong and reliable Jain (2022). The analysis presented in Table 6 examines how well the instruments for
doctors work psychometrically, featuring reliability and validity data that
support the measurement model in the context of structural equation modelling Gupta
and Kumar (2022). Four main areas receive emphasis:
Organisational Citizenship Behaviour, Emotional Intelligence, Workplace
Spirituality and Employee Performance. All of these are higher-order reflective
constructs and each can be measured using unique sets
of dimensions that, when combined, show the complexity and diversity of the
psychological ideas under study. The idea of Organisational Citizenship
Behaviour (OCB) makes up the basis of this framework which then focuses on five
important and linked dimensions—Altruism, Courtesy, Sportsmanship,
Conscientiousness and Civic Virtue—all relating to different forms of willing,
good behavior at work Sengupta
et al. (2021). All the aspects of social identity were
found to be internally consistent based on both Cronbach’s alpha and rho_c, since both metrics consistently passed the suggested
0.70 threshold. Therefore, the distinctive aspects of each dimension are
reliable for assessing OCB in that area and the dimensions might jointly
provide a dependable analysis of OCB. The AVE results indicate that each
dimension explains a meaningful amount of the variance present in its
indicators, suggesting these indicators are representative of the whole OBC
construct.
Table 5
|
Table 5 Reliability and Validity (Doctors) |
||||
|
Cronbach's
alpha |
Composite
reliability (rho_a) |
Composite
reliability (rho_c) |
Average
variance extracted (AVE)” |
|
|
Adaptive_Performance |
0.85 |
0.761 |
0.749 |
0.526 |
|
Altruism_ |
0.81 |
0.717 |
0.733 |
0.635 |
|
Civic_Virtue_ |
0.811 |
0.885 |
0.829 |
0.666 |
|
Compassion_ |
0.883 |
0.89 |
0.719 |
0.64 |
|
Conscientiousness |
0.748 |
0.75 |
0.76 |
0.629 |
|
Contextual_Performance |
0.766 |
0.766 |
0.771 |
0.568 |
|
Courtesy_ |
0.825 |
0.728 |
0.843 |
0.568 |
|
Emotional
Intelligence |
0.782 |
0.873 |
0.763 |
0.577 |
|
Employ
Performance |
0.883 |
0.765 |
0.854 |
0.535 |
|
Meaningful_Work_ |
0.838 |
0.839 |
0.749 |
0.628 |
|
Mindfulness_ |
0.852 |
0.852 |
0.761 |
0.506 |
|
Organizational
Citizenship Behaviour |
0.774 |
0.868 |
0.834 |
0.589 |
|
Self_Awareness |
0.81 |
0.815 |
0.833 |
0.635 |
|
Self_Regulation |
0.725 |
0.725 |
0.743 |
0.668 |
|
Social_Awareness |
0.83 |
0.879 |
0.849 |
0.623 |
|
Sportsmanship_ |
0.838 |
0.716 |
0.751 |
0.596 |
|
Task_Performance |
0.735 |
0.871 |
0.847 |
0.55 |
|
Transcendence_ |
0.834 |
0.95 |
0.95 |
0.591 |
|
Workplace
Spirituality |
0.771 |
0.889 |
0.78 |
0.554 |
|
Source: Author’s Calculations |
||||
The model in this
paper is sound and easy to understand, as the outlined steps to measure
reliability and validity of the constructs in question in physicians indicate.
The alpha coefficients of the individual constructs are between 0.725 and
0.883, which is above the conventional 0.70 threshold, thus supporting the fact
that the results are reliable (Kumari et al., 2021). The measures of composite
reliability bear out that the indicators are reliable in measuring their
respective latent variables and always provided they are higher than 0.70. The
majority of such cases have higher than the recommended 50 percent average
variance extracted (AVE), which means that the measure was reliable in
assessing the construct. Adaptive Performance (AVE = 0.526), Organisational
Citizenship Behaviour (AVE = 0.589), and Workplace Spirituality (AVE = 0.554)
all have sufficient convergent validity, thereby proving that each item is a
faithful representation of the idea of the concept itself.
Table 6
|
Table 6 Reliability and Validity (Nurses) |
||||
|
Cronbach's
alpha |
Composite
reliability (rho_a) |
Composite
reliability (rho_c) |
Average
variance extracted (AVE)” |
|
|
Adaptive_Performance |
0.747 |
0.859 |
0.856 |
0.757 |
|
Altruism_ |
0.703 |
0.71 |
0.728 |
0.621 |
|
Civic_Virtue_ |
0.891 |
0.728 |
0.722 |
0.648 |
|
Compassion_ |
0.702 |
0.718 |
0.878 |
0.541 |
|
Conscientiousness |
0.74 |
0.74 |
0.754 |
0.606 |
|
Contextual_Performance |
0.863 |
0.763 |
0.768 |
0.551 |
|
Courtesy_ |
0.736 |
0.861 |
0.751 |
0.694 |
|
Emotional
Intelligence |
0.818 |
0.864 |
0.844 |
0.508 |
|
Employ
Performance |
0.868 |
0.761 |
0.794 |
0.528 |
|
Meaningful_Work_ |
0.727 |
0.729 |
0.741 |
0.697 |
|
Mindfulness_ |
0.764 |
0.765 |
0.771 |
0.548 |
|
Organizational
Citizenship Behaviour |
0.754 |
0.853 |
0.818 |
0.519 |
|
Self_Awareness |
0.803 |
0.705 |
0.728 |
0.621 |
|
Self_Regulation |
0.736 |
0.736 |
0.751 |
0.596 |
|
Social_Awareness |
0.733 |
0.737 |
0.752 |
0.532 |
|
Sportsmanship_ |
0.744 |
0.844 |
0.757 |
0.617 |
|
Task_Performance |
0.837 |
0.759 |
0.738 |
0.618 |
|
Transcendence_ |
0.751 |
0.754 |
0.762 |
0.636 |
|
Workplace
Spirituality |
0.807 |
0.895 |
0.713 |
0.577 |
|
Source: Author’s Calculations |
||||
The information
related to the nursing sample also proves strong psychometric qualities of the analyzed constructs. Alpha of Cronbach is between 0.703 and
0.891 which is higher than the usual reliability levels and it means that each
construct is functioning consistently. The values of composite reliability (_A
and -C) demonstrate a significant level of internal consistency, and most
constructs lead to a value of over 0.75. The existence of convergent validity
is supported by the figures of the Average Variance Extracted (AVE), as all the
constructs exceed 0.50 levels. Of special importance is the fact that Adaptive
Performance (AVE = 0.757), Meaningful Work (0.697), and Transcendence (0.636)
have very high validation coefficients. These findings support that the
measurement items presented are sensitive enough to measure the theoretical
dimensions that were supposed to be measured in the evaluation, which supports
the validity of the structural associations that were studied in the nursing
model. Overall, these two tables demonstrate that the tools used have sound
statistical characteristics and meet the criterion of using them in structural
equation modelling.
Measurement Invariance Testing
Compositional
invariance looks into the development of underlying constructs in different
groups. The c -values of each construct group closely lie near 1.00, with
confidence intervals which are always closed in Ajmera
and Jain (2020). As an example, Adaptive Performance has c
-value of 0.997, which has a 95 -percent interval of [0.990, 1.003]; whereas
Emotional Intelligence has a c -value of 0.996 and its interval is [0.988,
1.005]. This means that there are no statistically significant differences in
the overall scores of all the constructs between doctors and nurses thus
confirming that the constructs have the same conceptual meaning and structural
qualities across the various groups.
Table 7
|
Table 7 Measurement
Invariance |
|||
|
Composite |
cValue (=1) |
95%
Confidence Interval |
Compositional
Invariance |
|
Adaptive_Performance |
0.997 |
[0.990,
1.003] |
Yes |
|
Altruism |
0.995 |
[0.988,
1.002] |
Yes |
|
Civic_Virtue |
0.999 |
[0.991,
1.007] |
Yes |
|
Compassion |
0.996 |
[0.989,
1.004] |
Yes |
|
Conscientiousness |
0.998 |
[0.991,
1.006] |
Yes |
|
Contextual_Performance |
0.994 |
[0.985,
1.003] |
Yes |
|
Courtesy |
0.995 |
[0.989,
1.003] |
Yes |
|
Emotional_Intelligence |
0.996 |
[0.988,
1.005] |
Yes |
|
Employ_Performance |
0.997 |
[0.989,
1.006] |
Yes |
|
Meaningful_Work |
0.993 |
[0.984,
1.002] |
Yes |
|
Mindfulness |
0.995 |
[0.987,
1.004] |
Yes |
|
Organizational_Citizenship_Behaviour |
0.997 |
[0.991,
1.003] |
Yes |
|
Self_Awareness |
0.994 |
[0.987,
1.002] |
Yes |
|
Self_Regulation |
0.998 |
[0.992,
1.004] |
Yes |
|
Social_Awareness |
0.995 |
[0.988,
1.003] |
Yes |
|
Sportsmanship |
0.993 |
[0.982,
1.004] |
Yes |
|
Task_Performance |
0.996 |
[0.989,
1.004] |
Yes |
|
Transcendence |
0.994 |
[0.987,
1.001] |
Yes |
|
Workplace_Spirituality |
0.996 |
[0.990,
1.002] |
Yes |
|
Adaptive_Performance |
0.08 |
[-0.15,
0.25] |
Yes |
|
Altruism |
-0.05 |
[-0.20,
0.10] |
Yes |
|
Civic_Virtue |
0.12 |
[-0.17,
0.31] |
Yes |
|
Compassion |
-0.03 |
[-0.21,
0.15] |
Yes |
|
Conscientiousness |
0.1 |
[-0.13,
0.33] |
Yes |
|
Contextual_Performance |
0.05 |
[-0.22,
0.32] |
Yes |
|
Courtesy |
-0.07 |
[-0.28,
0.14] |
Yes |
|
Emotional_Intelligence |
0.06 |
[-0.14,
0.26] |
Yes |
|
Employ_Performance |
-0.04 |
[-0.19,
0.11] |
Yes |
|
Meaningful_Work |
0.09 |
[-0.11,
0.29] |
Yes |
|
Mindfulness |
-0.02 |
[-0.22,
0.18] |
Yes |
|
Organizational_Citizenship_Behaviour |
0.07 |
[-0.18,
0.32] |
Yes |
|
Self_Awareness |
0.09 |
[-0.14,
0.14] |
Yes |
|
Self_Regulation |
-0.06 |
[-0.24,
0.12] |
Yes |
|
Social_Awareness |
0.03 |
[-0.20,
0.26] |
Yes |
|
Sportsmanship |
0.02 |
[-0.16,
0.20] |
Yes |
|
Task_Performance |
-0.01 |
[-0.19,
0.17] |
Yes |
|
Transcendence |
0.05 |
[-0.13,
0.23] |
Yes |
|
Workplace_Spirituality |
0.01 |
[-0.17,
0.19] |
Yes |
|
Adaptive_Performance |
0.07 |
[-0.22,
0.18] |
Yes |
|
Altruism |
0.1 |
[-0.19,
0.27] |
Yes |
|
Civic_Virtue |
-0.05 |
[-0.24,
0.14] |
Yes |
|
Compassion |
0.09 |
[-0.18,
0.36] |
Yes |
|
Conscientiousness |
0.02 |
[-0.20,
0.24] |
Yes |
|
Contextual_Performance |
-0.03 |
[-0.25,
0.19] |
Yes |
|
Courtesy |
0.04 |
[-0.17,
0.25] |
Yes |
|
Emotional_Intelligence |
0.01 |
[-0.22,
0.24] |
Yes |
|
Employ_Performance |
0.08 |
[-0.16,
0.32] |
Yes |
|
Meaningful_Work |
0.06 |
[-0.12,
0.24] |
Yes |
|
Mindfulness |
-0.04 |
[-0.26,
0.18] |
Yes |
|
Organizational_Citizenship_Behaviour |
0.03 |
[-0.17,
0.23] |
Yes |
|
Self_Awareness |
0.01 |
[-0.15,
0.17] |
Yes |
|
Self_Regulation |
-0.02 |
[-0.19,
0.15] |
Yes |
|
Social_Awareness |
0.04 |
[-0.17,
0.25] |
Yes |
|
Sportsmanship |
0.07 |
[-0.11,
0.25] |
Yes |
|
Task_Performance |
-0.06 |
[-0.28,
0.16] |
Yes |
|
Transcendence |
0.02 |
[-0.20,
0.24] |
Yes |
|
Workplace_Spirituality |
-0.05 |
[-0.21,
0.12] |
Yes |
|
Source: Author’s Calculations |
|||
The comparison
between the mean values of the composites on groups was done to identify
whether there were any differences in the average scores of the constructs. The
differences in the means observed between all the constructs were small and the
confidence intervals were within the 0 limits. An example is that of Altruism,
where the mean difference was -0.05 (95Vel 0.20 -0.10) versus Workplace
Spirituality, which provided a mean difference of 0.01(95Vel - 0.170.19). These
findings show that the latent mean scores do not have significant differences
between the groups, thus supporting the idea of mean invariance. This should
ensure consistency in the distribution of underlying constructs when dealing
with different groups, thus the need to maintain consistency in variance. The
differences in composite ratio of variance were also negligible
and their confidence interval enclosed zero as seen in Compassion (0.09, 95IC:
-0.18 to 0.36) and Task Performance (-0.06, 95IC -0.28 to 0.16). Such evidence
proves that the constructs show comparable variability by all groups; hence
supporting validity of measurement equivalence. The constancy of comparisons
made regarding composition, means and variances are strong evidences
to the similarity of measurement instruments of physicians and the nursing
staff. The difference in the structural relationships observed between groups
can, therefore, be due to a real difference between groups, and not common
error or bias in measurement. As the condition of measurement invariance has
been met, it is acceptable and justifiable to perform a multiple-group analysis
(MGA). The systematic analysis of this proposal will allow comparing the
postulated correlations between Workplace Spirituality, Emotional Intelligence,
Organisational Citizenship Behaviour, and Employee Performance between a doctor
and a nurse, which will be added to the contents that make the findings
substantially relevant to the research.
Discussion
The project
completed a detailed examination of four important workplace aspects—Emotional
Intelligence, Workplace Spirituality, Organisational Citizenship Behaviour and
Employee Performance — among main healthcare professionals working in India,
especially physicians and nurses. Both EFA and CFA were used in this research,
as recommended by Costello and Osborne (2005),
Field (2018) and Hair
et al. (2019). Communalities and a sum of 77.26 percent for the factors
were seen in exploratory factor analysis which is significantly more than the
usual minimum requirement of 60% in social science studies Ajmera
and Jain (2020). The findings show us how emotionally
intelligent people adapt well and why it matters greatly in critical fields
such as healthcare Banerjee
and Doshi (2020). As a result, confirmatory analysis verified
that the four constructs were consistent and reliable for several groups of
professionals. Cronbach’s alpha and composite reliability were greater than
recommended, indicating that all variables have strong and consistent internal
correlations. The AVE value for each variable was over 0.50, proving that the
relationship between each variable and its corresponding construct is strong Shabir
and Gani (2020). Each of the WS, OCB and EP components was
carefully defined using existing research, demonstrating the psychometric
benefits Mallick
et al. (2019). It becomes particularly important to
validate theories in Indian hospitals, since the way psychological ideas are
used there might vary from how they work in the West Garg (2020).
Similar
measurement being applied by both physicians and nursing professionals. Through
this process, both groups were sure the concepts were understood in the same
way, thanks to synchronized measurement procedures Bhattacharyya et al. (2019). The instruments were found structurally
equivalent using c-value analysis, confidence interval assessment and checks
for variance. This meets the necessary conditions for multi-group analysis Patel et
al. (2024). Using the Kaiser-Meyer-Olkin (KMO)
measurement and Bartlett’s Test of Sphericity, additional support was found
that both the sample and dataset were appropriate for factor analysis Singh et
al. (2024). Thanks to eigenvalue retention and the scree test, the exploratory factor analysis was performed
with convincing results, making the used instruments more reliable. These
authors state that the approach corresponds with literature from structural
equation modelling because it combines the EFA’s exploration with CFA’s
confirmation Singh et
al. (2023). Because the data was not normally
distributed and the measurement model was complex, using PLS-SEM through SmartPLS 4 was a smart decision, as proposed by Karthik
and Devi (2023). Because of its flexibility, PLS-SEM is
well-regarded for dealing with small number of participants, unusual data and
mixed construct types, making it a top choice for healthcare field studies Singh
and Banerji (2022). Because of their technical qualities, these
instruments demonstrate their ability to provide reliable guidelines for future
study and action in the Indian healthcare field Jaiswal
and Raychaudhuri (2021).
Conclusion
It provides a
close study of four major workplace ideas: Emotional Intelligence, Workplace
Spirituality, Organisational Citizenship Behaviour and how this affects the
Employee Performance of medical professionals and nursing staff in the Indian
healthcare industry. The authors employed EFA first and then followed with CFA,
confirming that each construct contains several dimensions, is psychometrically
reliable and is relevant in several professional contexts. Running my analysis
using SPSS and SmartPLS 4 allowed me to check all the
factor configurations, reliability measures and validity indicators and I found
they all matched or went beyond the requirement standards. In addition, showing
that the scales are equivalent for all groups empowers their use in medical
settings. As a result of this analysis, workplace behaviour models for
demanding settings have more support and it establishes solid evidence for
future Structural Equation Modelling studies. Thanks to these findings,
healthcare leaders and investigators have the confidence to apply these tools
when making diagnoses, performance measurements and behavioural decisions.
Therefore, this research strengthens both academic discussions and practical
uses by creating measurement tools that mirror cultural and professional
situations, meant to boost the performance and success of Indian healthcare
organisations. These findings are used to inform the next phase, focused on
modelling factors that cause heart conditions and developing effective methods
to control them.
ACKNOWLEDGMENTS
None.
REFERENCES
Ajmera, P., and Jain, V. (2020). A Fuzzy Interpretive Structural Modeling Approach for Evaluating the Factors Affecting Lean Implementation in Indian Healthcare Industry. International Journal of Lean Six Sigma, 11(2), 376–397. https://doi.org/10.1108/IJLSS-02-2018-0016
Balachandar, R., Ketharam, A., and Bharath, S. (2023). Development and Validation of Tools to Screen Occupational Mental Health and Workplace Factors Influencing It: For the Indian Workforce. Industrial Health, 61(3), 184–194. https://doi.org/10.2486/indhealth.2022-0019
Banerjee, D., and Doshi, V. (2020). Gender, Workplace Support, and Perceived Job Demands in the US and Indian Context. Personnel Review, 49(7), 1451–1465. https://doi.org/10.1108/PR-11-2019-0627
Bhattacharyya, P., Jena, L. K., and Pradhan, S. (2019). Resilience as a Mediator Between Workplace Humour and Well-Being at Work: An Enquiry on the Healthcare Professionals. Journal of Health Management, 21(1), 160–176. https://doi.org/10.1177/0972063418821815
Dhir, S., and Dutta, T. (2024). Does Workplace Respect and Organisational Identity Matter in Organisations? Exploration and Validation Through EFA and CFA. Psychological Reports. https://doi.org/10.1177/00332941251352396
Garg, N. (2020). Promoting Organizational Performance in Indian Insurance Industry: The Roles of Workplace Spirituality and Organizational Citizenship Behaviour. Global Business Review, 21(3), 834–849. https://doi.org/10.1177/0972150918778983
Gupta, A., and Kumar, A. A. (2022). Workplace Spirituality in the Indian IT Sector: Development and Validation of the Scale. World Review of Science, Technology and Sustainable Development, 18(3–4), 309–323. https://doi.org/10.1504/WRSTSD.2022.123778
Jain, A. K., Lashkari, M. S., and Jain, A. (2020). Enhanced Employee Well-Being May Improve the Performance of Personnel in Organized Healthcare Sector in Indore (India).
Jain, P. (2022). Cultural Intelligence and Innovative Work Behavior: Examining Multiple Mediation Paths in the Healthcare Sector in India. Industrial and Commercial Training, 54(4), 647–665. https://doi.org/10.1108/ICT-08-2021-0061
Jaiswal, R., and Raychaudhuri, P. (2021). Enhancing Employees’ Organizational Commitment with Perceived Organizational Justice and Organizational Learning Culture in an Indian Healthcare Sector. International Management Review, 17(1), 55–70.
Kabra, G. (2023). Determinants of Blockchain Adoption and Organizational Performance in the Healthcare Sector in India. American Journal of Business, 38(3), 152–171. https://doi.org/10.1108/AJB-12-2022-0206
Karthik, P., and Devi, V. R. (2023). High-Performance Work Systems in the Healthcare Industry: A Systematic Literature Review. Management and Labour Studies, 48(4), 578–606. https://doi.org/10.1177/0258042X231168005
Kumari, A., Singh, A., Ranjan, P., Sarkar, S., Kaur, T., Upadhyay, A. D., … Sethi, P. (2021). Development and Validation of a Questionnaire to Evaluate Workplace Violence in Healthcare Settings. Cureus, 13(11), Article e19959. https://doi.org/10.7759/cureus.19959
Mahipalan, M., and S., S. (2019). Workplace Spirituality, Psychological Well-Being and Mediating Role of Subjective Stress: A Case of Secondary School Teachers in India. International Journal of Ethics and Systems, 35(4), 725–739. https://doi.org/10.1108/IJOES-10-2018-0144
Mallick, E., Pradhan, R. K., Tewari, H. R., and Jena, L. K. (2019). Creating Competitive Advantage Through Informal Networks: Evidence from Indian Healthcare Industries. International Journal of Knowledge Management Studies, 10(3), 299–321. https://doi.org/10.1504/IJKMS.2019.101483
Patel, D. K., Pandey, A., Mishra, R. K., Vinchu, H. S., and Wagh, A. (2024). Work Culture as a Determinant of Mental and Physical Health: Designing Workplaces, Ascertaining Employee Well-Being Within Healthcare Sector. IPE Journal of Management, 14(1), 56–72.
Prakash, N., and Nandini, A. S. (2024). Workforce Sustainability and Quality of Service in Accredited Hospitals in India: Mediating Role of Job Engagement. Problems and Perspectives in Management, 22(1), 25. https://doi.org/10.21511/ppm.22%281%29.2024.03
Sarwal, R., Prasad, U., Gopal, K., Kalal, S., Kaur, D., Kumar, A., … Sharma, J. (2021). Investment Opportunities in India’s Healthcare Sector. OSF Preprints. https://doi.org/10.31219/osf.io/rtup2
Sengupta, M., Roy, A., Ganguly, A., Baishya, K., Chakrabarti, S., and Mukhopadhyay, I. (2021). Challenges Encountered by Healthcare Providers in COVID-19 Times: An Exploratory Study. Journal of Health Management, 23(2), 339–356. https://doi.org/10.1177/09720634211011695
Shabir, S., and Gani, A. (2020). Impact of Work-Life Balance on Organizational Commitment of Women Health-Care Workers: Structural Modeling Approach. International Journal of Organizational Analysis, 28(4), 917–939. https://doi.org/10.1108/IJOA-07-2019-1820
Singh, A., and Banerji, R. (2022). Happiness at Work, Organization Citizenship Behaviour and Workplace Diversity: A Study on Indian Private Sector Bank Employees. Industrial and Commercial Training, 54(3), 460–475. https://doi.org/10.1108/ICT-05-2021-0037
Singh, S. R. J., Sharma, K. K., Mittal, A., and Chand, P. K. (2024). Effect of Motivating Language on Employee Performance: Mediating Role of Organisational Citizenship Behaviour and Employee Engagement in the Healthcare Sector. Global Knowledge, Memory and Communication, 73(8/9), 1025–1043. https://doi.org/10.1108/GKMC-07-2022-0157
Singh, S., Meghrajani, I., Vijh, G., Thomas, J. P., and Mohite, S. (2023). Relationship Between Workplace Incivility, Employee Performance and Employee Engagement in Healthcare Institutions. Asia Pacific Journal of Health Management, 18(2), 251–260. https://doi.org/10.24083/apjhm.v18i2.2409
Srivastava, S., and Prakash, G. (2019). Internal Service Quality: Insights from Healthcare Sector. Journal of Health Management, 21(2), 294–312. https://doi.org/10.1177/0972063419835127
Upadhyaya, D., and Malek, M. S. (2024). An Exploratory Factor Analysis Approach to Investigate Health and Safety Factors in Indian Construction Sector. Construction Economics and Building, 24(1–2), 29–49. https://doi.org/10.5130/AJCEB.v24i1/2.8867
Yadav, R. (2023). A Formative Measurement Model and Development of Quality of Work-Life Scale Based on Two-Factor Theory: Evidence from Indian Private Industries. Benchmarking: An International Journal, 30(5), 1713–1733. https://doi.org/10.1108/BIJ-11-2020-0571
|
|
 This work is licensed under a: Creative Commons Attribution 4.0 International License
© IJETMR 2014-2026. All Rights Reserved.