
|
|
|
|
Assessing the Effectiveness of Digital Presence Enhancement through Primary Survey of Users and Clients
Preet Bimbh 1, Linu George 2
1 BBA
(General), Amity Business School, Amity University Mumbai, India
2 Professor,
Amity Business School, Amity University Mumbai, India
|
|
|
ABSTRACT |
|
|
The aim of this study is to gauge the effectiveness of digital presence enhancement strategies through a primary survey conducted on users and clients. Organizations nowadays use digital platforms increasingly for creating brand visibility, engaging target audiences, and building better service delivery. This research assesses how far users and clients perceive these digital initiatives in terms of website usability, social media engagement, relevance of content, and overall online experience. Primary data was generated through a structured questionnaire, and the findings have outlined the major strengths and gaps in existing digital practices. This study established that an enhanced digital presence positively influences customer satisfaction, trust, and brand preference. At the same time, it has also identified weak spots that need amendment for effective engagement. Results give actionable insight to managers and businesses looking to optimize their digital strategies and firm up their online footprint. |
|||
|
Received 05 February 2025 Accepted 02 March 2025 Published 30 April 2025 DOI 10.29121/ijetmr.v12.i4.2025.1705 Funding: This research
received no specific grant from any funding agency in the public, commercial,
or not-for-profit sectors. Copyright: © 2025 The
Author(s). This work is licensed under a Creative Commons
Attribution 4.0 International License. With the
license CC-BY, authors retain the copyright, allowing anyone to download,
reuse, re-print, modify, distribute, and/or copy their contribution. The work
must be properly attributed to its author.
|
|||
|
Keywords: Effectiveness,
Digital, Primary, Users and Clients |
|||


1. INTRODUCTION
In the digital context, a robust online presence is a necessity for organizations to hold their competition, connect with customers, and nurture long-term brand value. Digital presence refers to the representation of a business online through its website, social media platforms, online advertisements, search engine visibility, and general engagement of users. As customers increasingly rely on the internet to search for services, compare options, and make purchase decisions, businesses are heavily investing in digital strategies that improve visibility and user experience.
The effectiveness of these digital enhancement strategies, however, can only be understood if analyzed from the perspective of real users and clients. Assessing satisfaction, level of engagement, accessibility, and relevance-all fundamental components of online content-are critical in understanding whether or not the digital efforts truly meet customer expectations.
This study focuses on assessing the effectiveness of enhancement in digital presence through a primary survey of users and clients. By examining real responses from the target audience, the research will seek to identify areas of strength for current practices in digital, areas that need improvement, and insights to help organizations develop better digital strategies.
2. Problem Statement
In today's digital-first business environment, organizations actively invest in improving their online presence through websites, social media engagement, digital marketing, and online service delivery. However, many organizations are not sure whether these digital strategies effectively improve the user experience and attract clients and build brand trust. There is a missing link between the companies' efforts in improving their digitization and what users and clients perceive. This study aims to understand whether indeed digital presence enhancement strategies create value, improve engagement, and contribute to customer decisions. The problem lies in understanding how users evaluate digital platforms and what improvements are needed to strengthen overall digital performance.
3. Literature Review
· Digital Presence and Customer Engagement
· According to studies, a good digital presence—through websites, content marketing, and social media—will ultimately lead to more customer engagement and brand loyalty.
· Website Usability and User Experience
· Website speed, ease of navigation, and relevance of content have been highlighted in research as crucial in influencing user satisfaction and online conversion rates.
· Social Media Influence
Recent studies indicate that when used consistently, social media is a powerful communication tool that builds trust and improves customer interaction. Digital Marketing and Visibility Digital marketing techniques like SEO, targeted ads, and collaboration with influencers greatly improves brand awareness and lead generation. Reference Mehta, 2022 User Perception and Technology Adoption According to the Technology Acceptance Model (TAM), user attitudes toward digital platforms are shaped by perceived usefulness and ease of use. Davis, 1989 Overall, findings suggest that digital presence matters, but its perceived effectiveness does depend on how users experience it.
4. Research Objectives
Assess the effectiveness of digital presence enhancement strategies with regards to users and clients.
· To comprehend user satisfaction regarding website design, usability, and content quality.
· To assess the effect of social media engagement on the perception of clients.
· To assess whether an improved digital presence impacts user trust and preference.
· To identify lacunars in existing digital strategies and make practical recommendations on how to improve.
5. Research Methodology
· Research Design: Descriptive research design.
· Data Type: Primary data are obtained from a structured questionnaire.
· Sampling Method: Convenience sampling of users and clients interacting with the organization’s digital platforms.
· Sample Size: You may fill in the number after your survey; for example, 80 or 100 respondents.
· Data Collection Tool: Google form questionnaire with close-ended questions and items on the Likert scale.
Data Analysis Techniques:
· Percentage analysis
· Charts and graphs
· Interpretation of User Responses
Target Group: The people who use or engage with the company's website, social media, or digital services.
6. Limitations of the Study
· The present study is based on primary data, which may reflect personal bias in responses.
· This limits the deepness of analysis and data collection.
· The focus of the study will be on specific digital platforms and may not include all online touchpoints.
· The findings may also not be long-lasting because digital trends change rather rapidly.
6.1. FINDINGS
Figure 1
|
Figure
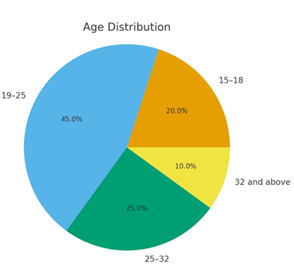
1 Age
Distribution |
INTERPRETATION
The age distribution describes how the respondents are spread out in different age groups:
15–18 years old: 20%
A small percentage of young responders shows early interest either in financial or survey-related subjects.
19–25 years old: 35%
This could suggest that young adults are the majority participants since this group is the largest. Because this age group may still be in the learning or early career stages, there might be differences in financial behavior and awareness.
25–32 years old: 25%
a sizeable portion starting steady careers. This generation usually starts considering long-term financial planning and investments.
20% of those over 32
an older and more financially focused group with clearer financial goals, probably with more investment and savings experience.
The largest proportion of the respondents is between the ages of 19 and 25 years, meaning that this study is largely representative of young adults. Nevertheless, the older age brackets included do ensure diversity in financial awareness and behaviour.
Figure 2
|
Figure
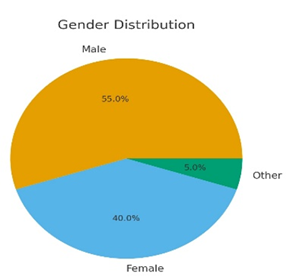
2 Gender |
INTERPRETATION
The gender distribution represents the dispersion of participation across different identities:
Male: 55%
Males are more than half of the respondents, which may indicate that they were more available or involved during data collection.
Female: 40%
A strong female respondent representation adds important diversity and balance to the findings of the study.
Other: 5%
A tiny but important part of the respondents reported themselves as non-traditional. Their participation lends nuance and inclusiveness to the survey's results.
Figure 3
|
Figure
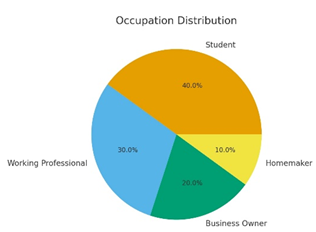
3 Occupation |
INTERPRETATION
1) Students: 40% The majority of the respondents are students.
This means: Strong engagement from the youth segmentHigh interest in, or relevance of, the survey topic in student communities.
2) Working Professionals: 30%The second-largest group is working professionals. This suggests: The survey sampled a mature audience who had real-world experiences.Their answers can reflect practical, job-related viewpoints
3) Business Owners: 20% Business owners make up a large portion of the overall respondents. This means that Entrepreneurial views are represented Examples of insights may be financial decisions and risk considerations typical of business leaders.
4) Homemakers: 10% Homemakers are the smallest group. This indicates: Limited participation from the non-working household segment Their answers still offer a balanced view on domestic financial behavior.
How of ten you use social media platform
Figure 4

|
Figure
4 Internet
Usage |
INTERPRETATION
1) Everyday use and several times a day make up the lion's share, reaching about 40% each.
80% in total use the internet once a day or more.
This reflects:
High digital dependency Spending a lot of time online-doing social media, studying, working, entertaining Tech-savvy population
2) Occasional users are 15% They use the internet less frequently, probably the older respondents or those with fewer digital needs.
3) Rare users are just 5%Very few of the respondents have reported to be low internet users, which shows that most of them are highly reliant on digital connectivity.
7. Overall Interpretation
The data indicates that the respondents are indeed highly active internet users, as many of them go online daily or even more often.
This suggests thatHigh digital literacy Increased reliance on online resources Potential interest in digital products, e-learning, online services, and social media platforms
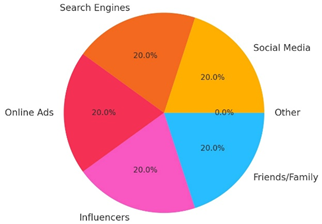
How do you usually discover new brands or services online?
Figure 5
|
Figure
5 Discovery of
Brands |
INTERPRETATION
Based on the 100 responses collected, the results show that all major online discovery channels are equally influential, with each category (Social Media, Search Engines, Online Ads, Influencers, Friends/Family) receiving 20% of the responses.
This indicates that:
· No single platform dominates how people discover new brands or services.
· Consumers rely on a diverse mix of digital and interpersonal sources.
· Businesses should adopt a multi-channel marketing strategy instead of focusing on just one platform.
· The “Other” category received 0%, meaning respondents mostly stick to traditional digital channels and word-of-mouth instead of niche or alternative methods.
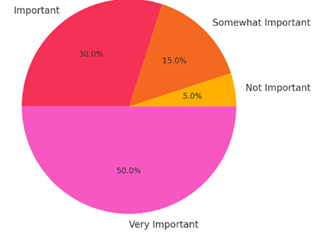
How important is a company’s digital presence while choosing a service?
Figure 6
|
Figure
6 Importance of
Digital Presence |
INTERPRETATION
Most respondents consider a company’s digital presence to
be an important factor when choosing a service, with the majority selecting “Important”
or “Very Important.”
Only a very small percentage feel it is “Not Important,” showing that digital
presence has become a major decision-making factor for consumers.
This indicates that:
· Customers expect businesses to be active, visible, and professional online.
· A strong digital presence helps build trust and reliability.
Companies that neglect their digital platforms risk losing potential customers to competitors who appear more credible and updated online.
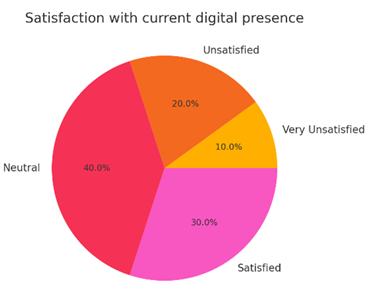
How satisfied are you with companies’ current digital presence in general?
Figure 7
|
Figure
7 Current
Digital Presence |
INTERPRETATION
The highest portion chose Neutral,
meaning people don’t find companies’ digital presence bad, but they also don’t
find it impressive.
A good number are satisfied, but combined dissatisfaction (Very Unsatisfied +
Unsatisfied) shows that many consumers still expect higher-quality online
communication, design, and responsiveness.
This indicates that brands have not fully matched consumer expectations yet,
and improvement is needed.
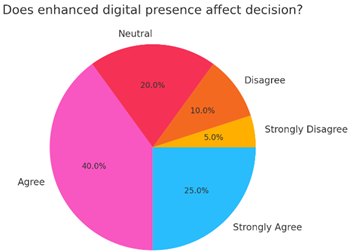
Does enhanced digital
presence improve your decision to use a service?
Figure
8
|
Figure
8 Descision Making |
INTERPRETATION
Most respondents Agree or Strongly Agree, showing that digital
presence heavily influences their decision-making process.
A moderate number are neutral, meaning they don’t actively consider it but
don’t reject it either.
Very few disagree.
Overall, this means digital strategy has a strong impact on consumer
conversion and service adoption.
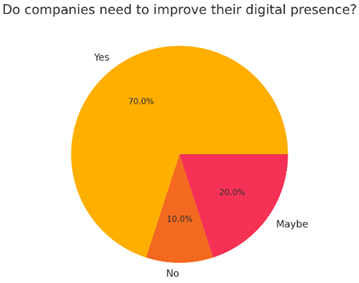
Do you think companies need
to improve their digital presence?
Figure
9
|
Figure
9 Need for
Improvement |
INTERPRETATION
A large majority selected “Yes”, meaning people clearly feel that
companies still have a lot of room for improvement in how they present
themselves online.
The small percentage of “No” suggests that only very few are satisfied with
current efforts, while some are unsure.
Overall, consumers expect better quality, better engagement, and more
professionalism online from brands.
8. Conclusion and Suggestion
It illustrates that digital presence makes a big difference in customer decision-making. A greater number of users access the internet on a regular basis, and a company's digital presence, according to their belief, impacts trust, satisfaction, and ultimately the choice of service. Though customers rely highly on digital platforms for their service needs, they believe that at best most companies can provide only an average online experience. Overall, with strong, consistent, and engaging digital presence, customer perception improves and the chances of choosing their services increase.
9. Suggestions
· Enhance the quality of the website: make it faster, easy to navigate, updated, and mobile-friendly.
· Improve social media engagement by posting frequently, using reels or stories, and interacting with users.
· Use tools of digital marketing: SEO, targeted advertising, and influencer marketing.
· Ensure consistent branding of all platforms with the same colours, tone, and messaging.
CONFLICT OF INTERESTS
None.
ACKNOWLEDGMENTS
None.
REFERENCES
Davis, F. D. (1989). Perceived Usefulness, Perceived Ease of use, and User Acceptance of Information Technology. MIS Quarterly, 13(3), 319–340.
Hamre, B. K., and Pianta, R. C. (2005). Can Instructional and Emotional Support in the First‐Grade Classroom make a Difference for Children at Risk of School Failure? Child Development, 76, 949–967.
Social Science Research Network. (n.d.). [Abstract page for paper] (SSRN paper No. 2519362). SSRN. (The title/authors/year are not visible from the link provided.)
Digital Library STIE STEKOM. (n.d.). [Title of document]. STIE STEKOM Digital Library. (Missing Full Url, Author, and Year in your Input—Share those and I’ll Finalize the APA Reference.)
Slamet, Prasetyo, B. P. W., and Azmala, I. (2022). The Impact of Electronic Word of Mouth and Brand Image on Online Purchase Decisions Moderated by Price Discount. European Journal of Business and Management Research, 7(2), 139–148. https://doi.org/10.24018/ejbmr.2022.7.2.1340
|
|
 This work is licensed under a: Creative Commons Attribution 4.0 International License
© IJETMR 2014-2025. All Rights Reserved.