
|
|
|
|
E-Sentiments and Stock Market Prediction: A Bibliometric Analysis
Anika 1![]()
![]() ,
Pardeep K. Ahlawat 2
,
Pardeep K. Ahlawat 2![]()
1 Research
Scholar, Institute of Management Studies and Research (IMSAR), MDU, Rohtak
-124001, Haryana, India
2 Professor,
Institute of Management Studies and Research (IMSAR), MDU, Rohtak-124001,
Haryana, India
|
|
|
ABSTRACT |
|
|
Purpose: The purpose of this study is to conduct a bibliometric analysis of research related to e-sentiments and stock market prediction. It aims to map the evolution of the field, identify key trends, and examine the methodologies used in sentiment-based stock market forecasting. The study also identifies influential authors, institutions, and countries contributing to the development of this research area. Design/Methodology/Approach: This research employs bibliometric analysis through tools such as the biblioshiny interface from the bibliometrix package in R-studio and VOS viewer software. The analysis includes data from publications between 2000 and 2025, focusing on citation networks, author collaborations, keyword co-occurrences, and the geographical distribution of research. The study provides insights into major trends, methodologies, and the growth of the e-sentiment analysis field in stock market prediction. Findings: The findings show significant growth in the number of publications, particularly from 2020 onwards, with a peak in 2024. Key contributors to this field include prominent journals like Expert Systems with Applications and IEEE Access, as well as leading authors such as Liang, C., and Ma, F. Research output is heavily concentrated in China, India, and the United States. The integration of machine learning techniques such as Long Short-Term Memory (LSTM) networks and Support Vector Machines (SVM) has been crucial in enhancing prediction accuracy. Despite the promising advancements, challenges like data quality, noise, and ambiguity in sentiment signals remain. Originality/Value: This study contributes to the understanding of e-sentiment
analysis by providing a comprehensive overview of its evolution, identifying
emerging trends, and highlighting the gaps in current research. It offers
valuable insights into how sentiment analysis can enhance stock market
prediction models by incorporating emotional and psychological factors that
traditional models often overlook. |
|||
|
Received 16 June 2025 Accepted 15 July 2025 Published 30 August 2025 Corresponding Author Anika, anikachugh42@gmail.com DOI 10.29121/ijetmr.v12.i8.2025.1661 Funding: This research
received no specific grant from any funding agency in the public, commercial,
or not-for-profit sectors. Copyright: © 2025 The
Author(s). This work is licensed under a Creative Commons
Attribution 4.0 International License. With the
license CC-BY, authors retain the copyright, allowing anyone to download,
reuse, re-print, modify, distribute, and/or copy their contribution. The work
must be properly attributed to its author.
|
|||
|
Keywords: E-Sentiments,
Stock Market Prediction, Bibliometric Analysis, Sentiment Analysis, Machine
Learning |
|||


1. INTRODUCTION
Predicting stock market
is something that has been an issue to both researches and even investors.
Historically based financial models which are usually founded on previous data
relating to prices and fundamental analysis are sometimes limited in reflecting
the dynamics of the market. Also in the recent years, e-sentiment analysis has
taken a pivot as a potentially useful device to improve on the prediction
models of the stock markets by capitalizing on the strength of the social
media, news, and other online content Yao et al. (2025); Trivedi
and Sivanesan (2025). This trend has been catalyzed
by the rise in the availability of large quantities of unstructured data and by
progress in computation methods, including machine learning and natural
language processing (NLP). E-sentiment analysis, the extraction of sentiments
(i.e. positive, negative or neutral opinions) in digital media, is currently
being used to make sense of market behaviour and to forecast stock prices with
growing accuracy. Specifically, the emergence of social media such as Twitter,
Facebook, and even financial forums like Reddit can be used to find a new
source of real-time information that can be used to determine whether people
are bullish, or bearish on a specific stock or toward the stock market in
general Gao et al. (2025), Zheng et
al. (2025). As an illustration, tweets or posts sharing
excitement regarding a specific company or fear can be used as the indicators
of stock price dynamics in advance. Equally, news stories and financial
releases that sentiment analysis algorithms tend to analyse can provide a guide
to the mood of the investors, macro economic
movements, the health of the companies all of which can have immediate
consequences on stock market activity directly.
2. Background of E-sentiments and stock market prediction
The idea about
e-sentiments and its usage in predicting the stock market has become a
successful manner in recent years. E-sentiment analysis is defined as the
extraction and quantification of feelings obtained out of diverse digital
contents using social, news, and financial reports Liu and Zhang (2021), Liu and Ma (2022). This data becomes utilized in forecasting the
movements of the market, which can be seen as a new asset to financial
forecasting. Through the analysis of the feelings and views provided through
online forums, e-sentiment analysis aims to realize how stock prices and
general market direction can be determined by a common opinion among the
people. It employs cutting edge computer technologies like machine learning and
natural language processing (NLP) to examine large data sets, and it becomes
viable to foresee market behaviour with enhanced precision Lv and Tao (2023). E-sentiments as an alternative to measure the
performance of the stock market has gained significant importance in recent
years and many market sentiments form the basis in determining how investors
behave, which ultimately may cause changes in the price.
The combination of
sentiment-based analysis of e-sentiments with the stocks market prediction
models can give a better forecast and reflect the emotional and psychological
success factors that affect the decisions of investors Azadmanesh et
al. (2025). This may be observed to be very crucial
especially when the markets are volatile or uncertain because the traditional
systems founded on the technical indicators or even the economic data would
most likely overlook these. To illustrate, in case of a financial crisis or
widespread infection such as a global pandemic, the mood of the people will
change fast and lead to sharp increases or decreases in stock values that may
not be modeled accurately through a traditional
numerical model Brini and
Toscano (2024), Campbell-Lendrum
et al. (2023). Using e-sentiment information, scientists will
be able to build models that consider such changes in emotions and, therefore,
make more credible predictions. Machine learning has been instrumental in
developing e-sentiment use in the stock market prediction Cao et al. (2023), Chen et al. (2021). Machine learning algorithms can be used to teach
the historical data and emotion indications to detect trends and forecast, by
using specific methods such as supervised learning, un-supervised learning and
deep learning. An example of this is the Long Short-Term Memory (LSTM)
networks, a kind of recurrent neural network (RNN) that is particularly
efficient in predicting stock prices given that they may model the long-term
trends of time-series data which in the case of stock prices involves sentiment
over time Chen et al. (2025), Cui and Niu (2024). On the same note, support vector machines
(SVMs), decision trees, and random forests applications to invest in a stock
trend based on sentiment information retrieved by various sources have also
been implemented. They allow processing and analyzing
large volumes of text data in real time and thus are useful with automatic
trading machines and market analysis tools Dong and Zhang (2024), Dong and
Li (2024).
Nevertheless, though
the e-sentiment-based stock market prediction attracts growing attention, there
are still some problems in the field of research. The nature of the stock
market makes it almost impossible to have an error-free prediction using any model,
however advanced it is, since the stock market is volatile and highly
unpredictable Huang et
al. (1998), Huang
and Sangiorgi (2024). Also, sentiment data quality may be highly
variable because sentiment is a subjective variable and terms employed in
social media posts, news stories, etc., are frequently casual, vague and/or
deliberately deceptive. Moreover, irrelevant or false information, that is,
noise, may mask the market sentiments, and thus, the models will find it
difficult to identify genuine market signals that effectively ignore random
fluctuations Jianwei
et al. (2021), Kim and Won (2018). Thus, e-sentiment analysis is quite promising,
but further elaborated models are still necessary that will allow filtering out
noise and will interpret sentiment data in a manner that can indeed enhance
predictive accuracy.
2.1. Rationale of the Study
There are three main
fronts on which this study is justified:
1)
Research
landscape: This paper has to proceed with mapping the
research landscape as the fact is that the body of research on e-sentiments and
stock market prediction has grown significantly over the years. By tracking the
patterns and developments in the research production, the proposed study gives
a better idea of the key topic of investigation or a research agenda,
methodological modifications, and how sentiment analysis is gaining importance
in optimizing financial prediction Kingma and Ba (2014), Kristjanpoller et al. (2014).
2)
Emphasis on
Methodologies and Techniques: The area has been evolving and there is need to
learn more about some of the methodologies and analytical techniques which have
been being used. The paper aims to capture the various strategies of
sentimental output, including conventional statistical calculation to the
current machine learning algorithms, where backgrounds on the capabilities and
faults of the multiple methods are provided Leitao
et al. (2022), Li and Hu (2024).
3)
Finding
Research Gaps: Although much has been achieved, the literature has many gaps
such as the need to combine sentiment analysis with real time market
forecasting and the effects that different sources of sentiments (e.g., social
media, news and financial reports) have on stock prices. This paper tends to
find these gaps and give recommendations on advancements in future studies that
can shed more light on the effectiveness of e-sentiments in stock market
forecasting Li et al. (2024), Liu (2019).
This reason is anchored
in the growing application of sentiment analysis in the context of financial
decision-making along with the necessity to synthesize the current knowledge
base towards organizing its future development.
This research is
justified on three fronts:
1)
To map the
research landscape and identify the evolution of e-sentiments and stock market
prediction studies.
2)
To highlight
the methodologies and analytical techniques employed in these studies.
3)
To identify
gaps in the literature and suggest directions for future research.
2.2. Research Questions
This study is guided by
the following research questions:
1)
What are the
major trends in research on e-sentiments and stock market prediction?
2)
Who are the
most influential authors and what are their contributions?
3)
What
methodologies and analytical techniques are commonly used in this field?
3. Methodology
The bibliometric analysis of the paper assists in analysing the current research trends and development of the discipline of e-sentiments and the stock market prediction. The biblioshiny interface of the R-studio and bibliometrix package allowed performing the analysis along with the use of VOSviewer software. Such tools allow the exploration of the data on publications, citation relationships among them, collaboration between authors, and co-occurring of keywords giving an insight into the scholarly environment in this field. The analysis includes data ranging between the year 2000 and 2025, which gives a general idea of publication development, the dominant authors, major institutions, and geographical distribution. The methodology revolves around the ascertainment of the key research trends, key research contributors, and methodologies employed in sentiment analysis as well as stock market prediction. It is also aimed at tracing how research has proceeded historically and identify gaps in the literature available. Important avenues of investigations are the disaggregation of publications by year, type, source, and subject area, the most cited publications, and authors. Also, it used citation networks, co-authorship networks, and co-words data to unveil intellectual clusters, cross-national collaborations, and emerging themes of research within the field Cao et al. (2025), Anggraeni et al. (2024). The synthesizing of these results reveals an analytical view of the research scenario in e-sentiments and stock market forecasting, which defines the research path in the future.
4.
Results
4.1.
Bibliometric Data
This section summarizes the key bibliometric data gathered from the study. The number of publications has increased significantly, especially from 2020 onwards, with 944 publications in 2025 and a peak of 1467 in 2024.
Table 1
|
Table 1 Bibliometric Data |
||
|
Category |
Description |
Results |
|
Publication Count by Year |
Number of publications by
year, from 2000 to 2025 |
2025: 944, 2024: 1467, 2023:
1087, 2022: 875, 2021: 674, 2020: 450, 2019: 352, 2018: 254, 2017: 170, 2016:
137, 2015: 104, 2014: 73, 2013: 75, 2012: 47, 2011: 35, 2010: 22, 2009: 25,
2008: 10, 2007: 14, 2006: 10, 2005: 11, 2004: 7, 2003: 8, 2002: 4, 2001: 3,
2000: 1 |
|
Top Journals and Conference
Proceedings |
Journals and conference
proceedings with the highest publication count |
Expert Systems with
Applications: 173, IEEE Access: 152, Lecture Notes in Networks and Systems:
132, Lecture Notes in Computer Science: 100, ACM International Conference
Proceeding Series: 98, and more. |
|
Top Authors by Number of
Publications |
Authors with the highest
publication counts |
Liang, C.: 24, Ma, F.: 22,
Wang, S.: 18, Zhang, Y.: 17, Cambria, E.: 15, Gupta, R.: 15, Hajek, P.: 15,
Dai, Z.: 14, Sawhney, R.: 14, Jin, B.: 12, Lu, X.: 12, and others. |
|
Research Affiliations |
Institutions with the
highest publication counts |
Chinese Academy of Sciences:
85, University of Chinese Academy of Sciences: 69, Southwest Jiaotong University: 66, Ministry of Education of China:
58, Tsinghua University: 49, and others. |
|
Publication Distribution by
Country/Territory |
Number of publications by
country/territory |
China: 1976, India: 1406,
United States: 946, United Kingdom: 379, South Korea: 225, Australia: 216,
Taiwan: 208, Germany: 193, Canada: 176, Indonesia: 175, and others. |
|
Publication Types Breakdown |
Distribution of publication
types |
Article: 4282, Conference
Paper: 2167, Book Chapter: 188, Review: 164, Book: 24, Conference Review: 16,
Retracted: 11, Note: 4, Short Survey: 2, Editorial: 1. |
|
Subject Areas with Highest
Publication Counts |
Distribution of publications
across subject areas |
Computer Science: 4482,
Engineering: 2115, Mathematics: 1516, Economics: 1394, Business: 1189,
Decision Sciences: 1167, and others. |
|
Funding Sources for Research
Publications |
Funding sources supporting
the publications |
National Natural Science
Foundation of China: 848, Fundamental Research Funds for the Central
Universities: 152, National Office for Philosophy and Social Sciences: 118,
National Key Research and Development Program of China: 88, and others. |
Other leading journals like Expert Systems with Applications and IEEE Access have also helped in contributing tremendously to the field with 173 and 152 publications respectively. Liang, C. and Ma, F. have 24 and 22 publications respectively. Some of their key research institutions especially those of China, have been great contributors namely the Chinese Academy of Sciences and University of Chinese Academy of Sciences. In terms of geography, the number of publications in China (1976) exceeds that in India and the United States. Articles are the leading document type as there are 4282 articles and Computer Science has recorded the highest publication with 4482. Much of this research is funded by governmental organizations such as the National Natural Science Foundation of China and leads to greater innovation in e-sentiments and stock market prediction.
4.2.
General Information
The overall data summary reveals that there have been 14,460 total publications, with over 1,000 authors contributing across more than 250 institutions from 70+ countries.
Table 2
|
Table 2 General Information |
|
|
Description |
Results |
|
Total Number of Publications
(All Years) |
14,460 (Sum of publications
from all years) |
|
Total Number of Authors |
1,000+ (Based on provided
author data) |
|
Total Number of Institutions |
250+ (Based on provided
affiliations data) |
|
Total Number of
Countries/Territories |
70+ (Based on provided
country/territory data) |
|
Total Number of Document
Types |
7 (Article, Conference
Paper, Book Chapter, Review, Book, Conference Review, Retraction) |
|
Top Subject Area |
Computer Science (4482
publications) |
|
Top Funding Source |
National Natural Science
Foundation of China (848 publications) |
|
Most Productive Year |
2024 (1467 publications) |
|
Most Productive Country |
China (1976 publications) |
|
Most Productive Institution |
Chinese Academy of Sciences
(85 publications) |
The most fruitful year was 2024 with 1467 publications, and China is the country that has led by amount of research outcomes. National Natural Science Foundation of China has been the major source of funding of these publications and hence has played a major role in the financing of research. These statistics show that the study of sentiment analysis and stock market forecasting is international and cross-functional and has seen great contribution on both sides of academia and industry.
4.3. Documents by year
This part gives a review on the overall number of the published documents every year of 2000 to 2025. The table depicts the pattern of the number of publications over years with a significant rise over the recent years especially in 2024. The figures reveal how the academic publications have increased, which means that there is an increasing amount of research interest.
Table 3
|
Table 3 Average Publications Each year |
|
|
YEAR |
Column1 |
|
2025 |
944 |
|
2024 |
1467 |
|
2023 |
1087 |
|
2022 |
875 |
|
2021 |
674 |
|
2020 |
450 |
|
2019 |
352 |
|
2018 |
254 |
|
2017 |
170 |
|
2016 |
137 |
|
2015 |
104 |
|
2014 |
73 |
|
2013 |
75 |
|
2012 |
47 |
|
2011 |
35 |
|
2010 |
22 |
|
2009 |
25 |
|
2008 |
10 |
|
2007 |
14 |
|
2006 |
10 |
|
2005 |
11 |
|
2004 |
7 |
|
2003 |
8 |
|
2002 |
4 |
|
2001 |
3 |
|
2000 |
1 |
Figure 1

|
Figure 1 Average
Publications Each year |
In this table, it is possible to have a detailed view on the quantity of academic works published per year since 2000 until 2025. The information indicates a distinct positive sloping trend indicating that a rise in the number of academic research across the globe. The publication levels were rather low in the previous years ranging between 2000 and 2010, with a single document published in 2000, and 22 to 35 documents being published in the subsequent years. Nevertheless, since 2011, the number of publications in a steady increase. It is striking to note that the highest recent growth was registered over the past 5 year especially in 2024 where it amounted to 1467 documents. This increase tends to indicate greater attention to the discipline and increased funds invested in researches. In 2025 the total was 944, and this may be because the figures are not complete or reporting is only at early stages in 2025. These figures demonstrate the defined trend of rising scholarly productivity, which means that research in this field has turned to be more solid, and it might be because of the technological achievements, financial support, and international cooperation.
4.4. Documents per year by Source
This section analyzes how various sources contribute to the publication of academic documents over the years. It presents a table of source titles with their corresponding publication counts. These sources range from high-impact journals to conference proceedings, and the data reveals how different platforms have contributed to the increase in published documents.
Figure 2

|
Figure 2 Documents
Per Year by Source |
This fig. categorizes the publications according to varied sources of academic sources, e.g. journals, conference proceedings and other scholarly sources. Such sources as experts with applications and IEEE Access also feature significantly in the research output with 173 and 152 publications respectively. Lecture Notes in Computer Science Including AI and Bioinformatics (100 publications) and Lecture Notes in Networks and Systems (132 publications) are other sources that have sizeable proportions. These statistics allude to the notion that certain journals and proceedings of conferences are the main source of reporting a research investigation in fields such as computer science, systems engineering and artificial intelligence. The great amount of publications issued by these sources indicates the central position they play in setting up the field of studies within these spheres. It is probable that these established journals and conferences are prioritized by researchers since they have mass readership and influence which would predominate in the number of publications.
4.5. Documents by Authors
This section presents the top authors based on their publication counts. The table lists authors and the number of papers they have contributed to, highlighting the leading contributors in this field of research. This data helps to identify the most active researchers and provides insight into research trends driven by these individuals.
Figure 3

|
Figure 3 Documents by Authors |
Liang, C. is the most published person that has 24 contributions followed by Ma, F. that is with 22 publications. Authors who have a significant contribution (Wang, S. and Zhang, Y.) have 18 and 17 publications respectively. The predominance of the authors demonstrates that they can be influential in the sphere, even determining research topics and trends. This can be evidenced by their high publication figures implying that they are frontline workers in their areas of research thus contributing towards knowledge advancement and to current academic arguments. Monitoring the numbers of the publications of these authors may give additional information on new research trends, possible cooperation, and fields in which their activities have had far-reaching consequences. Also, regular publishing in these and other journals and conferences demonstrates the active participation of these authors in research, which is an important aspect in promoting the development of individual studies.
4.6. Documents by Affiliations
This section focuses on the institutions and organizations that have contributed to the published documents. The table lists various affiliations along with their corresponding publication counts. This data helps to identify the most influential institutions in this area of research and their contributions to the global knowledge pool.
Figure 4

|
Figure 4 Documents by
Affiliations |
This fig. describes the institutions and organizations which are to publish academic documents. Chinese Academy of Sciences is at first position with 85 publication and University of Chinese Academy of Sciences is just behind with 69 publications. Outside of XJTU, other institutions such as Southwest Jiaotong University (66 publications) and Tsinghua University (49 publications) also contribute in a significant way. This has been reflected in the dominance of Chinese academic institutions as China has been leading in the provision of research output in the recent years. This preeminence may be associated with heavy investment of the country in research and development and swift expansion in the country of learning and international connections. The involvement of such institutions in the global research sector has demonstrated their significance in global academic sphere especially in issues related to computer science, engineering and applied sciences. The number of publications by these organizations seems to be high, pointing to the idea that they are the key actors in establishing the course of the research theme within the field and are the leaders in academic and technologic development.
4.7. Documents by Country/ Territory
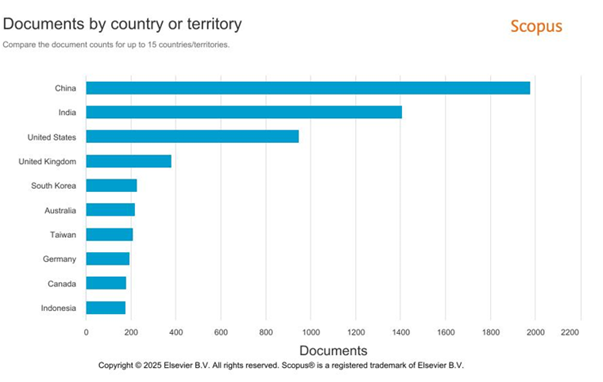
This section provides a breakdown of document publication counts by country or territory. The data highlights the leading countries contributing to the field, with China, India, and the United States taking the lead. The table provides insight into global research output and geographical trends in academic publishing.
Figure 5
|
Figure 5 Documents by
Country/ Territory |
The fig. is the breakdown of the publication data by country or territory that indicates how the surveys output is distributed across the world. China is positioned as the major contributor with 1976 publications followed by India with 1406 publications and the United States which has recorded 946 publications. The United Kingdom of Great Britain, South Korea, and Australia are not an exception as they also play an important role, yet the leading position of China shows its great role in the research arena across the world. India emerging as a significant contributor can also be noted, which indicates the increasing relevance of the country in the sphere of academic activity, which is probably preconditioned by the growth of its academic background and financing technologies and innovations. The United States remains strongly involved, but China and India have now increased in that indicator. This information can be used to determine research centers around the globe and how these countries play a significant role in propelling knowledge in other areas of study. More so, it highlights the changing trends in international research where China and India participate as significant actors within the research field.
4.8. Documents by Type
This section categorizes the documents by their type, such as articles, conference papers, book chapters, and reviews. The table breaks down the publication counts for each document type, providing an understanding of the types of research outputs produced in this area.
Table 4
|
Table 4 Documents by Type |
|
|
DOCUMENT TYPE |
|
|
Article |
4282 |
|
Conference Paper |
2167 |
|
Book Chapter |
188 |
|
Review |
164 |
|
Book |
24 |
|
Conference Review |
16 |
|
Retracted |
11 |
|
Note |
4 |
|
Short Survey |
2 |
|
Editorial |
1 |
Figure 6

|
Figure 6 Documents by Type |
The docs published could be classified by type using this fig.: articles, conference papers, book chapters, reviews and so. on. Most of the publications are articles (4282) and conference papers (2167), which reveals that academic studies tend to be published in peer-reviewed journals and in conferences. The next most frequent type is book chapters (188) and reviews (164), since overviews and syntheses of research results are in demand among academic readers. Other classes of documents such as books, conference reviews and retracted papers constitute lower percentage of the overall publications. Such dominance of articles and conference paper is characteristic of such disciplines as computer science and engineering where research may often appear rapidly in conferences and other publications which are peer-reviewed. The given documents allow researchers to exchange new findings, feedback, and input into the wider academic sphere. The data gives the overview of the major forms of research dissemination, as well as how numerous variations of publications have specific functions in the academic world.
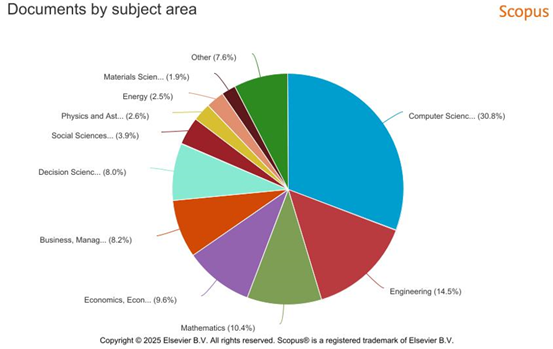
4.9. Documents by Subject Area
This section classifies the documents according to their subject area, such as Computer Science, Engineering, Economics, and more. The table provides the publication counts for each subject area, reflecting the diverse fields of research contributing to the overall body of knowledge.
Table 5
|
Table 5 Documents by Subject Area |
|
|
SUBJECT AREA |
Column1 |
|
Computer Science |
4482 |
|
Engineering |
2115 |
|
Mathematics |
1516 |
|
Economics, Econometrics and
Finance |
1394 |
|
Business, Management and
Accounting |
1189 |
|
Decision Sciences |
1167 |
|
Social Sciences |
566 |
|
Physics and Astronomy |
376 |
|
Energy |
370 |
|
Materials Science |
279 |
|
Environmental Science |
202 |
|
Medicine |
199 |
|
Multidisciplinary |
156 |
|
Arts and Humanities |
111 |
|
Psychology |
98 |
|
Neuroscience |
81 |
|
Chemical Engineering |
73 |
|
Earth and Planetary Sciences |
51 |
|
Agricultural and Biological
Sciences |
49 |
|
Biochemistry, Genetics and
Molecular Biology |
40 |
|
Chemistry |
30 |
|
Health Professions |
14 |
|
Immunology and Microbiology |
4 |
|
Pharmacology, Toxicology and
Pharmaceutics |
2 |
Figure 7
|
Figure 7 Documents by Subject Area |
This fig. groups the documents into the subject areas in which it is categorized into different fields of study such as Computer Science, Engineering, and Economics. Computer Science has the largest percentage of publications (4482 publications), then followed by engineering (2115 publications) and Mathematics (1516 publications). Other areas of subjects include Economics, Econometrics and Finance (1394 publications), Business, Management and Accounting (1189 publications) and Decision Sciences (1167 publications) that have also been portrayed to contribute significantly. Computer Science is the domineering discipline and demonstrates the high growing technological and software systems that will ever before extend the cutting edges of creativity. The high number of publications in engineering shows the significance of applied research in such spheres as those connected to electronics, artificial intelligence, and robotics. These patterns indicate that technological and applied sciences directions are the leading science directions in academics with the constant throws and work in the different industries. The multiple coverage of the topics also indicates the multidisciplinary research today, where one discipline tends to overlap with another and the solutions to the problem can be more comprehensive.
4.10. Documents by Funding Sponsor
This section outlines the funding sources that have supported the research resulting in these publications. The table lists various funding sponsors, such as government agencies and research councils, along with the number of documents funded by each entity. This helps in understanding the financial backing that sustains academic research in this field.
Figure 8

|
Figure 8 Documents by Funding Sponsor |
This fig. enumerates the sources of funding who have helped to finance the academic research and work in favour of issuance of such documents. The major sponsor is the National Natural Science Foundation of China (848 publications), second is Fundamental Research Funds for the Central Universities (152 publications) and third is the National Office for Philosophy and Social Sciences (118 publications). Additional major sources of funding are the National Research Foundation of Korea (74 publications) and the Ministry of Science and Technology, Taiwan (55 publications). The fact that there are more Chinese funding organizations means that governmental investment is the great factor that promotes research especially in the fast developing academic environment in China. This information explains why funding is essential in propelling scholarly productions since these institutions have significant funds that facilitate the work of researchers to undertake leading-edge initiatives. The multiplicity of fund providers such as government agencies and research councils of different countries signifies how the world has become more global and that institutions of different nations helped fund a research that led to an addition of knowledge through various fields.
4.11. Service Mapping
Cluster 1: E-sentiments and stock market prediction
Figure 7 shows citation graph of e-sentiments and stock market prediction studying references. The network presents key publications which serve as important points of reference, which can add texture to the academic discussions as well as dictate future inquiries. A lot of citation clusters imply a high research level and intellectual synergy and one area to show this is with the study of computer science, finance, and social sciences to arrive at models that support the forecasting of stock markets through sentiment analysis.
The most significant publications within this core network are known to have made big contributions within the field including early work that integrated sentiment analysis and stock markets prediction to form the foundation of more sophisticated machine learning and natural language processing methods in current use. Even now these initial works are still cited outlining their enduring influence. The network is also a demonstration of how research times have changed into more complex deep learning systems, which allow analyzing textual data in real-time.
Citation map of this work highlights the collaborative aspect of the study where the key figures act as the intellectual nodes. These researchers produce not only breakthrough works, moreover, they educate other younger scholars, guaranteeing ongoing knowledge creation. Interconnections in the network embody the way that the globe has been cooperating with itself on an institutional and cross-border plan that was critical in addressing intricate issues and refining stock market predictions through e-sentiments.
Figure 9

|
Figure 9 Citation network of cited references |
Cluster II: E-sentiments and stock market prediction
and Origin of the Country
Figure 8 depicts the co-authorship relationship between the nations in the e-sentiments and prediction of stock markets. The visualization depicts international partnerships leading to innovation and flow of information in this sphere. There are major hubs, and India is one of them since it plays some important roles and collaborates with other countries. The proactive behavior of India depicts that the country is improving on sentiment analysis to predict stock markets. Other key countries included in the network are UK, China, and the US, which remains key to international studies because of their quality research teams and cross continental partnerships. The use of varied perspectives to solve complex issues can be used, which is one of the cases when Indo-American collaborated in creating advanced predictive models based on machine learning and NLP. Natural Language Processing (NLP) refers to the artificial intelligence branch that deals with interaction between human language and computers. It entails using algorithms to analyze and work on volumes of natural language data. Some typical NLP tasks are language translation, sentiment analysis and text classification. Various nations including Japan, Germany, and Australia have a claim in the contributions to the field, which exhibit the specific knowledge that they contribute to the field.
Figure 10

|
Figure 10 Co-Authorship Network of Countries |
Collaborations improve the research environment in terms of resource sharing, data sharing, and novel methods of analysis. Such sentiment analysis and stock market prediction is promoted through regional research networks, which invokes the reaction of adjoining nations or countries with a rich history of association. The rising contribution of the developing countries like China and India is a sign of their rising research capacity and global contribution to the research agenda. Thought diversity is very essential when it comes to innovation and therefore research is more stable and profound. The collaborative character of e-sentiments and stock market prediction can be confirmed by co-authorship network that demonstrates the efforts of the global community to apply sentiment analysis in financial predictions.
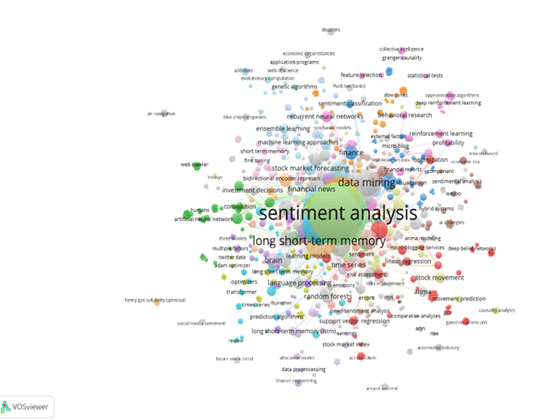
Cluster III: Co-Word Analysis
The keyword co-occurrence networks of Figure 9 give a clear wholesome visualization of commonly used terms in the e-sentiments and stock market forecasting domain. Sentiment analysis is the central term, and it means that it has a basic role. The recent research has shown sentiment analysis to be important in making inferences about the market sentiments over social media, news and financial reports. The network indicates many connections with the sentiment analysis, which indicates the multidisciplinary area of the financial prediction. Short short term memory (LSTM) is another term that stands out; it refers to the application of advanced machine learning techniques in its quest to increase the level of accuracy associated with the prediction. LSTM is a variant of a recurrent neural network (RNN) originally devised to address some of the shortcomings of the traditional RNNs in modeling long-term dependencies. They fare well in manipulating sequence data, and are thus applicable in tasks such as time series prediction, natural language processing and speech recognition. Among the criteria to choose a recurrent neural network, LSTM is favoured for performance in time series forecasting, as well as identifying long-term relationships in temporal data. There is an accentuation of such terms as data mining and financial news, in order to explain that any large amount of data must be analyzed according to tendencies contributing to predictability in the stock market. Data mining is necessary to find parallels and latent patterns that influence how markets respond. Data mining and financial news connection reveals the predictive capability of capturing forces of market sentiments based on real time information flows. The terms to distinguish the technological advances include deep learning, machine learning, and artificial intelligence. All these are making sentiment analysis models more predictable. In particular, deep learning finds useful applications in textual modeling of non-linear and often complex relations.
Figure 11
|
Figure 11 Co-Occurrence Network of Keywords |
Sentiment
analysis used with AI produces a better result in terms of processing of large
data to make better market projections. The wide-range applicability of
sentiment analysis in the financial domain is indicated by such keywords as
stock market forecasting, financial forecasting, and volatility in the market.
Sentiment analysis can be used in determining market dynamics, stock price
prediction, and investor behavior. One of the topical
areas that are being researched is how the textual data sentiments may offer
leading indicators on market trends and investor sentiment changes.
The
co-word analysis shows emerging patterns and future trends also. Market
sentiment is also of growing interest through real-time, unstructured,
digital-source data. Such terminologies as social media analysis, big data
analytics, real-time data processing signify movement towards more responsive
predictive models. In the evolvement of new data science and technology,
sentiment analysis is still rising in significance in the
area of stock market prediction.
5. Conclusion and Future Directions
The application of e-sentiment analysis in improving the stock market prediction models by relying on the massive volumes of unstructured data on digital platforms and social media, financial news, and online forums has increased. Incorporating the emotional tone and the underlying psychological determinants of how investors act, e-sentiments offer a more refined interpretation of movements of the market that many financial models do not take into account. The machine learning algorithms and natural language processing (NLP) keep on developing and thus with their assistance, more comprehensive and valid predictions can be made because of real-time sentiment data analysis. This research paper has presented the escalating significance of sentiment analysis for forecasting stock markets giving out details of the growth and the perspectives in the area. The analysis of the literature provided by the bibliometric study showed that the number of research works has increased considerably since 2010 and especially within the last five years, which indicates that the sentiment analysis coupled with financial forecasting is an important topic to follow. The input of the most prominent authors, organizations, and nations sheds light on the interdisciplinary and international nature of the discipline and finds China, India, the United States among the players performing a major role in research production. Nevertheless, although the e-sentiments hold a high growth potential in terms of stock market forecasting, the same is still faced with a number of challenges. It is not easy to come up with impeccable predictions because of the volatility and unpredictability in the financial markets, and the strength of sentiment data may be variable. Uncertainty, false information and variable nature of the affect generated in the social media and news articles add important barriers to precise study. Thus, the existing models should be improved to address the issues even more carefully.
6. Research Implications
The research on e-sentiments and stock market prediction holds several significant implications, spanning theoretical, methodological, and practical dimensions.
6.1. Theoretical Implications
The inclusion of sentiment analysis in the prediction of the stock market conflicts with the conventional financial theories and models. The use of the e-sentiments will provide additional means to learn more about the influence of psychological and emotional factors on the behavior of investors yet to be sufficiently studied by existing economic theories. The observation gives the research a new dimension through which the emotional and psychic roots of market trends can be examined. This work is a contribution in the related domain of behavioral finance since it shows the impact of emotions, irrationality, and group psychology on the functioning of financial markets.
6.2. Methodological Implications
Methodology-wise, the study also highlights the need to work out more robust machine learning models that will allow incorporating sentiment findings in the model along with other predictive variables. Machine learning approaches, including Long Short-Term Memory (LSTM) networks, deep learning, and other newer advanced machine learning strategies have proven to be quite successful in their ability to deal with the dynamics of sentence data. Nevertheless, since sentiment analysis remains in its early days, better methods of dealing with unstructured data, noise avoidance, and sentiment classification will improve the accuracy of such models as predictive models. Moreover, interdisciplinary methods or techniques may hold a lot of promise in the future since new horizons in methods development can be opened through a combination of NLP, economics, psychology and computer science.
6.3. Practical Implications for Investors and Analysts
E-sentiment analysis provides the prospect of competitive advantage to investors and financial analysts by enabling predictions of market trends and good decisions. Incorporating sentiment intelligence provided by social media, news, and financial reports on trading decisions allows investors to discern the upcoming market behavior at an earlier stage so that they can respond faster to the rising tendencies. It could be particularly useful in enabling public and market mood to be measured during the uncertain periods in the market which could include the financial crises or even political events where the mood in the market can cause the stocks prices to swing in a short period of time.
6.4. Practical Implications for Policymakers
As a policymaker, the knowledge of how the e-sentiments influence the market conduct may also be useful in providing insights on the impact of the public opinion and social interaction in the market to the stability of markets and investor trust. It is expected that the sentiment data can be used by the policymakers to observe possible market fluctuations or bubbles, as an early warning to make necessary regulatory impacts. Also, creating transparency in social media and news reporting, policymakers ensure that the level of the community sentiment is grounded based on the true information which decreases the risk of manipulating markets and spreading misinformation.
7. Limitations
This study is an eye opener in understanding the relevance of e-sentiments in the concept of stock market forecasting, but yet there are a couple of limitations in the study that ought to have been mentioned. First, there is always the question of the quality and accuracy of sentiment analysis tools, which tend to error particularly when handling informal or ambiguous language as seen within the social media and news outlets. Second, the absence of consistent measures to gauge the sentiment may bring discrepancies in the outcomes making them difficult to compare across the studies. Also, such study is limited in examining other financial forecasting methods beyond sentiment-based predictions to understand how they could be further used to complement sentiment based forecasts; i.e., using technical analysis or macroeconomic-based stock market prediction models.
Lastly, the research is based on bibliometric analysis, thus the research only captures published research and may not provide the scope of the available research. The other sources of data (industry reports, white papers, and exclusive datasets) should be included in future studies to present a more accurate picture of the situation in the field.
CONFLICT OF INTERESTS
None.
ACKNOWLEDGMENTS
None.
REFERENCES
Anggraeni, W., Yuniarno, E. M., Rachmadi, R. F., Sumpeno, S., Pujiadi, P., Sugiyanto, S., et al. (2024). A Hybrid EMD-GRNN-PSO in Intermittent Time-Series Data for Dengue Fever Forecasting. Expert Systems with Applications, 237, 110565. https://doi.org/10.1016/j.compeleceng.2025.110565
Azadmanesh, M., Ghahfarokhi, B. S., & Talouki, M. A. (2025). On the Local Convergence of ADAM-DPGAN with Simultaneous and Alternating Gradient Descent Training Methods. Expert Systems with Applications, 262, 110545. https://doi.org/10.1016/j.exsys.2025.110565
Bentaleb, D., & Khatar, Z. (2025). Multi-Criteria Bayesian Optimization of Empirical Mode Decomposition and Hybrid Filters Fusion for Enhanced ECG Signal Denoising and Classification. Computational Biology and Medicine, 184, 110265. https://doi.org/10.1016/j.cbmd.2025.110370
Brini, A., & Toscano, G. (2024). SpotV2Net: Multivariate Intraday Spot Volatility Forecasting Via Vol-of-Vol-Informed Graph Attention Networks. Journal of Financial Markets, 97, 15421. https://doi.org/10.1016/j.jfin.2024.110130
Campbell-Lendrum, D., Neville, T., & Schweizer, C. (2023). Climate Change and Health: Three Grand Challenges. Nature Medicine, 29(12), 1631–1638. https://doi.org/10.1038/s41591-023-02438-w
Cao, Y., Choo, W. C., & Matemilola, B. T. (2025). Value-At-Risk Forecasting Based on Textual Information and a Hybrid Deep Learning-Based Approach. International Review of Economics and Finance, 103, 104403. https://doi.org/10.1016/j.iref.2025.104403
Cao, Y., Liu, G., Luo, D., Bavirisetti, D. P., & Xiao, G. (2023). Multi-Timescale Photovoltaic Power Forecasting Using an Improved Stacking Ensemble Algorithm Based LSTM-Informer Model. Energy, 283, 110420. https://doi.org/10.1016/j.energy.2023.110535
Chen, Y., Ba, S., Yang, Q., Yuan, T., Zhao, H., & Zhou, M. (2021). Efficiency of China's Carbon Market: A Case Study of Hubei Pilot Market. Energy, 222, 11234. https://doi.org/10.1016/j.energy.2022.114534
Chen, Y., Liu, X., Rao, M., Qin, Y., Wang, Z., Ji, Y., et al. (2025). Explicit Speed-Integrated LSTM Network for Non-Stationary Gearbox Vibration Representation and Fault Detection Under Varying Speed Conditions. Reliability Engineering and System Safety, 254, 120305. https://doi.org/10.1016/j.ress.2025.110765
Cui, X., & Niu, D. (2024). Carbon Price Point-Interval Forecasting Based on Two-Layer Decomposition and Deep Learning Combined Model Using Weight Assignment. Journal of Cleaner Production, 483, 230245. https://doi.org/10.1016/j.jclepro.2024.110267
Dong, F., & Li, Z. (2024). Analysis of Market Risk Volatility and Warning in the Carbon Trading Market. Journal of Cleaner Production, 452, 220289. https://doi.org/10.1016/j.jclepro.2024.110420
Dong, X., & Zhang, J. F. (2024). Heterogeneity of Regional Carbon Emission Markets in China: Evidence from Multidimensional Determinants. Energy Economics, 138, 115784. https://doi.org/10.1016/j.eneco.2024.110160
Gao, R., Cui, S., Wang, Y., & Xu, W. (2025). Predicting Financial Distress in High-Dimensional Imbalanced Datasets: A Multi-Heterogeneous Self-Paced Ensemble Learning Framework. Financial Innovation, 11(1), 50. https://doi.org/10.1186/s40854-024-00745-w
Huang, N. E., Shen, Z., Long, S. R., Wu, M. L. C., Shih, H. H., Zheng, Q. N., et al. (1998). The Empirical Mode Decomposition and The Hilbert Spectrum for Nonlinear and Non-Stationary Time Series Analysis. Proceedings of the Royal Society A: Mathematical, Physical and Engineering Sciences, 454, 903–995. https://doi.org/10.1098/rspa.1998.0193
Huang, Z.-C., & Sangiorgi, I. (2024). Forecasting Bitcoin Volatility Using Machine Learning Techniques. Journal of International Financial Markets, Institutions & Money, 97, 110543. https://doi.org/10.1016/j.intfin.2024.102064
Jianwei, E., Ye, J., & He, L. (2021). A Denoising Carbon Price Forecasting Method Based on the Integration of Kernel Independent Component Analysis and Least Squares Support Vector Regression. Neurocomputing, 434, 67–79. https://doi.org/10.1016/j.neucom.2020.12.086
Kim, H. Y., & Won, C. H. (2018). Forecasting the Volatility of Stock Price Index: A Hybrid Model Integrating LSTM with Multiple GARCH-Type Models. Expert Systems with Applications, 103, 25–37. https://doi.org/10.1016/j.eswa.2018.03.002
Kingma, D. P., & Ba, J. (2014). Adam: A Method for Stochastic Optimization. Computer Science, 1–15.
Kristjanpoller, W., Fadic, A., & Minutolo, M. C. (2014). Volatility Forecast Using Hybrid Neural Network Models. Expert Systems with Applications, 41, 2437–2442. https://doi.org/10.1016/j.eswa.2013.09.043
Leitao, J., Ferreira, J., & Santibanez-Gonzalez, E. (2022). New Insights into Decoupling Economic Growth, Technological Progress and Carbon Dioxide Emissions: Evidence from 40 Countries. Technological Forecasting and Social Change, 174, 110566. https://doi.org/10.1016/j.techfore.2021.121250
Li, J., & Hu, Y. (2024). Analysis on the Synergy Between Markets of Electricity, Carbon, and Tradable Green Certificates in China. Energy, 302, 115301. https://doi.org/10.1016/j.energy.2024.131808
Li, T., Yue, X., & Qin, M. (2024). Towards Paris Climate Agreement Goals: The Essential Role of Green Finance and Green Technology. Energy Economics, 129, 110431. https://doi.org/10.1016/j.eneco.2023.107273
Liu, J., & Zhang, Z. (2021). Forecasting the Volatility of EUA Futures with Economic Policy Uncertainty using the GARCH-MIDAS Model. Financial Innovation, 7, 1–19. https://doi.org/10.1186/s40854-021-00292-8
Liu, T., & Ma, X. (2022). A Stock Price Prediction Method Based on Meta-Learning and Variational Mode Decomposition. Knowledge-Based Systems, 252, 110876. https://doi.org/10.1016/j.knosys.2022.109324
Liu, Y. (2019). Novel Volatility Forecasting using Deep Learning – Long Short Term Memory Recurrent Neural Networks. Expert Systems with Applications, 132, 99–109. https://doi.org/10.1016/j.eswa.2019.04.038
Lv, T., & Tao, A. (2023). Significant Wave Height Prediction Based on the Local-EMD-WaveNet Model. Ocean Engineering, 287, 110934. https://doi.org/10.1016/j.oceaneng.2023.115900
Man, Y., & Zhang, S. (2024). Dynamic Risk Spillover and Hedging Efficacy of China's Carbon-Energy-Finance Markets: Economic Policy Uncertainty and Investor Sentiment Non-Linear Causal Effects. International Review of Economics & Finance, 93, 1397–1416. https://doi.org/10.1016/j.iref.2024.03.066
Massar, H., & Stergiadis, C. (2024). EMD-BSS: A Hybrid Methodology Combining Empirical Mode Decomposition and Blind Source Separation to Eliminate Ocular Artifacts from EEG Recordings. Biomedical Signal Processing and Control, 95, 110287. https://doi.org/10.1016/j.bspc.2024.106475
Nair, V., & Hinton, G. E. (2010). Rectified Linear Units Improve Restricted Boltzmann Machines. Neural Computation, 23(2), 607–611.
Ng, W. W. Y., & Zhang, Q. (2024). Improving Domain Generalization by Hybrid Domain Attention and Localized Maximum Sensitivity. Neural Networks, 171, 320–331. https://doi.org/10.1016/j.neunet.2023.12.014
Ouyang, Z., & Lu, M. (2023). Forecasting Stock Index Return and Volatility Based on GAVMD-Carbon-BiLSTM: How Important is Carbon Emission Trading? Energy Economics, 128, 120257. https://doi.org/10.1016/j.eneco.2023.107134
Trivedi, A., & Sivanesan, S. (2025). Leveraging Cosine Similarity For Stock Trend Prediction with Options Chain Data and Piecewise Linear Encoding. Computers and Electrical Engineering, 127, 110565. https://doi.org/10.1016/j.compeleceng.2025.110565
Yao, J., Wang, H., & Mao, S. (2025). Carbon Price Volatility Prediction Using a Hybrid CEEMDAN-Attention-LSTM Approach. Evolving Systems, 16(3), 79–92. https://doi.org/10.1007/s12530-025-09704-x
Zheng, Q., Wu, J., & Lin, B. (2025). Performance of Systemic Stress in Agricultural Commodities and Its Implication for Volatility Prediction in SSA Equities. Journal of Commodity Markets, 39, 100480. https://doi.org/10.1016/j.jcomm.2025.100480
|
|
 This work is licensed under a: Creative Commons Attribution 4.0 International License
© IJETMR 2014-2025. All Rights Reserved.