
|
|
|
|
BRANDING CINEMAS THROUGH UNDERSTANDING THE EFFECTS OF IMMERSIVE TECHNOLOGY AND SERVICESCAPE ON CUSTOMER CINEMATIC EXPERIENCE (CX)
Dr. Joseph Mary Rahila 1![]() , Arul Lizzy 2
, Arul Lizzy 2![]() , Dr. Prasanna 1
, Dr. Prasanna 1![]()
1 Assistant
Professor, Crescent School of Business, BS Abdur Rahman Crescent
Institute of Science and Technology, Tamil Nadu, India
2 Associate
Professor, BBA Department, Loyola College, Chennai, Tamil Nadu, India
|
|
|
ABSTRACT |
|
|
The rapid advancements in immersive technologies, such as virtual reality (VR) and augmented reality (AR), are transforming consumer experiences across various industries, including cinema. Simultaneously, the servicescape, encompassing physical surroundings and ambient elements, plays a critical role in shaping consumer perceptions and satisfaction. This study investigates the interplay between immersive technology and servicescape in branded cinemas, exploring how these factors influence consumer emotions, behaviors, and engagement. Using a mixed-methods approach—including qualitative interviews, observational studies, and quantitative surveys—this research examines the impact of sensory stimulation, environmental cues, and technological interfaces on audience experiences. By analyzing leading cinema chains, the study aims to uncover the extent to which immersive elements enhance consumer satisfaction and brand attachment. The findings
contribute to both theoretical and practical insights, offering valuable
strategies for cinema operators and entertainment venues seeking to elevate
customer engagement and loyalty in an increasingly immersive and digitally
driven landscape. |
|||
|
Received 05 February 2025 Accepted 02 March 2025 Published 30 April 2025 Corresponding Author Dr.
Joseph Mary Rahila, rahila@crescent.education DOI 10.29121/ijetmr.v12.i4SE.2025.1588 Funding: This research
received no specific grant from any funding agency in the public, commercial,
or not-for-profit sectors. Copyright: © 2025 The
Author(s). This work is licensed under a Creative Commons
Attribution 4.0 International License. With the
license CC-BY, authors retain the copyright, allowing anyone to download,
reuse, re-print, modify, distribute, and/or copy their contribution. The work
must be properly attributed to its author.
|
|||
|
Keywords: Customer
Experience, Branding Cinemas, Servicescape, Virtual Reality, Augmented
Reality, Immersive Technologies |
|||


1. INTRODUCTION
The multiplex and cinema sector is at the confluence of entertainment, culture, and commerce, influencing the leisure activities of millions of people worldwide. With roots dating back to the late nineteenth century, when the Lumière brothers first showed moving pictures, the industry has evolved dramatically, fueled by technology developments, shifting consumer preferences, and worldwide socioeconomic changes.
Multiplexes have transformed the movie experience in recent decades, providing spectators with a broad selection of films under one roof, as well as cutting-edge amenities ranging from comfortable seats to advanced sound systems. The transition from single-screen theaters to multiplexes illustrates not only a change in exhibition styles, but also a response to modern consumers' aspirations for convenience, variety, and immersive viewing experiences.
The industry's landscape is defined by a careful mix of blockbuster productions from large studios and independent films, each catering to different audience demographics and tastes. Furthermore, the rise of streaming platforms has created new difficulties and opportunities for cinemas in terms of viewership and revenue.Major theatre chains, independent exhibitors, film distributors, production studios, and technology companies are among the industry's key players. Their tactics combine content acquisition, marketing campaigns, strategic alliances, and technology innovation to attract and maintain consumers in an increasingly competitive industry.
However, the industry confronts a number of obstacles, including changing box office performance, piracy concerns, regulatory constraints, and the long-term impact of the COVID-19 epidemic, which delayed cinema release schedules and drove an increase in streaming consumption. Nonetheless, the industry has demonstrated resilience and adaptation through innovative solutions such as hybrid release models and improved cleaning methods to reassure viewers. Looking ahead, the multiplex and cinema industry is primed for additional transition, fueled by changing consumer behaviors, technology advances such as virtual and augmented reality integration, and a renewed emphasis on inclusivity and diversity in storytelling. Cinema continues to fascinate audiences and inspire collective experiences, demonstrating its enduring significance in an ever-changing entertainment landscape
1.2. LITERATURE SURVEY
1.2.1. Servicescape
The concept of servicescape plays a crucial role in shaping consumer perceptions, emotions, and behaviors. Giahchin and Ekhlassi (2013) assert that servicescape, which includes both visual and non-visual features, significantly influences customer experiences. Lin (2016) further supports this by emphasizing that the elements of servicescape create strong first impressions that shape consumer behavior. The stimulus-organism-response (S-O-R) model provides a theoretical foundation for understanding the impact of servicescape, as suggested by Dedeoglu et al. (2018). Bitner (1992) defines servicescape as the physical environment in which customer experiences are formed.
In the hospitality sector, studies by Pijls et al. (2017) and Dedeoglu (2018) reveal that the physical and social environments contribute to service delivery. Dedeoglu et al. (2018) also found that various factors influence consumers' cognitive, emotional, and psychological states. Servicescape components are typically categorized into three dimensions: ambient conditions, space/function, and signs, symbols, and artifacts. Lucas (2003) further classifies servicescape into five categories, including environment, casino design, and cleanliness. Room decoration and comfort have also been identified as essential elements in shaping consumer experience (Durna et al., 2015). Furthermore, Dong and Siu (2013) highlight the importance of servicescape in creating a positive service experience by incorporating both substance and communicative staging.
1.2.2. Substance Staging
Substance staging includes all physical facilities, customer communication, and tangible elements within a service environment. Holder and Berndt (2011) emphasize that both internal and external elements—such as building facades, parking, waiting areas, and interior design—play a role in shaping customer perceptions. Mousavi et al. (2015) categorize substance staging into four subsets: organizational design, organizational space, customer behavior, and external organizational aspects. Baker (1987) further classifies physical environment elements into ambient factors (e.g., music, sound), design considerations, and social factors (e.g., employee relationships). These classifications provide a structured understanding of how tangible and intangible aspects contribute to the overall customer service experience.
1.2.3. Communicative Staging
Communicative staging refers to the interaction between service providers and consumers. Feiz et al. (2011) argue that effective communication between employees and customers is essential for balancing efficiency with customer satisfaction. Durna et al. (2015) highlight that communicative staging includes both humanistic and cultural characteristics that define service interactions. Cultural components in communicative staging are shaped by business services and cultural characteristics, while human factors such as politeness and willingness to assist contribute to a positive service experience.
1.2.4. Immersive Technology
The role of immersive technology, including virtual reality (VR) and augmented reality (AR), has been extensively studied in the context of consumer behavior. Anupama Ambika, Hyunju Shin, and Varsha Jain highlight the growing impact of immersive technologies on consumer behavior research. VR and AR have been explored in various settings, including virtual commerce, where they influence purchasing decisions. Recent studies have also examined AI-driven social applications, revealing their impact on human-AI interactions and consumer decision-making. VR, in particular, has proven effective in behavior change research, demonstrating its potential to shape consumer attitudes and actions. These findings underscore the increasing significance of immersive technology in influencing consumer behavior across industries.
1.2.5. Customer Experience
The customer experience concept in marketing was first introduced by Holbrook and Hirschman (1982) to gain deeper insights into consumer behavior. Verhoef et al. (2009) suggest that consumer experience involves cognitive, emotional, social, and physical responses to a service provider. Experiential marketing leverages these responses to create sensory, emotional, and social experiences tailored to specific audiences. Schmitt (1999) argues that traditional marketing approaches are becoming obsolete, advocating for experiential marketing as a more effective alternative. Rather (2020) and Tsaur et al. (2007) emphasize the growing importance of experience marketing, particularly in tourism and hospitality. Pijls et al. (2017) propose a three-factor scale for measuring customer experience, which includes invitation, care, and comfort. Their research highlights the role of sensory, cognitive, and behavioral factors in shaping customer experiences. Experiential marketing, as outlined by Rather (2020), aims to establish deeper emotional connections with consumers, making it a vital strategy in modern consumer engagement.
1.3. IDENTIFIED RESEARCH PROBLEM
The transition of parachuting from a theater experience to a cinema experience presents an intriguing avenue for research problem identification. Historically rooted in live performances within theaters, parachuting has undergone a notable shift towards cinematic depictions, facilitated by advancements in technology and storytelling techniques.
This evolution raises questions about the impact on audience engagement, narrative immersion, and the preservation of the art form's authenticity Exploring this shift could involve investigating audience preferences, analyzing the effectiveness of cinematic adaptations in capturing the essence of live performances, and examining the influence of visual effects on the perception of parachuting.
Additionally, understanding the cultural, social, and economic factors driving this transition can provide valuable insights into the evolving dynamics of entertainment consumption and the intersection of traditional and modern forms of storytelling. Identifying the key research problems in this context requires a multidisciplinary approach encompassing aspects of theater studies, film studies, audience psychology, and cultural analysis
1.4. OBJECTIVES
1.4.1. Primary Objective
· To evaluate the impact of immersive technology (such as virtual reality, augmented reality, etc.) and service scape (physical environment and ambient factors) on the cinematic experience of customers.
1.4.2. Secondary Objectives
· To build customer profiling of cinema visitors.
· To assess the influence of immersive technology on the overall satisfaction and enjoyment of customers during cinematic experiences at various cinemas.
· To analyze the role of service scape elements, including seating arrangements, lighting, sound quality, cleanliness, and amenities, in enhancing or detracting from the cinematic experience.
· To explore the relationship of immersive technology and service scape on customer loyalty.
2. METHODOLOGY
2.1. RESEARCH DESIGN
A research design is a framework that addresses four main issues: what questions must be answered for the study, what information is pertinent, what data should be collected, and how to interpret the findings. The study issue and the investigator's orientation determine the most efficient design. Depending on the purpose of the study, there are several forms of research. When a researcher wants to go further into a subject and gather background knowledge on it so that more focused study may be conducted in the future, they employ exploratory research. The purpose of descriptive analysis design is to identify and elucidate the features of the variables of interest in a given scenario. The features of cluster are eloquently described by this study design.
The main objective of this study is to understand the customer purchase journey of health insurance. The present study relies on primary data where the data is collected using online questionnaire (google form). Then the questionnaire was sent to 136 respondents.
Out of total questionnaire sent to 165 people, 163 people had filled the questionnaire.
2.2. SAMPLING METHOD
2.2.1. Research Design
This study employs a qualitative research design to explore the experiences and perspectives of a specific group. Given the nature of the research objectives, a non-probability sampling technique is deemed appropriate, as it allows for an in-depth understanding of participants' viewpoints without the requirement of random selection.
2.2.2. Sampling Technique
A non-probability sampling approach was utilized in this study, specifically convenience sampling. This method was chosen due to its practicality and ease of access to participants. Convenience sampling allows for the selection of individuals who are readily available and willing to participate, making it suitable for exploratory research and pilot studies where generalizability is not the primary focus.
2.2.3. Convenience Sampling Method
The convenience sampling method was employed due to its efficiency in gathering data quickly and cost-effectively. Participants were selected based on their accessibility and willingness to engage in the study. This approach was particularly beneficial in cases where reaching a broader population was challenging due to time, financial, or logistical constraints.
While convenience sampling offers practical advantages, it is important to acknowledge its limitations. The non-random selection of participants introduces potential biases, including selection bias and limited diversity in the sample. As a result, findings from this study may not be generalizable to the entire population. However, the study aims to provide insights into the specific group being examined rather than drawing universal conclusions.
2.3. DATA COLLECTION
The present study is based on primary data collected with the help of a standardized questionnaire which were self-administered to the customers to fill at their convenience. The survey questionnaire was comprised of 30 questions in total, which are divided into six parts.
· The first part is dedicated to demographic information. In total six multiple choice questions were assigned: AGE, GENDER, OCCUPATION, ANNUAL HOUSEHOLD INCOME,
· The second part comprises of seven questions measuring the communicative staging.
· The third part comprises of eight questions measuring the substantive staging.
· The fourth part comprises of six questions measuring the immersive technology.
· The final part comprises of four questions measuring the customer cinematic experience.
· All the independent and dependent dimensions are measured through a five-point scale (ranging from 1-5) where 1= Strongly Agree, 2= Agree, 3= Neutral, 4= Disagree, 5= Strongly Disagree
2.4. DATA ANALYSIS
The data used in this study is primary data. The primary data has been collected through ‘Distribution of standardized questionnaire’. All responses were gathered from the respondents through questionnaire. The questionnaire was circulated among 165 customers, out of which 163 responses were received. The data collected through the questionnaire administration was uploaded into an excel sheet and was coded. Then by using Statistical Package for Social Science (SPSS) the data was processed to analyses the results.Different statistical tools like frequency analysis, correlation coefficient and regression analysis were used to determine the relationship between the variables.
2.5. TOOLS FOR ANALYSIS SPSS
SPSS (Statistical Package for the Social Sciences) is a software package used for statistical analysis in social science. It provides tools for data analysis, data management, and data documentation SPSS can be used for a wide range of statistical analysis, including descriptive statistics. SPSS has a user-friendly interface that allows users to easily perform statistical analysis without requiring advanced knowledge of statistical methods. SPSS statistical tools are used for data analysis purpose. Frequency analysis, Regression analysis, and Correlation coefficient are used in this study.
3. DATA ANALYSIS AND INTERPRETATION
3.1. Demographic Details
Table 1
|
Table 1 Age |
|||||
|
|
|
Frequency |
Percent |
Valid
Percent |
Cumulative
Percent |
|
Valid |
Under
18 |
10 |
6.1 |
6.1 |
6.1 |
|
18-25 |
89 |
54.6 |
54.6 |
60.7 |
|
|
26-40 |
43 |
26.4 |
26.4 |
87.1 |
|
|
40-60 |
19 |
11.7 |
11.7 |
98.8 |
|
|
60+ |
2 |
1.2 |
1.2 |
100.0 |
|
|
|
Total |
163 |
100.0 |
100.0 |
|
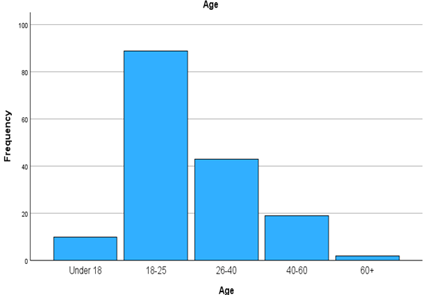
Interpretation
From the frequency analysis it is found that out of 163respondents, 10 respondents were of age Under 18, 89 respondents were of age18-25, 43 respondents were of age 26-40. 19 respondents were of age 40-60 and 2 respondents were of age 60 above. Hence this study constitutes 6.1 % of responses from age under 18, 54.6% of responses from age 26-40, 26.4% of respondents from age 26-40,11.7% respondents from age 40-60,1.2% of respondents from age 60+.
Table 2
|
Table 2
Gender |
|||||
|
|
|
Frequency |
Percent |
Valid
Percent |
Cumulative
Percent |
|
Valid |
Male |
92 |
56.4 |
56.4 |
56.4 |
|
Female |
71 |
43.6 |
43.6 |
100.0 |
|
|
Total |
163 |
100.0 |
100.0 |
||
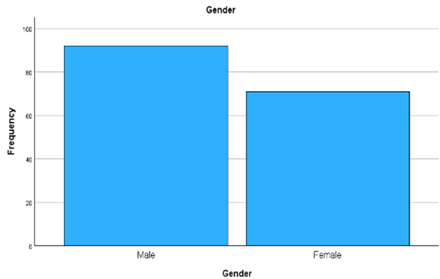
Interpretation
From the frequency analysis it is found that out of 163respondents, 92 respondents were male and 71 respondents were female. Hence this study constitutes 56.4% of responses from the male and 43.6% of responses from Female
Table 3
|
Table 3
Occupation |
|||||
|
|
|
Frequency |
Percent |
Valid
Percent |
Cumulative Percent |
|
Valid |
Student |
74 |
45.4 |
45.4 |
45.4 |
|
|
Professional |
22 |
13.5 |
13.5 |
58.9 |
|
|
Entrepreneur/Business
Owner |
16 |
9.8 |
9.8 |
68.7 |
|
|
Goverment Employee |
7 |
4.3 |
4.3 |
73.0 |
|
|
Employee |
36 |
22.1 |
22.1 |
95.1 |
|
|
Freelancer/Contractor |
8 |
4.9 |
4.9 |
100.0 |
|
|
Total |
163 |
100.0 |
100.0 |
|
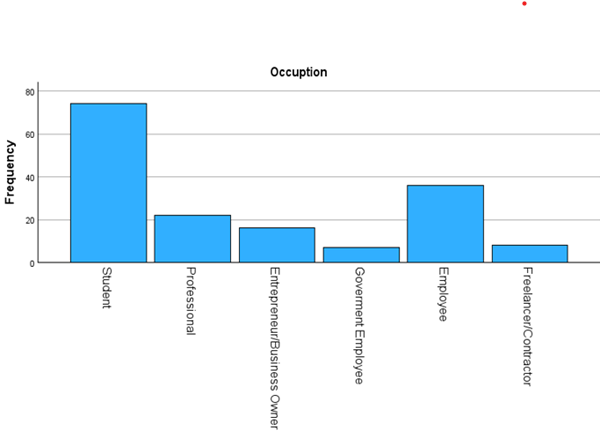
Interpretation
From the frequency analysis it is found that out of 163respondents, 74 respondents are Students, 22 respondents are professionals, 16 respondents are Entrepreneur/Business Owner. 7 respondents are Government Employee and 36 respondents are Employees and 8 respondents are Freelancer/Contractor..Hence this study constitutes 45.4 % of responses are students, 13.5% of responses are Professionals, 9.8.% of respondents are Entrepreneur/Business Owner,4.3% respondents are Government Employee,22.1% of respondents are Employee and 4.9% respondents are Freelancer/Contractor.
Table 4
|
Table 4 Annual_Income |
|||||
|
Income |
Frequency |
Percent |
Valid
Percent |
Cumulative
Percent |
|
|
Valid |
<5,00,000 |
60 |
36.8 |
36.8 |
36.8 |
|
₹5,00,000-
₹10,00,000 |
24 |
14.7 |
14.7 |
51.5 |
|
|
₹10,00,000-₹15,00,000 |
28 |
17.2 |
17.2 |
68.7 |
|
|
₹15,00,000-₹20,00,000 |
29 |
17.8 |
17.8 |
86.5 |
|
|
>20,00,000 |
22 |
13.5 |
13.5 |
100.0 |
|
|
Total |
163 |
100.0 |
100.0 |
||
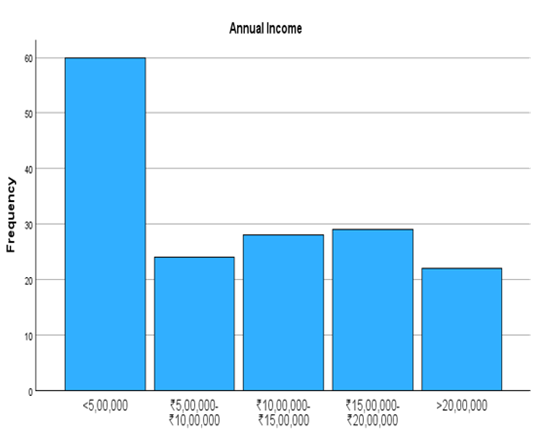
Interpretation
Based on the survey of 163 respondents for 60 respondents (36.8%) said their annual income is <5,00,000, 24 Respondents (14.7%) said their annual income is₹5,00,000- ₹10,00,000, 28 respondent (17.2%) said their annual income is₹10,00,000-₹15,00,000, 29 respondents (17.8%) said their annual income is ₹15,00,000-₹20,00,000 and 22 respondent (13.5%) said their annual income is >20,00,000.
Table 5
|
Table 5 How
often do you visit cinema |
|||||
|
|
|
Frequency |
Percent |
Valid
Percent |
Cumulative
Percent |
|
Valid |
Regularly
(more than once month) |
80 |
49.1 |
49.1 |
49.1 |
|
Occasionally
(once a month or less) |
47 |
28.8 |
28.8 |
77.9 |
|
|
Rarely
(a few times a year) |
31 |
19.0 |
19.0 |
96.9 |
|
|
Never |
5 |
3.1 |
3.1 |
100.0 |
|
|
Total |
163 |
100.0 |
100.0 |
||
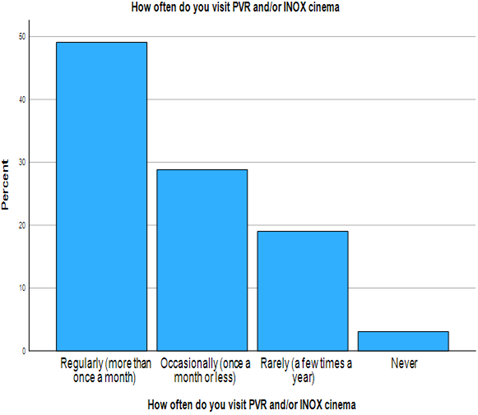
Interpretation
Based on the survey taken 163 respondents for how they visit PVR INOX Cinema. 49.1% of respondents have visited regularly,28.8% respondents have visited occasionally, 19.0% respondents have visited rarely, and 3.1 % respondents have never visited PVR INOX Cinema.
3.2. REGRESSION ANALYSIS
Table 6
|
Table 6 Variables Entered/Removeda |
|||
|
Model |
Variables Entered |
Variables Removed |
Method |
|
1 |
ImT, SsCS, SsSSb |
. |
Enter |
|
a. Dependent Variable: CX |
|||
|
b. All requested variables entered. |
|||
|
Model Summary |
||||
|
Model |
R |
R Square |
Adjusted R Square |
Std. Error of the Estimate |
|
1 |
.603a |
.364 |
.352 |
.668 |
|
a. Predictors: (Constant), ImT,
SsCS, SsSS |
||||
The model demonstrates a moderately strong relationship between the predictor variables(ImT, SsCS, SsSS) and the dependent variable (CX).The multiple correlation coefficient (R) of 0.603 indicates that there is a substantial association between the predictor variables and the purchase behaviour of individuals.The adjusted R Square of 0.364 reflects the proportion of variance in the dependent variable that is accounted for by the independent variables after adjusting for the number of predictors in the model.
3.3. ANOVA
Table 7
|
Table 7 ANOVAa |
||||||
|
Model |
Sum of Squares |
df |
Mean Square |
F |
Sig. |
|
|
1 |
Regression |
40.586 |
3 |
13.529 |
30.331 |
<.001b |
|
Residual |
70.921 |
159 |
.446 |
|||
|
Total |
111.507 |
162 |
||||
|
a. Dependent Variable: CX |
||||||
|
b Predictors: (Constant), ImT,
SsCS, SsSS |
||||||
Interpretation
The ANOVA results indicate a significant overall effect of the predictors (), ImT, SsCS, SsSS) on the dependent variable (CX) with a highly significant F-value of 10.406(p < .001). This suggests that the combined influence of these factors significantly contributes to explaining the CX Value, it emphasizes the importance of considering, ImT, SsCS, SsSS in understanding and predicting individuals' decisions regarding CX
|
Model |
Unstandardized Coefficients |
Standardized Coefficients |
t |
Sig. |
||
|
|
|
B |
Std.
Error |
Beta |
|
|
|
1 |
(Constant) |
1.253 |
.701 |
|
1.787 |
.076 |
|
|
SsCS |
-.516 |
.312 |
-.139 |
-1.657 |
.100 |
|
|
SsSS |
.445 |
.177 |
.375 |
2.51 |
.013 |
|
|
ImT |
.417 |
.171 |
.324 |
2.435 |
.016 |
|
a.
Dependent Variable: CX |
||||||
Interpretation
The coefficients provide insights into the strength and direction of the relationships between the predictor variables (ImT, SsCS, SsSS) and the dependant variable (CX)in the regression model:From the above table we infer r^2 value .364 that is 36.4% of the variability observed in the target variable is explained by the regression model. The CX for multiple regression analysis and the result of the linear regression analysis reveals that model is suitable for linear combination of the variance of cocreation relating to determinants comprising of ImT, SsCS, SsSS to ensure the value CX of the new product design with 10.406, p-value <0.01. Therefore, it is inferred that these are effective for CX.
3.4. T-TEST
HYPOTHESIS
· H0 (Null Hypothesis)
There is no significant difference between towards SsCS, SsSS, ImT, CX and gender of respondents.
· H1 (Alternate Hypothesis)
There is a significant difference between experience towards SsCS, and gender of respondents.
· H2 (Alternate Hypothesis)
There is a significant difference between experience towards SsSS and gender of respondents.
· H3 (Alternate Hypothesis)
There is a significant difference between experience towards ImT, and gender of respondents.
· H4 (Alternate Hypothesis)
There is a significant difference between experience towards CX and gender of respondents.
Table 8
|
Table 8 Showing
Group Statistics Towards SsCS, SsSS,
ImT, CX and Gender |
|||||
|
Group
Statistics |
|||||
|
Gender |
N |
Mean |
Std.
Deviation |
Std.
Error Mean |
|
|
SsCS |
Male |
92 |
2.74 |
.226 |
.024 |
|
Female |
71 |
2.76 |
.221 |
.026 |
|
|
SsSS |
Male |
92 |
4.35 |
.700 |
.073 |
|
Female |
71 |
4.27 |
.700 |
.083 |
|
|
ImT |
Male |
92 |
4.42 |
.680 |
.071 |
|
Female |
71 |
4.36 |
.600 |
.071 |
|
|
CX |
Male |
92 |
3.64 |
.822 |
.086 |
|
Female |
71 |
3.51 |
.840 |
.100 |
|
Table 9
|
Table 9 Showing
Independent Sample Test Towards SsSc, SsSS, ImT and Cx |
|||||||||||
|
Independent
Samples Test |
|||||||||||
|
Levene's
Test for Equality of Variances |
t-test
for Equality of Means |
||||||||||
|
F |
Sig. |
T |
df |
Two-Sided
p |
Mean
Difference |
Std. Error
Difference |
95%
Confidence Interval of the Difference |
||||
|
Lower |
Upper |
||||||||||
|
SsCS |
Equal
variances assumed |
.140 |
.709 |
-.394 |
161 |
.694 |
-.014 |
.035 |
-.084 |
.056 |
|
|
Equal
variances not assumed |
-.396 |
152.399 |
.693 |
-.014 |
.035 |
-.083 |
.056 |
||||
|
SsSS |
Equal
variances assumed |
.003 |
.954 |
.778 |
161 |
.437 |
.086 |
.111 |
-.132 |
.304 |
|
|
Equal
variances not assumed |
.778 |
150.693 |
.437 |
.086 |
.111 |
-.132 |
.304 |
||||
|
ImT |
Equal
variances assumed |
1.074 |
.302 |
.563 |
161 |
.574 |
.058 |
.102 |
-.144 |
.259 |
|
|
Equal
variances not assumed |
.572 |
158.077 |
.568 |
.058 |
.100 |
-.141 |
.256 |
||||
|
CX |
Equal
variances assumed |
.004 |
.949 |
.929 |
161 |
.354 |
.122 |
.131 |
-.137 |
.381 |
|
|
Equal
variances not assumed |
.926 |
149.132 |
.356 |
.122 |
.131 |
-.138 |
.382 |
||||
INTERPRETATION
From the result it is interpreted that significant
(2-tailed) value which is Greater than 0.05, so H0 is accepted there is
no significant difference between SsCS, SsSS, ImT, CX and gender
of respondents.
4. SUMMARY OF FINDINGS
· The Impact of Immersive Technology: The study would examine how immersive technologies like VR and AR are being integrated into the cinema experience at PVR Inox Ltd. This includes exploring how these technologies enhance storytelling, entertainment, and overall customer engagement.
· Influence of Servicescape: Researchers would investigate how the physical environment of PVR Inox cinemas affects the customer experience. This could involve analyzing factors such as theater design, seating arrangements, lighting, sound quality, cleanliness, and overall ambiance.
· Customer Cinematic Experience (CX): The research likely evaluates the overall CX at PVR Inox Ltd. This includes understanding customer perceptions, emotions, and satisfaction levels before, during, and after their cinematic journey. It may also explore elements such as ticketing processes, concessions, customer service, and post-viewing experiences.
· Interplay between Immersive Technology, Servicescape, and CX: One of the primary objectives would be to understand how immersive technology and servicescape elements intersect to shape the customer cinematic experience. For instance, how does the use of immersive technology influence perceptions of the servicescape, and vice versa? How do these factors collectively impact overall customer satisfaction and loyalty?
· Implications for PVR Inox Ltd: The findings would likely provide valuable insights for PVR Inox Ltd. on how to optimize their cinema offerings to enhance customer satisfaction, differentiate from competitors, and stay relevant in an increasingly digital and experience-driven market.
4.1. SUGGESTIONS/RECOMMENDATIONS
· Conduct a comprehensive literature review on immersive technology and its effects on customer experience, focusing on relevant theories and frameworks such as presence theory and the technology acceptance model.
· Explore the existing immersive technologies adopted by PVR and INOX Ltd, such as virtual reality (VR) headsets, augmented reality (AR) apps, and 4D cinema experiences, and analyze their impact on customer cinematic experience (CX).
· Investigate the influence of the servicescape (physical environment) of PVR and INOX cinemas on customer perceptions and emotions, utilizing concepts from environmental psychology and retail atmospherics.
· Utilize qualitative methods like in-depth interviews or focus groups to understand customers' perceptions and experiences of immersive technology and the servicescape at PVR and INOX cinemas.
· Employ quantitative surveys to measure the relationship between immersive technology adoption, servicescape elements, and customer satisfaction, loyalty, and behavioral intentions.
· Compare the CX provided by PVR and INOX cinemas with competitors who have different immersive technology offerings and servicescape designs to identify unique selling points and areas for improvement.
· Investigate the role of demographic factors such as age, gender, and income in shaping customer preferences and behaviors towards immersive technology and the servicescape in cinema environments.
· Analyze the financial implications of investing in immersive technology and servicescape enhancements for PVR and INOX, considering factors such as return on investment (ROI) and competitive positioning.
· Explore the potential of personalized immersive experiences through data-driven approaches like predictive analytics and machine learning, examining how tailored content and servicescape elements can enhance CX and drive customer engagement.
· Propose practical recommendations for PVR and INOX Ltd to optimize their use of immersive technology and servicescape design to enhance customer cinematic experiences, including strategies for marketing, operations, and technology integration.
4.2. LIMITATIONS
· The Limited Generalizability: Findings may not be applicable to other cinema chains or industries due to the specific context of PVR INOX Ltd.
· Time Constraints: The study may have a limited timeframe for data collection and analysis, potentially impacting the depth and breadth of the research.
· Access to Data: Access to proprietary data or sensitive information from PVR INOX Ltd may be restricted, limiting the comprehensiveness of the analysis.
· External Factors: External factors such as economic conditions, competition, or industry trends could influence customer experiences, but may not be fully accounted for in the study.
· Subjective Nature of CX: Customer cinematic experience (CX) is subjective and influenced by individual preferences and perceptions, making it challenging to quantify and measure objectively.
· Technology Adoption: The level of technology adoption among customers may vary, affecting their experiences differently and complicating the analysis of immersive technology effects.
· Sampling Bias: There may be a sampling bias if the study primarily focuses on customers who are frequent visitors or loyal patrons of PVR INOX Ltd, potentially overlooking perspectives of occasional or first-time visitors.
· Limited Control over Servicescape: While servicescape elements can influence customer experience, researchers may have limited control over factors such as lighting, layout, or ambiance in the cinema environment.
· Ethical Considerations: Ethical considerations related to privacy, consent, and data usage must be addressed, especially if the study involves collecting personal information or observing customer behavior without their explicit consent.
· Long-term Effects: The study may not capture the long-term effects of immersive technology and servicescape on customer cinematic experience, as preferences and behaviors may evolve over time.
4.3. DIRECTIONS FOR FUTURE RESEARCH
This study highlights the significant role of immersive technologies and servicescape in shaping customer cinematic experiences (CX). However, several key areas warrant further exploration to deepen our understanding and optimize the application of these elements within the cinema industry.
1) Impact
of Immersive Technologies on CX
Future research can investigate how various immersive technologies—such as virtual reality (VR), augmented reality (AR), and mixed reality (MR)—uniquely shape customer perceptions, emotional engagement, and overall satisfaction in cinematic settings.
2) Role
of Servicescape in CX
The physical environment of cinema halls plays a crucial role in enhancing or detracting from the audience experience. Studies can focus on the interplay between servicescape elements (e.g., ambiance, seating, lighting, and sound) and immersive technologies in influencing customer engagement.
3) Comparative
Analysis Across Cinemas
A comparative analysis of different cinemas, varying in their level of immersive technology adoption and servicescape design, can provide insights into customer preferences and competitive advantages within the industry.
4) Customer
Engagement and Interaction
Further research can explore how immersive technology and servicescape design facilitate customer interaction before, during, and after the cinematic experience, potentially enhancing audience participation and brand loyalty.
5) Emotional
Response and Memory Formation
Investigating the emotional and psychological responses triggered by immersive experiences and physical environments can help understand how these factors shape memory retention, influencing repeat visits and long-term consumer behavior.
6) Cross-Cultural
Perspectives
Cultural differences may play a significant role in shaping the effectiveness of immersive technologies and servicescape elements. Cross-cultural studies can compare cinemas across different regions to assess varying audience responses and preferences.
7) Sustainability
and Eco-Friendly Design
With growing environmental concerns, the impact of sustainable and eco-friendly servicescape designs on customer perceptions should be explored. Future research can examine how material choices, energy efficiency, and environmental consciousness influence audience satisfaction and brand image.
8) Personalization
and Customization
The potential for personalized and customized cinematic experiences, including tailored content recommendations, interactive seating arrangements, and adaptive immersive features, presents an exciting avenue for enhancing audience satisfaction.
9) Technological
Integration and Accessibility
Research on the challenges and opportunities in integrating immersive technologies within cinema halls, ensuring accessibility for diverse customer demographics, can contribute to inclusive entertainment experiences.
By addressing these areas, future studies can provide valuable insights for cinema operators, technology developers, and experience designers, ultimately transforming the way audiences engage with cinematic storytelling.
5. CONCLUSION
This research provides valuable insights into the dynamic relationship between immersive technology, servicescape, and customer cinematic experience (CX) within the Indian cinema industry. The findings highlight those immersive technologies, such as virtual reality (VR) and augmented reality (AR), when integrated effectively with an enhanced servicescape, play a crucial role in shaping the overall CX. Immersive technologies transport audiences beyond traditional viewing experiences, fostering heightened sensory engagement and emotional connectivity with cinematic content. This deepened immersion not only enhances enjoyment but also strengthens audience attachment to the storytelling process. Additionally, the servicescape—encompassing elements such as ambiance, layout, and aesthetics—serves as a critical factor in customer perception and satisfaction. A well-curated servicescape amplifies the impact of immersive technologies by creating an environment that aligns seamlessly with the cinematic narrative, thereby enriching the overall experience.
Understanding the synergistic effects of immersive technology and servicescape enables Indian cinemas to refine their strategies, innovate their offerings, and craft unparalleled cinematic experiences. By doing so, they can enhance customer engagement, build long-term loyalty, and maintain a competitive edge in an evolving entertainment landscape.
|
|
 This work is licensed under a: Creative Commons Attribution 4.0 International License
© IJETMR 2014-2025. All Rights Reserved.