
|
|
|
|
A STUDY ON THE IMPACT OF NOSTALGIA MARKETING ON CONSUMER BEHAVIOUR
V. Rasika 1, Dr. T. S. R. Vijay Janani 2
1 Undergraduate,
Department of Commerce (Hons.), Ethiraj College for Women, Chennai, Tamil Nadu,
India
2 Assistant Professor, Department of
Commerce (Hons.), Ethiraj College for Women, Chennai, Tamil Nadu, India
|
|
|
ABSTRACT |
|
|
Nostalgia,
which is defined as the feeling of sentimentalism, offers a sense of
familiarity and comfort. In this accelerated pace of living, there exists an
opportunity to make a quick financial gain. Brands have tapped into this
niche, exploiting this space by strategically targeting the emotions that
influence consumer perceptions, preferences, and ultimately purchasing
decisions. This study investigates the impact of nostalgia marketing on
consumer behaviour. It aims to explore the
psychological mechanisms, including self-esteem, loneliness, emotional
connection, community support, stress, and anxiety, and how these factors
ultimately affect the decisions of the consumers. Additionally, this research
also focuses on the effect of nostalgia marketing across different
generations which helps in evaluating its presence as a double-edged sword.
Finally, the study will also assess the impact of nostalgia marketing on
brand reputation and consumers’ loyalty towards the brand. Responses were
collected from 180 respondents through an online questionnaire. The
respondents were of different age groups, thus further helping in the fair
assessment and analysis of the study. The questions addressed different
aspects such as experience with nostalgia marketing campaigns, as well as
their purchasing behaviour and the impact of such
campaigns on brand perceptions. The responses yielded from the survey are
being analysed using SPSS software. The research
further seeks to address the gap in understanding the effects of nostalgia
marketing strategies. This study throws light on both positive and negative
outcomes of nostalgia marketing to maintain a balance of perspectives. |
|||
|
Received 05 February 2025 Accepted 02 March 2025 Published 30 April 2025 DOI 10.29121/ijetmr.v12.i4SE.2025.1580 Funding: This research
received no specific grant from any funding agency in the public, commercial,
or not-for-profit sectors. Copyright: © 2025 The
Author(s). This work is licensed under a Creative Commons
Attribution 4.0 International License. With the
license CC-BY, authors retain the copyright, allowing anyone to download,
reuse, re-print, modify, distribute, and/or copy their contribution. The work
must be properly attributed to its author.
|
|||
|
Keywords: Nostalgia
Marketing, Consumer Behaviour |
|||


1. INTRODUCTION
Nostalgia is often described as a feeling of pleasure, mixed with sorrow that bring forth a bittersweet longing for the past. Derived from the Greek Word ‘Nostos Algos’ which roughly translates to homecoming sorrow, nostalgia taps into the cherished memories and past experiences of the person experiencing it. Nostalgia serves as a coping mechanism as it allows individuals to seek comfort in cherished memories during times of stress or uncertainty. In marketing, brands are capitalising on nostalgia by strategically using them as a promotional tool to create an emotional connection with consumers. By associating their brands with positive concepts, ideas, events, or figures, nostalgia marketing creates a sense of comfort, happiness, and familiarity with the brand, ultimately influencing consumer behaviour. Additionally, nostalgia makes us realise the importance of relationships as a significant portion of nostalgic feelings stems from recollections of shared experiences within a social group. This sense of belonging makes consumers lose grip on the finances making them less concerned about the immediate cost and more receptive to the product.
This research aims to explore the psychological mechanisms that affect consumer decisions, analyse the impact of nostalgia marketing across different generations, evaluate nostalgia as a double-edged sword, and assess the impact of nostalgia marketing on brand reputation and consumer loyalty.
2. METHODS AND TOOLS USED
To analyse the research objectives, primary and secondary data were utilised. Primary data was collected through questionnaires completed by 180 respondents. Secondary data was gathered from research articles and publications by various organisations and websites. The survey included demographic questions, questions assessing familiarity with past brands, purchasing behaviour, and Likert-scale items measuring perceptions of nostalgia marketing’s impact on brand reputation and loyalty.
The data was analysed using IBM SPSS. Descriptive statistics summarised responses. Spearmen and Pearson’s correlations examined relationships between variables. T-test was used to compare means, ANOVAs analysed group differences, and Chi-square tests assessed categorical associations. Frequency analysis was used for Likert scale items.
3. REVIEW OF LITERATURE
3.1. Alkhafagi, Y.A.M. (2023), The Effect of Nostalgia Marketing on Consumers’ Purchase Intention, 29 (136), 27-39.
This research examines the influence of nostalgia marketing by focusing on demographic factors. The findings of the study suggest that nostalgia can be strategically integrated into product planning to enhance consumer purchase intentions. By incorporating features that trigger nostalgia into products, marketers can effectively capitalise on consumers’ emotional connections to the past. Nostalgia marketing exhibited a stronger positive effect on purchase intentions among women compared to men, which varies across marital status with widows showing the highest impact, followed by divorced, married and single individuals. The author recommends incorporating nostalgia-driven product planning for companies as their marketing strategies.
3.2. Udita Bansal, 2022, Vol. 21, No. 2, 00-00, Nostalgic Consumers: A Study of the Impact of Nostalgia Marketing on the Consumers
This paper explores the emotional and psychological power of nostalgia and its application in marketing. It examines how nostalgic themes evoke positive emotions to influence consumer preferences, purchase intentions, and brand loyalty. The study highlights that nostalgia enhances mood, self-esteem, and social connectedness, fostering favourable consumer attitudes. It also identifies individual differences, cultural contexts, and situational cues as moderating factors in nostalgia’s effectiveness. The research design includes a comprehensive literature review on the psychological mechanisms of nostalgia and its marketing applications, and survey-based data analysis to measure its impact across multicultural groups. The findings reveal that nostalgic marketing strategies significantly boost purchase intentions and brand loyalty, concluding that nostalgia is a powerful emotional tool for shaping consumer behaviour and creating strong brand connections.
3.3. Masoga, L., Mohamed, S., Madinga, N., & Wahl, K. (2024). Reconnecting with the past: Examining nostalgia advertising’s impact on purchase intentions
This study investigates the role of nostalgia in advertising and its effects on consumer attitudes and behaviours. The authors aim to assess the impact of nostalgic versus non-nostalgic advertising on consumers’ purchase intentions. The study examines how attitudes toward
advertisements and brands influence brand image, loyalty, and purchase intentions. The researchers collected data from 250 participants using online surveys. The findings revealed no significant difference between the effects of nostalgic and non-nostalgic advertising on attitudes toward the advertisement and the brand. The brand attitudes were found to significantly influence purchase intentions, brand image, and brand loyalty. In contrast, consumers’ attitude towards advertisements did not have a direct impact on purchase intentions. As a conclusion, while nostalgic advertising may not directly enhance attitudes towards brands or advertisements when compared to non-nostalgic advertising, it fosters positive brand attitudes which remains crucial for improving purchase intentions, brand image, and brand loyalty.
4. ANALYSIS AND INTERPRETATION
Table 1
|
Table 1 Age
of the Respondents |
||
|
Frequency |
Percent |
|
|
Below 20 |
29 |
16.1 |
|
20-30 |
65 |
36.1 |
|
30-40 |
7 |
3.9 |
|
40-50 |
12 |
6.7 |
|
Above 50 |
67 |
37.2 |
|
Total |
180 |
100.0 |
|
Source: Primary Data |
||
Inference:
From the above chart, it is understood that majority of the respondents are
from the age groups above 50 (37.2%) and ’20-30’ (36.1%). 16.1% of the
respondents are aged below 20, while 6.7% belong to the age group 40-50 and
3.9% belong to the age group 30-40.
Table 2
|
Table 2 Gender
of the Respondents |
||
|
|
Frequency |
Percent |
|
Female |
90 |
50 |
|
Male |
90 |
50 |
|
Total |
180 |
100.0 |
|
Source: Primary Data |
||
Inference: The above chart shows the gender distribution of the respondents of the survey. The total sample consists of 180 respondents. Out of the total respondents, 50% are female and 50% are male.
Table 3
|
Table 3 Monthly
Family Income of Respondents |
||
|
Frequency |
Percent |
|
|
Less than Rs.50,000 |
16 |
8.9 |
|
Rs. 50,000- Rs. 1,00,000 |
40 |
22.2 |
|
Rs. 1,00,000 - Rs.1,50,000 |
29 |
16.1 |
|
Rs. 1,50,000 - Rs. 2,00,000 |
24 |
13.3 |
|
Above Rs. 2,00,000 |
71 |
39.4 |
|
Total |
180 |
100.0 |
|
Source: Primary Data |
||
Inference: The above table shows the monthly family income of the respondents. Majority (39.4%) of the respondents have income above Rs 2,00,000 followed by 22.2 % respondents having a monthly family income of Rs 50,000 – Rs 1,00,000. 16.1% of the respondents have a monthly family income of Rs 1,00,000 – Rs 1,50,000. Around 13.3 % of the respondents have a monthly family income of Rs 1,50,000- Rs 2,00,000.
Chart 1
|
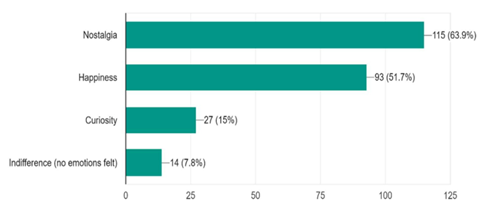
Chart 1 Emotional Response to Nostalgic Brands/Product |
Inference: The above chart shows the distribution of each emotion that respondents experienced when asked to view an image of brands and products associated with the previous generation. It can be inferred that majority of the respondents felt nostalgia when they came across the brands and products they were familiar with. The respondents have also felt happiness which is often felt along with nostalgia. However, a few respondents have acknowledged that they felt no emotions when they saw the image which suggests that nostalgic emotion is subjective and not universal as individual responses may vary.
Table 4
|
Table 4
Purchase Intentions for High-Priced Nostalgic Products |
||
|
Frequency |
Percent |
|
|
Yes,
definitely |
30 |
16.7 |
|
Yes, but only
if the price difference is small |
47 |
26.1 |
|
Maybe,
depending on the product |
92 |
51.1 |
|
Probably not |
5 |
2.8 |
|
No, not at
all |
6 |
3.3 |
|
Total |
180 |
100.0 |
|
Source: Primary Data |
||
Inference: The table presents the distribution of
responses regarding the purchasing intentions of the consumers for high-priced
nostalgic products. Majority of the respondents have chosen “Maybe, depending
on the product” (51.1%). 16.7% of the respondents are willing to purchase
high-priced nostalgic products, while 26.1% of the respondents would consider
buying them only if the price difference is small. However, a small percentage
of respondents have chosen no (3.3%) for an answer. This suggests that price
sensitivity and product-specific considerations play a crucial role in purchasing
decisions.
Table 5
|
Table 5 Relation
Between Nostalgia and the Likelihood to Purchase the Nostalgic Product |
|||||
|
Correlations |
|||||
|
Nostlagia |
Happiness |
Curiosity |
Indifferen Ce |
Likelihood |
|
|
Correlation
Coefficient |
1 |
-.149* |
-.170* |
-.300** |
.311** |
|
Nostlagia Sig. (2-tailed) |
. |
.047 |
.022 |
.000 |
.000 |
|
N |
180 |
180 |
180 |
180 |
180 |
|
Correlation
Coefficient |
-.149* |
1.000 |
-.248** |
-.300** |
.019 |
|
Happiness Sig. (2-tailed) |
.047 |
. |
.001 |
.000 |
.804 |
|
N |
180 |
180 |
180 |
180 |
180 |
|
Correlation
Coefficient |
-.170* |
-.248** |
1.000 |
-.122 |
-.091 |
|
Curiosity Sig. (2-tailed) |
.022 |
.001 |
. |
.103 |
.224 |
|
N |
180 |
180 |
180 |
180 |
180 |
|
Correlation
Coefficient |
-.300** |
-.300** |
-.122 |
1.000 |
-.125 |
|
Indifference Sig. (2-tailed) |
0 |
0 |
.103 |
. |
.096 |
|
N |
180 |
180 |
180 |
180 |
180 |
|
Correlation
Coefficient |
.311** |
.019 |
-.091 |
-.125 |
1.000 |
|
Likelihood Sig. (2-tailed) |
0 |
.804 |
.224 |
.096 |
. |
|
N |
180 |
180 |
180 |
180 |
180 |
|
*. Correlation
is significant at the 0.05 level (2-tailed). **. Correlation
is significant at the 0.01 level (2-tailed). Source: Primary Data |
|||||
Inference: The above table shows the correlation
between likelihood of purchase and various emotions such as nostalgia,
happiness, curiosity, and indifference. It can be inferred that there is a
positive correlation (r=.311) between nostalgia and the likelihood of purchasing
a nostalgic product. Therefore, as the feeling of nostalgia becomes stronger,
higher is the likelihood of purchasing a nostalgic product. The feelings of
happiness and curiosity have weak positive correlation with the likelihood to
purchase a nostalgic product. There is a negative correlation (r=-.125) between
the feeling of indifference and the likelihood of purchase.
Table 6
|
Table 6 Examination
of Generational Differences in the Perceived Manipulative Intent of Nostalgia
Marketing |
|||||
|
Anova |
|||||
|
Sum of Squares |
df |
Mean Square |
F |
Sig. |
|
|
Between Groups |
18.785 |
4 |
4.696 |
1.098 |
.359 |
|
Within Groups |
748.165 |
175 |
4.275 |
||
|
Total |
766.95 |
179 |
|||
|
Source: Primary Data |
|||||
H0 – There is no significant association between age group and the perceived manipulative intent about nostalgia marketing.
H1 – There is significant association between age group and the perceived manipulative intent about nostalgia marketing
Inference: A one-way ANOVA was conducted to examine the generational differences in the perceived manipulative intent of nostalgia marketing. Since the p-value (.359) is greater than the significance level of 0.05, we accept the null hypothesis and infer that there are statistically no significant differences between age group and the perceived manipulative intent about nostalgia marketing. Therefore, based on the data, there is no evidence to conclude that the perceived manipulative intent in nostalgia marketing varies across different age groups.
Table 7
|
Table 7 Comparision of the Positive and Negative Perceptions of
Nostalgia Marketing |
|||||
|
Paired Samples Test |
|||||
|
Mean |
Std. Deviation |
t |
df |
Sig. (2-tailed) |
|
|
Positive Perceptions |
4.44444 |
2.82689 |
21.093 |
179 |
.0000 |
|
Negative Perceptions |
|||||
|
Source: Primary Data |
|||||
H0 – There is no significant difference between the means of positive perceptions and negative perceptions of nostalgia marketing
H1 – There is a significant difference between the means of positive perceptions and negative perceptions of nostalgia marketing
Inference: A paired sample T-test was conducted to examine the difference between the positive and negative perceptions of nostalgia marketing. Since the p value (.000) is lesser than the significance level (0.05), we reject the null hypothesis and infer that there is a statistically significant difference between the positive and negative perceptions.
Table 8
|
Table 8 Mean
Value of Positive and Negative Perceptions of Brands That Use Nostalgia Marketing |
||
|
Mean |
N |
|
|
Positive_Perceptions |
15.2944 |
180 |
|
Negative_Perceptions |
10.8500 |
180 |
|
Source: Primary Data |
||
The above table shows the mean values of positive and negative perceptions. The mean value of the positive perceptions is 15.2944 and the mean value of the negative perceptions is 10.8500. The mean score of positive perceptions is significantly higher than the negative perceptions. It can be inferred that the respondents held significantly more positive views than negative views about brands that use nostalgia marketing.
Chart 2
|
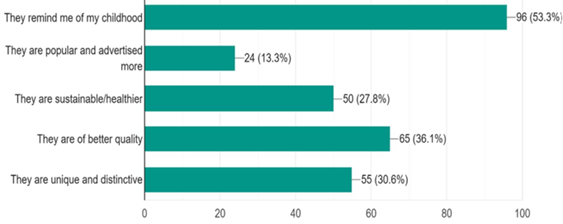
Chart 2 Reasons for
the Purchase of Products from Older Generations |
Inference: The above chart is based on the
responses provided by the respondents regarding the reasons why they choose to
buy products from the older generation as consumers. Majority of respondents
(53.3%) have selected “They remind me of my childhood” which indicates the
strong influence of nostalgia in choosing products from the older generations.
36.1% of the respondents believed that products from the older generations are
of better quality which suggests that perceived quality acts as a motivator in
influencing consumer choice. 30.6 % of the respondents are drawn to the “unique
and distinctive” nature of older generation products. 27.8% of the respondents
have admitted to choose to buy products from the older generations because they
find them to be sustainable and healthier. This factor remains to be moderately
influential. 13.3% of the respondents have chosen the popularity and
advertising of the products, making it the least influential factor.
Chart 3
|
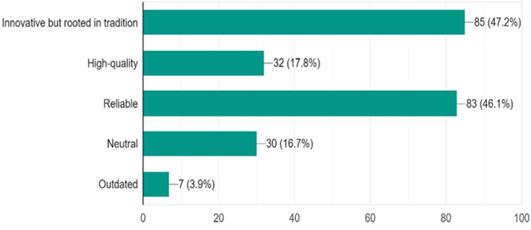
Chart 3 Impact of
Nostalgia Marketing on Brand Reputation and Consumer Loyalty |
Inference: The above chart presents the results the
responses of the respondents about their perceptions of brands that use
nostalgia marketing. A vast majority of the respondents hold positive views of
brands as they are perceived ‘Innovative but rooted in tradition’ (47.2%) and
‘Reliable’ (46.1%). This suggests that the consumers appreciate brands that
innovate the products from older generations. Therefore, there is more scope
for the brands to diversify their product line by incorporating innovative
features in nostalgic products to keep up with the latest advancements and
maintain customer loyalty. 17.8% of the respondents’ associate “High- Quality”
with the brands that use nostalgia marketing. This suggests that while
nostalgia marketing contributes to positive brand perceptions, it may not
influence the consumers’ perception about the product quality. A small
percentage of respondents hold neutral (16.7%) views. Though 3.9% of
respondents who have chosen “Outdated” as their perception of brands that use
nostalgia marketing is minimal, it indicates that nostalgia marketing must be
executed carefully by the brands to not make them perceived as outdated or
manipulative.
Table 9
|
Table 9 Relationship
Between Purchase Frequency, Loyalty, Reputation and Brand Outcomes |
|||||
|
Correlations |
|||||
|
Frequency |
Loyalty |
Reputation |
Positive |
Negative |
|
|
Correlation |
1.000 |
.206** |
.296** |
.307** |
-.019 |
|
Coefficient |
|||||
|
Frequency |
|||||
|
Sig. (2-tailed) |
. |
.006 |
.000 |
.000 |
.801 |
|
N |
180 |
180 |
180 |
180 |
180 |
|
Correlation |
.206** |
1 |
.479** |
.744** |
.041 |
|
Coefficient |
|||||
|
Loyalty |
.006 |
. |
.000 |
.000 |
.587 |
|
Sig. (2-tailed) |
|||||
|
N |
180 |
180 |
180 |
180 |
180 |
|
Correlation |
.296** |
.479** |
1 |
.935** |
.183* |
|
Coefficient |
|||||
|
Reputation |
|||||
|
Sig. (2-tailed) |
.000 |
.000 |
. |
.000 |
.014 |
|
N |
180 |
180 |
180 |
180 |
180 |
|
Correlation |
.307** |
.744** |
.935** |
1 |
.142 |
|
Coefficient |
|||||
|
Positive |
|||||
|
Sig. (2-tailed) |
.000 |
.000 |
.000 |
. |
.057 |
|
N |
180 |
180 |
180 |
180 |
180 |
|
Correlation |
-0.019 |
.041 |
.183* |
.142 |
1.000 |
|
Coefficient |
|||||
|
Negative |
.801 |
.587 |
.014 |
.057 |
. |
|
Sig. (2-tailed) |
|||||
|
N |
180 |
180 |
180 |
180 |
180 |
|
**. Correlation
is significant at the 0.01 level (2-tailed). *. Correlation
is significant at the 0.05 level (2-tailed). Source: Primary Data |
|||||
5. Variables
· FREQUENCY- Frequency of the purchase of a product due to nostalgia marketing
· LOYALTY- Consumer loyalty towards nostalgic brands
· REPUTATION- Reputation of brands that use nostalgia marketing
· POSITIVE- Consumers’ positive perception towards nostalgia marketing NEGATIVE- Consumers’ negative perception towards nostalgia marketing
Inference: The above table shows the correlation between different variables that impact the brand reputation and consumer loyalty of brands that use nostalgia marketing. Brand reputation and positive perceptions show a strong positive correlation (r= .744, p< .01). Consumer loyalty has a positive correlation with brand reputation and positive perceptions. This indicates that positive perceptions of nostalgia marketing enhance the brand reputation and consumer loyalty. However, the frequency of purchase and negative perceptions have a weak negative correlation.
6. CONCLUSION
The aim of the study was to investigate the impact of nostalgia marketing on consumer behaviour. The results showed that most of the respondents were emotionally connected with nostalgic products making it a powerful marketing tool. However, it was also revealed that nostalgia is not universal as a few respondents did not strongly feel nostalgic towards brands and products from older generations. The analysis also revealed that although nostalgia increases consumer preferences towards buying nostalgic products, pricing played a crucial role in influencing their decisions. This suggests that brands must keep in mind product specific considerations and pricing strategies while marketing. It was also revealed that the more a consumer feels nostalgic about a product, the likelihood to purchase increases. Although the analysis revealed no relationship between the perceived manipulative intent and age groups, the brands must keep in mind that the concern is universal and maintain a balance to resonate with the consumers. The analysis also suggests that although, consumers hold more positive views than negative views by perceiving brands that promote nostalgic products as innovative and reliable brands must ensure that the quality of the nostalgic products meet consumers’ expectations. The brands also have more scope to diversify their product line by incorporating innovative features in nostalgic products to keep up with the latest advancements and maintain customer loyalty. Overall, it can be concluded that nostalgia is a potential tool for influencing consumer decisions, but the effectiveness depends on balancing emotional appeal, price considerations, and quality to resonate positively with the consumers.
CONFLICT OF INTERESTS
None.
ACKNOWLEDGMENTS
None.
REFERENCES
https://journals.christuniversity.in/index.php/artha/article/view/3316/2224
https://proceedings.emac-online.org/pdfs/A2024-118522.pdf
https://aokmarketing.com/the-psychology-of-nostalgia-marketing-why-it-works-and- how-to-use-it/
https://journals.christuniversity.in/index.php/artha/article/view/3316/2224
https://sajip.co.za/index.php/sajip/article/view/669
https://lup.lub.lu.se/luur/download?func=downloadFile&recordOId=9049506&fileOI d=9049508
|
|
 This work is licensed under a: Creative Commons Attribution 4.0 International License
© IJETMR 2014-2025. All Rights Reserved.