
|
|
|
|
ANALYSIS OF THE CAUSE AND EFFECT OF CONTRACT CHANGE ORDER ON CONSTRUCTION PROJECTS IN BANYUMAS REGENCY
Taufik Dwi Laksono
1, Dwi Sri Wiyanti
2![]()
1 Construction
Management, Madyathika Polytechnic Purbalingga, Kedung Menjangan Kecamatan Purbalingga Jawa Tengah, Indonesia
2 Civil
Engineering, Faculty of Engineering, Wijayakusuma
University Purwokerto, Jl. Beji Kampus
Karangsalam Purwokerto
Indonesia
|
|
|
ABSTRACT |
|
|
Change Order
(CO) in a building construction project can lead to modification in the scope
of work, execution time, or cost. Therefore, a Contract Change Order (CCO) is ensued. Many government building projects in Banyumas Regency are going through Contract Change
Orders, whether big-scale or small-scale construction projects. An analysis
is conducted to investigate the causes and effects of the Contract Change
Order on building projects in the Banyumas Regency
to anticipate the Contract Change Order so that it occurs as minimally as
possible using the Structural Equation Modelling (SEM) analysis method. This
study identified ten (10) factors that cause Change Order. The data came from
questionnaires from 30 respondents who work on construction projects in Banyumas Regency. Each respondent gave their opinion on
the frequency and effect by using a Likert scale of 1-5. Of the ten (10)
factors that caused CCO, the most dominant is the contractor's problem. Of
the three (3) factors that affect Contract Change Order (CCO), the factor
that affects quality the most is regulation and policy changes, the factor
that affects cost the most are security and safety obstacles, and the one
that affects time the most is the project owner policy. |
|||
|
Received 05 June 2024 Accepted 04 July 2024 Published 25 July 2024 Corresponding Author Dwi Sri Wiyanti, sriwiyanti2@yahoo.com DOI 10.29121/ijetmr.v11.i7.2024.1476 Funding: This research
received no specific grant from any funding agency in the public, commercial,
or not-for-profit sectors. Copyright: © 2024 The
Author(s). This work is licensed under a Creative Commons
Attribution 4.0 International License. With the
license CC-BY, authors retain the copyright, allowing anyone to download,
reuse, re-print, modify, distribute, and/or copy their contribution. The work
must be properly attributed to its author.
|
|||
|
Keywords: Change Order,
Contract Change Order, Construction Project, Structural Equation Modelling (SEM)
Analysis |
|||


1. INTRODUCTION
Change Order, according to AIA (American Institute of
Architects), is a written request signed by the architect, contractor, and
owner after the contract is published to adjust the scope of work, contract value, and completion time.
In a building
project, problems often occur. One of them is change order in the beginning,
the middle, or the end project stage. Change Order in a building project leads
to modification in the scope of work, time, or budget. A Contract Change Order (CCO) is
an agreement letter between the project owner and the hired worker to emphasize
regulation modification and how much cost of the worker's compensation is
required for the project after signing the contract Fisk & Reynold (2006).
Contract
Change Order (CCO) can also be interpreted as a regulation approved by the
project worker, planner, and owner. After the basic agreement is issued,
adjustment is made in several work stages according to cost and time. The
changes can be additions, subtractions, or changes in work volume negotiated in
the initial business contract.
CCO that frequently occurs can have negative effects,
both direct and indirect, on the contractor and project owner. Some direct
effects are work item costs addition caused by increasing volume and material,
overhead, and human resources costs. On the other hand, the indirect effect is
a dispute between owners and contractors.
The purposes of CCO are as follows Perwitasari et al. (2020):
1)
Modify the contract plan by using a special payment
method.
2)
To modify work specifications, including payment
and contract duration.
3)
To approve additional works, including the payment
adjustment.
4)
For administration purposes, to determine payment
methods according to the adjustment.
5)
To adjust the contract unit price if there is a
specification change.
6)
To propose an intensive cost subtraction (proposal
value engineering).
7)
To adjust the project schedule.
8)
To avoid disagreement among stakeholders.
In general, there
are two types of Contract Change Order (CCO) they are directive change and
constructive change.
1)
Directive Change
Directive Change
is a change written and proposed by the contractor to the owner to change the
scope of work, execution time, budget, and other things in the contract. The
regulation usually gives one-sided authority where the owner can change the
scope of work and force the contractor to follow it. Formal changes generally
have been socialized before executing the project.
2)
Constructive Change
Constructive
change is an order of a contract modification on site. It is requested by the
owner, planner, and contractor. This change is also defined as an agreement of
change between owner and contractor in terms of cost and time. Construction
change is often regarded as the primary cause of disputes between owners and
contractors because the project execution differs from the contract
documents.
According to Putra & Sulistio
(2020), the causes of CCO that are not
directly related to construction project stakeholders include weather
conditions, health and safety, changes in economic conditions, social and
cultural factors, and unpredictable problems. In short, it can be explained as
follows :
1)
Weather
conditions: Bad
weather can affect outdoor activities in construction projects. The weather has
a negative effect that is slowing down the construction project. The changes are made to
compensate for the project delay and cost addition.
2)
Health
and Safety factors:
Health and Safety are essential in successfully finishing a building project.
Disobedience to health and safety rules can lead to changes in project design.
3)
Economic
condition change:
Economic condition is one of many factors that affect construction projects.
Changes in economic conditions during construction projects lead to CCO to
decrease project costs.
4)
Socio-cultural
factor: Inadequate
coordination between professionals who have different socio-cultural
backgrounds can lead to a Contract Change Order (CCO), and changes may needed for the project team.
5)
Unexpected problems: Unexpected problems are often
faced by professionals in the construction industry. This condition, if not
solved, can lead to a Contract Change Order for the project.
Contract Change
Order (CCO) has a significant effect if not well anticipated, such as construction cost rise, late
completion of work, productivity decline, dispute between contractor and owner,
et cetera. Sun & Meng (2009) divided the effect of CCO into five
groups, they are:
1)
In relation to time.
Late completion of
work, late logistic arrival, late procurement requirements and materials,
rework, demolition, and Re-plan.
2)
In relation to cost.
Additional cost,
overhead cost addition, compensation fund, cash flow changes, profit loss, and
additional contractor payments.
3)
In relation to productivity.
Work productivity
decline of human resources and equipment, project schedule compression.
4)
In relation to risk.
Increased project
risk level, hampered project development, decreased project acceleration
opportunity, obstacles on site and every work stage
5)
Other relation.
Low
professional relationships, disputes and claims, low quality of work, bad
reputation, and bad safety condition
Lela (2022) conducted an Analysis of the cause and effect of a Contract Change Order on the
contractor performance in a construction project in South Minahasa Regency. The
results show that the dominant factor of cause and effect in the CCO of a
construction project in South Minahasa Regency is the addition and subtraction
of work factors. However, those factors do not affect the contractor's
performance.
Palilati et al. (2022) conducted a study of the
factors that cause variation order in building projects in Gorontalo Province,
which are Pulubala 1 High School (a physics laboratory) and North Gorontalo 5
High School (three new classrooms). The analysis result, based on descriptive
statistics analysis of seventeen variables, the dominant factor is a design
change, which is a planning and volume estimation mistake. Based on descriptive
statistic analysis with five influence variables, the dominant factor is
changing the work execution method.
Rohana (2018)
conducted a study of analysis of factors that cause CO in the project of
inspection road improvement.
This study used eleven (11) indicator questions they are: problems in the
project location, design change, site condition, cost problem, the contractor’s
problem, safety and security, work technique change, project documentation
mistake, project owner problem, supervising consultant, and regulation change.
This study is conducted using a mixed method by distributing a questionnaire to 50 respondents. This
study uses descriptive statistic analysis.
Many government
construction projects in Banyumas Regency are also experiencing CCO, both
big-scale and small-scale projects. An analysis is conducted to investigate the
cause and the effect of CO in construction execution in Banyumas Regency to
anticipate and minimize CCO.
The difference
from the previous analysis lies in the indicators or variables used. In this
study, two variables were used: causal variable and influence variable. Ten
(10) indicators that were adapted to causal variables are:
1)
Problems in project location.
2)
Design mistakes
3)
Physical condition on site.
4)
Project cost problem.
5)
Contractor’s problem.
6)
Security and Safety Obstacles.
7)
Changes in scope of work.
8)
Project owner policy.
9)
Supervising consultant problem.
10) Changes in policies and regulations.
For influence
variables there are three of them, they are quality, cost, and time.
2. MATERIAL AND METHOD
Study location is the study object where the study is carried out.
Determining the study location is aimed at simplifying or clarifying the
location that became the target of the study. The reason for choosing Banyumas
Regency as the study location is that a study about the cause and effect of CCO
has never been done in Banyumas Regency. Moreover, nowadays, there are many
construction projects in Banyumas Regency.
This study uses both qualitative and quantitative data (Mix Methode). This
study started from a case study that generated qualitative data input using a
questionnaire. The qualitative data was then processed to become quantitative
data using Structural Equation Methode (SEM) to find the cause and the effect
of CCO on construction projects in the Banyumas Regency.
The sampling method used in the study is nonprobability, which is
convenience sampling. Sample collection by convenience sampling is sample
collection by freely choosing the sample according to the researcher’s will.
This method is chosen to simplify the study process because there are a lot of
construction service providers available. The convenience sampling method is
picked based on the availability of the resources and is easy to get.
This study collected data from a questionnaire and processed it using the
SEM method, considering population size, limited time, and cost, and applied it
to 30 contractors who had worked on a building project in Banyumas
Regency.
The data in this study is in the form of
primary and secondary data. Primary data is first-hand data obtained by the
researcher related to the variable of interest and specifically aimed for the
study. Primary data in this study used a questionnaire to find the respondent's
opinions on the cause and effect of CCO on construction projects. In this
questionnaire, respondent opinion is stated by the Likert scale. Secondary data
is data that indirectly gives information to the researcher, such as
literature, journals, and books related to the study.
The data was collected to investigate the cause and effect of CCO on construction projects
in the Banyumas Regency. In this study, a questionnaire was made and
distributed to 30 respondents who were contractors who had worked on a
construction project in Banyumas Regency. The questionnaire consists of several
questions, and respondents must choose one of the available answer choices by
the measurement scale of this study. This study uses five (5) points Likert
Scale.
Variables in
this study consist of one exogenous latent variable (the cause of CCO and one
endogenous latent variable (the effect of CCO) obtained from the previous
study about the cause factors of CCO with the title of Analysis of the Cause
Factors of Change Order on the Project on Inspection Road Improvement Novia et al. (2018).
The next is
determining the variables of the study. Each latent variable is measured with
indicators, as seen in Table 1.
Table 1
|
Table 1 Variables of Study |
|
|
The causes of
CCO (η) |
|
|
X1 |
Problems in project
location |
|
X2 |
Design mistakes |
|
X3 |
Physical condition on
site |
|
X4 |
Project Cost Problem |
|
X5 |
Contractor’s problem |
|
X6 |
Security and safety
obstacles |
|
X7 |
Changes in Scope of
Work |
|
X8 |
Project Owner’s policy
|
|
X9 |
Supervising consultant
problem |
|
X10 |
Changes in policy or
regulation |
|
The effects of CCO (ξ) |
|
|
Y1 |
Quality |
|
Y2 |
Cost |
|
Y3 |
Time |
The questionnaires
were directly distributed to the respondents, and the questions were divided
into two parts. Part A consists of individual data, they are name, work
position, and company name. Part B consists of questions and the collection of
the data that will be used as a reference in data processing. The questions are
about the factors that caused CCO and the effect of CCO on construction
projects in Banyumas Regency with frequency levels of Never to Very Often.
The analysis
stages that were carried out to achieve the purpose of the study are as
follows:
1)
Data collection through questionnaires.
2)
Validity and reliability test of the questionnaire
data.
·
Validity is a precision degree that accurately
measures what will be measured Hair et al. (2010). The validity
measurement method used is product correlation of rough moment or Pearson
correlation.
·
Reliability is an index that shows a variable or a
set of consistent variables in a measurement so that if the measurement is
carried out multiple times, the value is consistent Hair et al. (2010).
3)
Testing the assumption of a normal multivariate
distribution. If there is an unfulfilled assumption (one of them is the
assumption of normal multivariate), an alternative method will be used, one of
them is SEM-PLS.
4)
Carried out an analysis using the SEM-PLS method.
5)
Concluding.
3. RESULT AND DISCUSSION
In this study, 30 respondents were used as a sample of
service providers. In this case, the contractors who had worked on construction
projects in Banyumas Regency. To obtain a valid and consistent answers from the
respondents, a test of validity and reliability is carried out on each
indicator. In this test, a critical correlation coefficient is obtained from
the r distribution table that uses a 5% signification rate so that the r table
= 0,361.
The following Table 2 is a questionnaire result table.
Table 2
|
Table 2 Questionnaire Results |
|||||||
|
Variable |
Question |
Indicator |
>
10 Times |
6 - 10 Times |
2
- 5 Times |
<
2 Times |
0 Times |
|
|
|
|
1 |
2 |
3 |
4 |
5 |
|
|
Problems in project
location |
X1 |
3 |
4 |
13 |
8 |
2 |
|
|
Design mistakes |
X2 |
2 |
3 |
16 |
7 |
2 |
|
|
Physical condition on
site |
X3 |
4 |
4 |
14 |
4 |
4 |
|
|
Project Cost Problem |
X4 |
2 |
3 |
9 |
10 |
6 |
|
X |
Contractor’s problem |
X5 |
2 |
3 |
7 |
7 |
11 |
|
|
Security and safety
obstacles |
X6 |
2 |
3 |
6 |
9 |
10 |
|
|
Changes in Scope of
Work |
X7 |
1 |
5 |
6 |
15 |
3 |
|
|
Project Owner’s policy |
X8 |
3 |
4 |
11 |
9 |
3 |
|
|
Supervising consultant
problem |
X9 |
5 |
1 |
14 |
5 |
5 |
|
|
Changes in policy or
regulation |
X10 |
3 |
3 |
10 |
8 |
6 |
|
Y |
Quality |
Y1 |
0 |
5 |
7 |
10 |
8 |
|
|
Cost |
Y2 |
1 |
4 |
12 |
12 |
1 |
|
|
Time |
Y3 |
0 |
6 |
15 |
7 |
2 |
With the help of a
computer program, namely SPSS Statistic 26, the following are the results of
the indicators validity and reliability test of the study variables as
presented in Table 3:
Table 3
|
Table 3 Questionnaire Validity Test |
||||
|
Number |
Question |
Corrected item - Total Correlation |
r table |
Note |
|
The Cause of CCO (X) |
||||
|
1 |
Problems in project
location |
0.862 |
0.361 |
Valid |
|
2 |
Design mistakes |
0.521 |
0.361 |
Valid |
|
3 |
Physical condition on
site |
0.67 |
0.361 |
Valid |
|
4 |
Project cost problem |
0.778 |
0.361 |
Valid |
|
5 |
Contractor’s problem |
0.798 |
0.361 |
Valid |
|
6 |
Security and safety
obstacles |
0.891 |
0.361 |
Valid |
|
7 |
Changes in scope of
work |
0.791 |
0.361 |
Valid |
|
8 |
Project owner’s policy |
0.871 |
0.361 |
Valid |
|
9 |
Supervising consultant
problem |
0.821 |
0.361 |
Valid |
|
10 |
Changes in policy or
regulation |
0.803 |
0.361 |
Valid |
|
The Effect of CCO (Y) |
||||
|
11 |
Quality |
0.820 |
0.361 |
Valid |
|
12 |
Cost |
0.868 |
0.361 |
Valid |
|
13 |
Time |
0.745 |
0.361 |
Valid |
If the value of 𝑟calculated> 𝑟table, then the question is valid. 𝑟calculated can be seen in the corrected
item-total correlation column.
From Table 3, it can be
concluded that all the indicators are valid, the value of 𝑟calculated > 0,361 or 𝑟table and can
be used for further analysis.
Furthermore, a test of reliability was carried out to find out how far the
level of consistency of each respondent’s questionnaire result.
Table 4
|
Table 4 Questionnaire
Reability Test |
|
|
Variable |
Cronbach’s Alpha |
|
X |
0,930 |
|
Y |
0,734 |
Table 4 shows the
result of the questionnaire reliability test is valid. The result of the X
instrument (the Causes of CCO) reliability is 0,930, and the result of the Y
instrument (the Effects of CCO) is 0,734. On the other hand, Cronbach’s
Alpha value of the two variables are above 0,7, so those variables meets
the requirements.
Before an analysis of the Respondent’s Level of Achievement is carried out,
a calculation of the number of respondents for each item’s score was done to
find out the respondent’s perception of the indicators. The application of SPSS
26 was used to help with the calculation.
The loading
factor is the number that shows a correlation between a question’s score and
the Konstrak indicator’s score. Loading factor value over 0,7 is considered
valid. However, according to Hair (1998), a loading factor value of
approximately 0.3 is considered to have met the minimum level, and greater than
0.5 is considered significant.
The results of the
Loading Factor value are presented in Table 5.
Table 5
|
Table 5 Loading Factor Value |
||
|
Variable |
Indicator |
Outer Loading |
|
The
Causes of CCO |
X1 |
0.855 |
|
X2 |
0.514 |
|
|
X3 |
0.646 |
|
|
X4 |
0.776 |
|
|
X5 |
0.805 |
|
|
X6 |
0.908 |
|
|
X7 |
0.810 |
|
|
X8 |
0.866 |
|
|
X9 |
0.809 |
|
|
X10 |
0.811 |
|
|
The
Effects of CCO |
Y1 |
1.000 |
|
Y2 |
1.000 |
|
|
Y3 |
1.000 |
|
Table 5 show that the the indicators
of each variable is > 0,5. So, it can be stated that they are valid.
After processing
the data using SmartPLS 3.0, the results of cross-loading are shown in the
following Table 6.
Table 6
|
Table 6
Cross-Loading Results |
||||
|
|
The Cause (X) |
Quality (Y1) |
Cost (Y2) |
Time (Y3) |
|
X1 |
0,855 |
0,393 |
0,336 |
0,184 |
|
X2 |
0,514 |
0,425 |
0,101 |
0,191 |
|
X3 |
0,646 |
0,473 |
0,279 |
0,141 |
|
X4 |
0,776 |
0,589 |
0,446 |
0,127 |
|
X5 |
0,805 |
0,639 |
0,489 |
0,110 |
|
X6 |
0,908 |
0,654 |
0,562 |
0,381 |
|
X7 |
0,810 |
0,460 |
0,344 |
0,397 |
|
X8 |
0,866 |
0,866 |
0,315 |
0,302 |
|
X9 |
0,809 |
0,809 |
0,315 |
0,308 |
|
X10 |
0,811 |
0,679 |
0,524 |
0,209 |
|
Y1 |
0,679 |
1,000 |
0,579 |
0,333 |
|
Y2 |
0,679 |
0,579 |
1,000 |
0,556 |
|
Y3 |
0,309 |
0,333 |
0,556 |
1,000 |
Table 6 show the correlation value of the
construct with its indicators is higher than the correlation value with another
construct. Therefore, all constructs or latent variables already have good
discriminant validity where the indicators within the construct block are
better than the indicators of another block. The cross-loading value of each
construct was evaluated to make sure that the construct correlation with the
measurement item was the highest among the other construct. The expected
cross-loading value is over 0,7 Ghozali &
Latan (2015).
Table 6 shows the construct correlation values
of X1 to X10 indicators are higher than Y1, Y2, and Y3 indicators, the
correlation value of Y1 is higher than X, Y2, and Y3, the correlation value of
Y2 is higher than X, Y1, and Y3, and the correlation value of Y3 is higher than
X, Y1, and Y2.
The recommended
result is that the AVE root value must be higher than the correlation between
construct value (Yamin and Kurniawan, 2011). In this study, the AVE value and
AVE square root of each construct are shown in Table 7 as follows:
Table 7
|
Table 7 AVE Value and AVE Square Root |
|
|
Average Variance Extracted
(AVE) |
|
|
The Cause (X) |
0,621 |
|
Quality (Y1) |
1,000 |
|
Cost (Y2) |
1,000 |
|
Time (Y3) |
1,000 |
According to Table 7, all constructs show an AVE value
higher than 0,50. The lowest value is 0,621, which is the value variable of the
cause of CCO (X). That value has met the requirement of a minimum AVE value of
0,50.
The results of the
correlation between constructs with AVE quarter root value are presented in Table 8 below:
Table 8
|
Table 8 Correlation Value Between Construct with AVE Quarter
Root Value |
||||
|
|
Cost (Y2) |
Quality (Y1) |
The Cause (X) |
Time(Y3) |
|
Cost (Y2) |
1,000 |
|
|
|
|
Quality (Y1) |
0,579 |
1,000 |
|
|
|
The Cause (X) |
0,496 |
0,679 |
0.788 |
|
|
Time
(Y3) |
0,556 |
0,333 |
0,309 |
1,000 |
Table 8 shows that the AVE quarter root value
of each construct is higher than its correlation value, so the construct in
this study can be said to have good discriminant validity.
According to Hair et al. (2014), the composite reliability coefficient
must be higher than 0,7. The output result of SmartPLS for composite
reliability are shown in Table 9.
Table 9
|
Table 9 Composite
Reability (CR) Value of Each Variable |
|
|
|
Composite Reability |
|
Cost (Y2) |
1,000 |
|
Quality (Y1) |
1,000 |
|
The Cause (X) |
0,941 |
|
Time (Y3) |
1,000 |
Table 9 shows the composite reliability value
is higher than 0,7. This shows that all the indicators used to measure latent
variables are reliable.
All indicators
have been tested on the outer model, and the results are that all indicators
fulfill the validity and reliability requirements. So, the next step is to
analyze the inner model.
The measurements
that can be used to evaluate the structural model (inner model) are R2. The
criteria for R Square values of 0.67, 0.33, and 0.19 as strong,
moderate, and weak Chin (1998) in Ghozali & Latan (2015).
Variant Analysis
(R2) or Determination Test is shown in Table 10.
Table 10
|
Table 10 R - Square |
||
|
|
R Square |
R Square Adjusted |
|
Quality (Y1) |
0,461 |
0,442 |
|
Cost (Y2) |
0,246 |
0,219 |
|
Time
(Y3) |
0,095 |
0,063 |
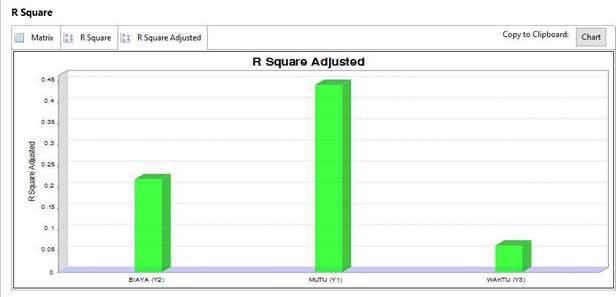
Based on above Table 10, the R Square value of effects
together or the simultaneous indicators of X against Y1, Y2, and Y3 are as
follows:
1)
R Square value X against Y1 is 0,461 with an adjusted r square value of
0,442 (moderate). Therefore, the effect of all exogenous constructs on Y is
considered moderate.
2)
R Square value X against Y2 is 0,246 with an adjusted r square value of
0,219 is considered weak.
3)
R Square value X against Y3 is 0,095 with an adjusted r square value of
0,063 is considered weak.
Figure 1
|
Figure
1 R square Graphic |
Figure 1 shows the R square value with green
color, so that model is good enough to explain the variables of the study.
Apart from looking
at the large R Square value, where the Q2 value is between the value range 0 to
1, so it can be said that the model is appropriate.
4. CONCLUSION AND RECOMMENDATION
From the
results of this study, it can be stated that of the ten (10) factors that
caused CCO and three (3) factors that affect CCO, all are valid and reliable.
The ten (10) factors that cause CCO can be sorted from the most dominant based
on descriptive analysis as follows:
1)
Contractor’s problem
2)
Security and safety obstacles
3)
Project cost problem
4)
Changes in scope of work
5)
Changes in policy or regulation
6)
Project owner’s policy
7)
Design mistakes
8)
Supervising consultant problem
9)
Problems in project location
10) Physical condition on site
The results of
SEMPLS analysis of three (3) factors that affect CCO: quality, cost, and time are as follows :
1)
The effect of quality, from the said ten (10) factors, the most influential
is changes in policy or regulation.
2)
The effect of cost, from the said ten (10) factors, the most influential is
security and safety obstacles.
3)
The effect of time, from the said ten (10) factors, the most influential is
project owner’s policy.
From the study
result, it can also be stated that the structure model of the study is pretty
good. This can be seen from the value of Q2 = 0,632 > 0, which means
the model has predictive relevance where the closer it is to 1, the better the
model.
By using the SEM-PLS method, this study shows that the factors that cause CCO have a significant effect on the effect variables of a CCO and provides an overview of the factors that cause and affect the existence of a Contract Change Order in the Banyumas Regency. Therefore, it is recommended that service providers improve their quality so that they can minimize CCO on other construction projects so that project work can run more effectively, both in terms of time and costs.
CONFLICT OF INTERESTS
None.
ACKNOWLEDGMENTS
None.
REFERENCES
Chin, W.W. (1998). The Partial Least Squares Approach for Structural Equation Modelling. Modern Method for Business Research. London: Lawrence Erlbaum Associates, 295-236.
Fisk, E., & Reynold, W. (2006). Contruction Project Administration (8th Ed.). New Jersey, Pentice Hall Inc.
Ghozali, I. (2012). Aplikasi
Analisis Multivariate dengan Program IBM SPSS. Yogyakarta:
Universitas Diponegoro.
Ghozali, I. (2016). Aplikasi
Analisis Multivariate dengan Program IBM SPSS Semarang: Undip.
Ghozali, I., & Latan, H. K. (2015). Teknik dan Aplikasi Menggunakan Program SmartPLS 3.0. Semarang: Undip.
Hair, J. F. (1998). Multivariate Data Analysis (5th Ed.). Prentice Hall, Upper Saddle River: New Jersey.
Hair, J. F., Black, W. C., Babin, B. J., & Anderson, R. E. (2010). Multivariate Data Analysis (7th Ed.). New York: Prentice Hall.
Hair, J. F., Hult, G. T., Ringle, C. M., & Sarstedt, M. (2014). A Primer on Partial Least Squares Structural Equation Modeling (PLS-SEM). United States of America: SAGE Publication, Inc.
Lela, J. C. (2022). Analisis Penyebab Dan Pengaruh Contract Change Order Terhadap Kinerja Kontraktor Pada Proyek Konstruksi Di Kabupaten Minahasa Selatan. Jurnal Ilmiah Media Engineering, 12(1), 21-24.
Palilati, P. M., Hadi, A. K., & Musa, R. (2022). Analisis Faktor-Faktor Penyebab adanya Variant Order pada Proyek Geduung Pendidikan di Provinsi Gorontalo. Jurnal Konstruksi Makasar, 1(6).
Perwitasari, D., Rahadianto, D., & Parapat, N. (2020). Identifikasi Dampak Contract Change Order Terhadap Biaya dan Kualitas Pada Proyek Gedung Laboratorium Teknik 2 Institut Teknologi Sumatra, 1-8.
Putra, H. E., & Sulistio, H. (2020). Pengaruh Change Order Terhadap Biaya, Mutu, Dan Waktu Pada Proyek Konstruksi Gedung Bertingkat. JMTS: Jurnal Mitra Teknik Sipil, 3(4), 1349. https://doi.org/10.24912/jmts.v3i4.8233
Rohana, N. S. (2018). Analisa Faktor-Faktor Penyebab Change Order Pada Proyek Peningkatan Jalan Inspeksi. Jurnal Rab Construction Research. Universitas Internasional Batam, 3(2).
Sugiyono (2011). Metode Penelitian Kuantitatif, Kualitatif dan R&D. Bandung: Alfabeta.
Sugiyono (2012). Metode Penelitian Kuantitatif, Kualitatif, dan R&D. Bandung: Alfabeta.
Sugiyono (2014). Metode Penelitian Pendidikan Pendekatan Kuantitatif, Kualitatif, dan R&D. Bandung: Alfabeta.
Sugiyono (2015). Penelitian
Kuantitatif, Kualitatif,
dan R&D. Bandung: Alfabeta.
Sugiyono (2019). Statistika untuk Penelitian. Bandung: CV Alfabeta.
Sun, M., & Meng, X. (2009). Taxonomy for Change Causes and Effects in Construction Projects. International Journal of Project Management, 27(6), 560-572. https://doi.org/10.1016/j.ijproman.2008.10.005
|
|
 This work is licensed under a: Creative Commons Attribution 4.0 International License
© IJETMR 2014-2024. All Rights Reserved.