
|
|
|
|
Liver Ultrasound Imaging Lesion Detection based on YOLO
Chien-Hsing Huang 1![]()
![]()
1 Department
of Information Engineering, I-Shou University, Kaohsiung City, Taiwan, P.O.C.
|
|
|
ABSTRACT |
|
|
The liver is a
silent organ with no pain-sensing nerves. When the body's functions begin to
appear abnormal, it may have entered the trilogy of liver diseases:
"hepatitis, cirrhosis, and liver cancer." An abdominal ultrasound
is a powerful tool for checking liver health. With the rapid development of
ultrasound technology, ultrasound machines are gradually developing in the
direction of miniaturization and cheapness, transforming from
hospital-specific equipment to home medical equipment. However, ultrasound
diagnosis requires professional knowledge, which has also become the
threshold for the popularization of ultrasound diagnosis. This article uses
artificial intelligence and machine learning technology to take the liver ultrasound images marked by professional doctors
as a data set. After training of image object detection model YOLO, it can be
used to detect tumors, hepatic hemangioma, radiofrequency cautery, abscess
and metastatic, the accuracy can reach 98%. |
|||
|
Received 02 June 2024 Accepted 02 July 2024 Published 24 July 2024 Corresponding Author Chien-Hsing
Huang, raylan@isu.edu.tw DOI 10.29121/ijetmr.v11.i7.2024.1475 Funding: This research
received no specific grant from any funding agency in the public, commercial,
or not-for-profit sectors. Copyright: © 2024 The
Author(s). This work is licensed under a Creative Commons
Attribution 4.0 International License. With the
license CC-BY, authors retain the copyright, allowing anyone to download,
reuse, re-print, modify, distribute, and/or copy their contribution. The work
must be properly attributed to its author.
|
|||
|
Keywords: Artificial
Intelligence, Machine Learning, Ultrasound Imaging, Medical Image, Object
Detection, YOLOv4 |
|||


1. INTRODUCTION
The principle of ultrasonic detection is that the ultrasonic probe emits high-frequency sound waves, and when the sound waves hit the interface, a rebound wave is generated. The probe then detects the tissue structure of the abdomen through the relative position of the interface and the probe. When an area is seen on ultrasound as darker than surrounding areas, it is called liver shadowing. The following conditions may cause liver shadows: Williams (2006)
· Hepatic Hemangioma: A common benign tumor formed by abnormal proliferation of blood vessels in the liver. It usually has no symptoms and does not progress to liver cancer. Most patients are adult women, with a prevalence of 2% to 20%. The cause of hepatic hemangioma formation is unknown. Liver hemangioma itself has many large and small lumens, and there are many blood vessels and blood in the lumen. Most show high brightness under ultrasound. But if the patient has moderate to severe fatty liver disease, the liver area will be brighter. In comparison, a hepatic hemangioma may look like a shadow.
· Radiofrequency Cauterization: Radiofrequency Cauterization is a treatment method for liver cancer that uses a probe to introduce high-frequency current into tumor tissue, causing molecular vibration and friction to generate heat. When the temperature reaches 50-100°C, the oncoproteins in tumor cells will coagulate and become necrotic. Burn marks will be left after surgery.
· Liver Abscess: A liver abscess is pus in the liver. In the past, amoebic liver abscesses caused by amoeba invasion were most common due to poor hygiene. In recent years, bacterial liver abscess has become a leading cause. Bacterial liver abscesses can be caused by many different bacteria, the most common of which is Klebsiella spp. Ultrasound images of liver abscess are generally round, dark, and have clear borders. Most cases involve a single abscess, but in rare cases multiple abscesses may occur.
· Tumors: In addition to benign tumors, there are some shadows caused by malignant tumors, including primary hepatocellular carcinoma or intrahepatic cholangiocarcinoma that grows from the bile ducts of the liver. Small liver cancer will appear hypoechoic under ultrasound. Darker color. As the tumor grows larger, it may cause bleeding or lobulation, resulting in uneven, complex echoes on ultrasound images.
· Metastatic Cancer: Tumors that metastasize from other organs are called metastatic liver cancer. For example, cancer cells such as breast, stomach or colorectal cancer have metastasized to the liver. Ultrasound images of metastatic cancer are different from those of primary cancer. Metastatic cancer is strongly suspected if an area of image with bright center and darker surroundings is found on an ultrasound image. Liver metastasis cancer mainly comes from lung cancer, colorectal cancer, lymphoma, etc.
Ultrasonic images reflect the propagation speed of the medium with gray-scale image brightness, and the gray-scale image brightness changes according to the density of the medium. In people with moderate or severe fatty liver disease, the ultrasound image will be brighter due to the proportion of fat in the organ, while a normal liver will be darker. If a normal liver is surrounded by fatty liver, a dark shadowed area (hypoechoic) will appear. This dark shadow is the local fat- free area. Another situation is that the background is a normal liver, and the image is dark, but a certain area appears particularly bright, like a white shadow. This condition is called localized fat accumulation. Powers & Kremkau (2011), Rumack & Levine (2023)
In recent years, artificial intelligence deep learning has flourished. Computer vision can create each object in an image and identify the type of object. This technology is called object detection. Applying this technology to ultrasound medical imaging can help doctors interpret image content and discover organs or abnormal tissue areas in the body, simplifying the diagnosis and treatment process. In the future, if ultrasound equipment is popularized and become home medical equipment such as thermometers and sphygmomanometers, non-medical professional users can also simply perform self-examination and detect physical abnormalities in time for early medical treatment.
2. MEDICAL ULTRASOUND IMAGING
On average, the human ear can hear sounds with frequencies between 16Hz and 20KHz. Sound waves that are too high in frequency to be heard by the human ear are defined as ultrasonic waves. Ultrasound waves can travel through vibrations in air, liquids or solids. Generally divided into destructive ultrasound and non-destructive ultrasound.
When ultrasonic waves are vertically incident from medium 1 (density ρ1, sound speed c1) to medium 2 (density ρ2, sound speed c2), the reflectivity R and transmittance T of the sound pressure are determined by the density ρ and sound speed c of the medium. This product is called the natural acoustic impedance and is defined as follows:
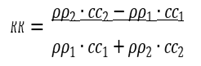 (1)
(1)
![]() (2)
(2)
Ultrasound waves pass through a medium or tissue that can conduct sound waves. When they encounter tissue interfaces of different densities, some of the energy is reflected back. The reflected acoustic energy is then received by the probe's piezoelectric crystal and converted into electrical energy. The signal is then converted into a grayscale image and presented on the screen. The frequency of clinical ultrasound is generally between 2MHz and 30MHz. If the influence of bubbles or bones is not considered, the transmission speed between human soft tissues is approximately c=1540 m/s. The Table 1 lists the speed of sound waves in different media. Wells (2006), Chan & Perlas (2011)
Table 1
|
Table 1 The Speed of Sound Waves
in Different Media |
|
|
Materials |
Speed of Sound (m/s) |
|
Air |
330 |
|
Water |
1480 |
|
Fat |
1450 |
|
Blood |
1560 |
|
Muscle |
1600 |
|
Skull Bone |
4080 |
|
Soft Tissue |
1540 |
|
Lung |
600 |
|
Liver |
1555 |
|
Kidney |
1565 |
|
Myocardial |
1550 |
3. COMPUTER VISION OBJECT DETECTION
Convolutional neural networks (CNN) can quickly distinguish image content to complete classification tasks. This technique is applied to object detection, using sliding windows or region proposal methods to classify the content of image sub-regions. If the content matches the target content, find the location of the target object in the image. Otherwise, the image does not contain the target object. This two-stage approach requires multiple CNN operations and more computing resources and time. Therefore, this article uses the one-stage YOLO method to shorten the calculation time of object detection and achieve instant response. Zou et al. (2023), Gupta Zou et al. (2020)
YOLO (You Only Look Once) is a one-stage object detection method by anchor-base detector. Input an image and the output is N Bounding Boxes. The data format is [x,y,w,h,l]. N is the number of detected objects in the image. [x, y] is the position of the object in the image, [w, h] is the relative ratio of the object to the image size, and l is the classification number of the object. Jiang et al. (2022), Shafiee et al. (2017)
Comparison with two-stage detector. In the Two-Stage network structure, the feature map uses the Region Proposal Network (RPN) to predict the coordinates, length, and width of the Bounding Box, and then the original feature map is sent to the neural network again to calculate the object label. Since object area detection and object classification are performed in two steps, they are called two stages. In contrast, One-Stage Detector omits RPN and directly uses feature maps to calculate Bounding Box and object labels. Compared with Two-Stage, One-Stage reduces the amount of calculation and increases the speed, but the accuracy will also be reduced to a certain extent.
Structurally, the YOLO model consists of the following parts:
· Input: the data matrix of pre-processed image
· Backbone: Input matrix perform convolution operations to calculate feature encoding.
· Neck: another part of the model that handles feature encoding
· Head(s): The output layer that produces model predictions.
After several versions of improvements, YOLOv4 uses the CSPDarknet53 network as the backbone network. Using cross-stage partial connections, the number of neural network layers remains unchanged and detailed image features are preserved, while self-adversarial training (SAT) is applied to improve the model's robustness and generalization ability. Jiang et al. (2020)
4. EXPERIMENTAL RESULTS
Data labeling is an important step in deep learning data processing. This experiment uses the LabelMe software developed by MIT Computer Science and Artificial Intelligence Laboratory (CSAIL) for data labeling. LabelMe provides a graphical interface to facilitate users to label with shapes such as rectangles, circles, or polygons. Location and classification of objects on images. Torralba et al. (2010)
After all the data is marked in the graphical interface, LabelMe will store the object category and the coordinates of the outer frame boundary points in Extensible Markup Language (XML). After processing and converting it into the data format required by the YOLO model, machine learning can begin.
Although more training data can improve the accuracy of the model, it will also increase the time required for machine learning. This experiment was conducted through repeated training, gradually increasing the number of data in categories with high error rates and then training again. Through continuous Training and correction to improve the recognition rate of the model.
After three stages of training, the amount of training data used is shown in Table 2. The detection accuracy of each stage is shown in Figure 1. After the first stage of training, the accuracy of YOLO model in detecting abscess has reached the expected target. It is not necessary to add more training data. After adding training data for the remaining three categories, the second training was performed. It was obviously found that the accuracy rate was improved. However, there is still room for improvement in detecting hemangioma and HCC. Therefore, after adding more training data for the third stage of training, the accuracy rate was It can reach more than 98%.
Table 2
|
Table 2 The Number of Training Data Used in the Three Stages |
|||
|
|
Stage1 |
Stage2 |
Stage3 |
|
Hepatocellular Carcinoma |
479 |
683 |
779 |
|
Hemangioma |
530 |
627 |
627 |
|
Radiofrequency |
230 |
374 |
486 |
|
Liver Abscess |
99 |
99 |
99 |
Figure 1

|
Figure 1 Detection Accuracy of Each Object After Three Trainings |
The trained YOLO model can instantly detect lesions on liver ultrasound images. As shown in Figure 2, a black shadow area is found in the liver. The shadow area is marked and identified as possible HCC.
Figure 2

|
Figure
2 Location of HCC Detected on
Liver Ultrasound Image |
5. CONCLUSIONS
In recent years, with the rapid development of science and technology, smart medical care, which integrates information technology, data analysis, artificial intelligence and other technologies, has become an important innovative concept in the medical field. Through artificial intelligence and deep learning, object detection technology can help doctors interpret medical images faster and more accurately, which can effectively improve medical efficiency and reduce medical manpower.
The liver ultrasound lesion detection proposed in this article is fast and highly accurate, showing that under reasonable restrictions, artificial intelligence can also have professional medical diagnosis capabilities. Using different training data, AI can learn to distinguish diverse lesions in the human body. The detection capability can not only be used as a medical auxiliary system, but even after the popularization of ultrasound equipment into home medical equipment, ordinary people can also conduct self-health examinations at home to achieve early detection and early treatment.
CONFLICT OF INTERESTS
None.
ACKNOWLEDGMENTS
None.
REFERENCES
Chan, V., & Perlas, A. (2011). Basics of Ultrasound Imaging. Atlas of Ultrasound-Guided Procedures in Interventional Pain Management, 13-19. https://doi.org/10.1007/978-1-4419-1681-5_2
Gupta, A. K., Seal, A., Prasad, M., & Khanna, P. (2020). Salient Object Detection Techniques in Computer Vision - A Survey. Entropy, 22(10). https://doi.org/10.3390/e22101174
Jiang, P., Ergu, D., Liu, F., Cai, Y., & Ma, B. (2022). A Review of Yolo Algorithm Developments. Procedia Computer Science, 199, 1066-1073. https://doi.org/10.1016/j.procs.2022.01.135
Jiang, Z., Zhao, L., Li, S., & Jia, Y. (2020). Real-Time Object Detection Method Based on Improved YOLOv4-tiny. https://doi.org/10.48550/arXiv.2011.04244
Powers, J., & Kremkau, F. (2011). Medical Ultrasound Systems. Interface Focus, 1(4), 477-489. https://doi.org/10.1098/rsfs.2011.0027
Rumack, C. M., & Levine, D. (2023). Diagnostic Ultrasound. Elsevier Health Sciences.
Shafiee, M. J., Chywl, B., Li, F., & Wong, A. (2017). Fast YOLO: A Fast You Only Look Once System for Real-Time Embedded Object Detection in Video.
Torralba, A., Russell, B. C., & Yuen, J. (2010). Labelme: Online Image Annotation and Applications. Proceedings of the IEEE, 98(8), 1467-1484.
Wells, P. N. (2006). Ultrasound Imaging. Physics in Medicine & Biology, 51(13), R83. https://doi.org/10.1088/0031-9155/51/13/R06
Williams, R. (2006). Global Challenges in Liver Disease. Hepatology, 44(3), 521-526. https://doi.org/10.1002/hep.21347
Zou, Z., Chen, K., Shi, Z., Guo, Y., & Ye, J. (2023). Object Detection in 20 Years: A Survey. Proceedings of the IEEE, 111(3), 257-276. https://doi.org/10.1109/JPROC.2023.3238524
|
|
 This work is licensed under a: Creative Commons Attribution 4.0 International License
© IJETMR 2014-2024. All Rights Reserved.