
|
|
|
|
Physicochemical and functional properties of starches of flour of Cycas fruits or “Ntsambu” from Comoros
Ibrahim Said Ali 1![]() , Ismael Chakir 2
, Ismael Chakir 2![]() , Anli Mohamed 2
, Anli Mohamed 2![]() , Louisette Razanamparany 3
, Louisette Razanamparany 3![]()
1 Patsy University Center - University of
the Comoros. Patsy- Anjouan – Comoros, Laboratory of Applied Biochemistry in
Food Sciences and Nutrition (LABASAN), Faculty of Sciences, University of
Antananarivo, Madagascar, Food, Reactivity and Synthesis of Natural Substances
Laboratory (LAR2SN) – Faculty of Science and Technology (FST) - University of
the Comoros, Comoros
2 Laboratory of Applied Biochemistry in
Food Sciences and Nutrition (LABASAN), Faculty of Sciences, University of
Antananarivo, Madagascar
3 Laboratory of Applied Biochemistry in
Food Sciences and Nutrition (LABASAN), Faculty of Sciences, University of
Antananarivo, Madagascarj
|
|
|
ABSTRACT |
|
|
Cycads are archaic gymnosperms whose ovules provide almonds, highly valued in the diet by the ancestral populations of the Comoros. These almonds are essentially made up of 72% starch for 100 g of dry flour. Cycas fruit starches of comoros present appreciable physicochemical and functional properties. These starches are more digestible by α amylase compared to other flours such as potato flours. However, a significant fraction of resistant starch is present. The average amylose content (14% to 20%) suggests that these flours can be used in various cooking methods, such as for the production of porridges, cakes and for infant food. Their gelatinization temperature is between 73.5°C and 86.9°C. The
reintegration of these fruits into the eating habits of the Comorians should
contribute to limiting food security problems and thus promote a
reappropriation of this resource by the Comorians and therefore preserve
these Cycas unexploited or neglected by a large part of the Comorian
population. |
|||
|
Received 05 June 2024 Accepted 10 July 2024 Published 15 August 2024 Corresponding Author Ibrahim
Said Ali, ibrahimsaidali@yahoo.fr DOI 10.29121/ijetmr.v11.i8.2024.1456
Funding: This research
received no specific grant from any funding agency in the public, commercial,
or not-for-profit sectors. Copyright: © 2024 The
Author(s). This work is licensed under a Creative Commons
Attribution 4.0 International License. With the
license CC-BY, authors retain the copyright, allowing anyone to download,
reuse, re-print, modify, distribute, and/or copy their contribution. The work
must be properly attributed to its author.
|
|||
|
Keywords: Comoros Cycas,
Ntsambu, Almonds, Starch, Amylose, Gelatinization |
|||


1. INTRODUCTION
Many plants of tropical origin such as roots, tubers, fruits or seeds are rich in starch. These plant productions are often of primordial importance for local populations because they constitute their basis of diet Delpeuch et al. (1978) , Delpeuch & Favief (1979) . By way of illustration, the dietary importance of potatoes, cassava, bananas, sweet potatoes, yams and many others, no longer needs to be demonstrated. Among these starchy resources, many are only known by a minority of producer-consumers who use them just for family self-consumption.
If the scientific literature echoes multiple scientific studies on starchy resources produced and consumed locally in Africa, Asia, Latin America or Europe, particularly concerning yams or Dioscorea Guilbot (1964), Razanamparany et al. (2003), dessert bananas or plantains or Musa sp Gibert et al. (2009), breadfruit or Artocarpus sp Ragone et al. (2006), Leterme et al. (2006), Toilibou. (2019), sweet potato or Ipomea patatas, cassava or Manihot esculenta, rice or Oriza Thierry et al. (2007) and many other starchy plants Holm et al. (1985), Goni et.al. (1996), many species have never made the object of scientific study capable of evaluating their functional properties in relation to their uses. This is the case of the fruits or ovules of Cycas, an ancestral gymnosperm well known in the Comoros for its nutritional values.
These fruits, locally known as “NTSAMBU” provide starchy almonds. If Cycads are better known worldwide for their ornamental use, in the Comoros they are also cultivated for food purposes. In fact, their eggs provide almonds rich in starch, well appreciated in the diet of the Comorian population Ali & I.S. (2014), Ali et al. (2014).
In order to acquire data likely to help promote food or non-food uses of Comoros Cycas fruit starches, a study intended to characterize their physicochemical and functional properties was conducted.
Acquiring original data is very important because of the potential diversity of uses of starches. Given the structural complexity of the starch granule, many parameters contribute to confer specific properties that must be tried to understand. For example, knowing and controlling the digestibility of a starch requires the implementation of an appropriate heat treatment. It is possible to understand the impact of the process on quality by evaluating the physicochemical properties of starches Favier et al. (1995) . Also, in order to understand the behavior of starch during cooking, it is desirable to study its chemical composition (including its amylose content), to evaluate its structure, but also its swelling and solubilization properties.
After evaluating the nutritional quality of Cycas fruits Ali & I.S. (2014), the evaluation of the physicochemical and functional properties of their starches through the study of the starch and amylose content, the resistance of starch during enzymatic hydrolysis (digestibility) and its rheological properties, proves essential.
2. MATERIAL AND METHODS
2.1. Study Material
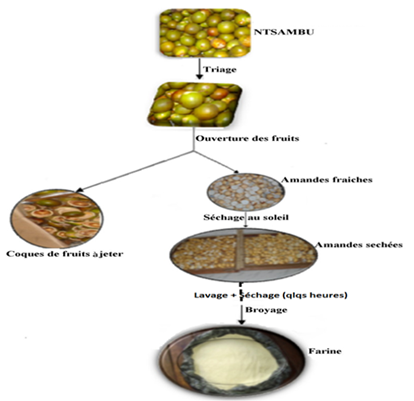
The plant material used in this study consists of six samples of Cycas fruit flour, collected from the sites illustrated in Table 1. The flour was obtained by simply grinding dried Ntsambu almonds. It was then subjected to fractionation by sieving using sieves with mesh sizes of 500 µm in diameter. The flour production steps are illustrated in Figure 1. Six flour samples were analysed. The chemicals used during the chemical analyses were all of “analytical” quality.
Table 1
|
Table 1 Geographic Origin of Cycas Fruit Samples
Collected and Analysed |
||
|
Harvest
location * |
Altitude (m) GPS coordinates |
|
|
F.OIC |
Koimbani- Oichili 1 |
339 11°37’ S 43° 22 E |
|
F.MBN |
Mbéni 1 |
165 11°30’ S 43° 23 E |
|
F.SAL |
Salimani 1 |
320 11°41’ S 43° 16 E |
|
F.MOH |
Mohoro 1 |
500 11°49’ S 43° 26 E |
|
F.SEL |
Séléa 1 |
80 11°40 S 43° 16E |
|
F.TSE |
Tsémbéhou 2 |
770 12°12’ S 44° 28E |
|
(*) 1 : Grande Comore Island, 2 : Anjouan Island |
||
Figure 1
|
Figure
1 Different Stages of Flour
Production from Fruits or Ovules of Cycas “Ntsambu” Source Ali (2014) |
2.2. Analysis methods
Different analyses were carried out on flour samples following very specific methods.
2.2.1. Determination of starch content in Cycas fruit flours
The total quantity of starch present is measured in the plant material after 2 successive hydrolysis (α-amylase and amyloglucosidase), according to the method of Holm et al. (1986)
1) Principle
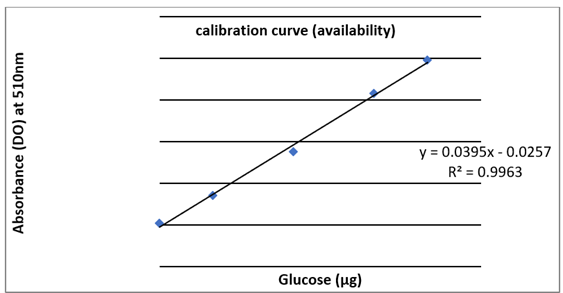
Starch is a homogeneous polymer made up of α-glucose units. The amount of glucose present in a starchy product will be proportional to the amount of starch present. The method consists of gelatinizing excess starch in boiling water in the presence of a heat-resistant α-amylase, Termamyl 120 L (Novo Nordisk, Copenhagen, Denmark) and amylo-glucosidase (Sigma, St. Louis, MO, United States). After incubation of the preparation with the enzymatic cocktail, the starch is hydrolyzed into D-glucose units, the starch level is calculated according to the quantity of glucose measured by colorimetric enzymatic method with the enzyme glucose oxidase and peroxidase (GOD and POD Sigma, St. Louis, MO, USA). Free glucose is estimated separately by treatment of flour with sulfuric acid and amylo-glucosidase by spectrophotometry at 510 nm. The starch content is calculated by the difference between the two estimates of D-glucose Trinder. (1969).
The analysis of the optical densities (OD) obtained makes it possible to determine the starch content, by referring to the calibration curve, OD = f (glucose).
2.2.2. Digestibility of starch in Ntsambu flours
Digestible starch is defined as the quantity of starch that can be degraded by digestive enzymes and non-or partially hydrolyzed starch constitutes resistant starch. Indeed, some starches only partially resist the hydrolysis process while others are completely indigestible Delpeuch et al. (1978). The digestibility of Cycas fruit starch is studied following the method of Holm et al. (1985).
1) Principle
Starch is digested in vivo by digestive enzymes. The sensitivity of a starch to α-amylase degradation in vitro must be related to its digestibility in vivo Miller & G. L. (1959), Aumaitre et al. (1969). After digestion by pancreatic α-amylases, the cooked starch is in the form of maltose and the quantity of maltose appeared depends on the total starch content. The digestibility of starch can thus be estimated in vitro and the quantity of maltose measured made it possible to deduce the rate of hydrolyzed starch while considering that the hydrolyzable starch is released in the form of 95% maltose.
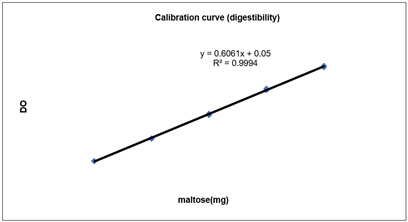
Referring to the calibration curve, DO = f (maltose), the optical densities obtained make it possible to monitor the digestibility of the starch available in the flours which translates into the level of maltose appearing in the medium.
2.2.3. Starch gelatinization
1) Definition
Starch is a carbohydrate macromolecule made up of two glucose polymers: amylose and amylopectin Buléon et al. (1998). It is insoluble in its native granular form. During heating in the presence of excess water, the starch granules hydrate, swell and burst, thus releasing a mainly amylosic fraction. The molecules are then rather soluble in water and develop a significant viscosity, resulting in homogeneous solutions or gels whose properties are linked to the starch concentration. The different phases linked to the irreversible change of state of starch granules upon sufficient heating in excess of water constitute the phenomenon of gelatinization. In food applications, gelatinization occurs during cooking of starchy resources Chung et al. (2006).
Gelatinized starch occurs in various amorphous forms in food products such as rice, pasta, potatoes, or in more elaborate products such as bread, pastries, sauces and desserts. In industry, gelatinized starch is used in the composition of many products and processes used in the paper industry, coatings, textiles, adhesives, pharmaceutical products and for water treatment as a flocculating agent.
2) Characterization of starch gelatinization: the viscoamylograph
In order to characterize the functional properties of a starch sample, a simple test consists of simulating its behavior during gelatinization and gelation during a temperature profile (heating-holding-cooling) in thermo-hydric conditions and under controlled mechanical shear stresses. To compare samples, a standardized temperature profile is generally used at constant dry matter content (or constant starch content). The viscoamylographic profile is developed to characterize the functional properties of starches under mechanical stress and at constant concentration in order to obtain a “fingerprint” of the specific viscosity properties of a starch. Two common types of visco-amylographs have been on the market for a long time: the Brabender and the Rapid Visco-Analyzer or RVA. Brabender is an older version requiring a larger quantity of starch (20-40g) and therefore a longer cooking time (1 hour). The Visco-Analyzer (RVA) is more frequently used and requires only 3 to 5 g of starch and approximately 15 minutes to produce a profile Tako & Hizukuri (2000)
· Principle
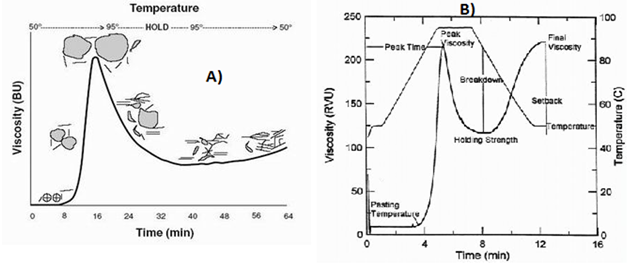
The principle of the method consists of gelatinizing a fixed quantity of starch under controlled conditions including an exact ratio of starch/water, a standardized temperature profile (heating from 50 to 95°C, maintaining and cooling at 50°C in general), and a constant shear speed (generally 75 and 160 rpm respectively for the Brabender and the RVA). The viscosity of the dispersion is measured based on the force required to maintain a constant shear stress and rate, and is expressed in arbitrary viscosity units (BU or RVU), or in centipoise equivalents (cP or mPa.s). Figure 2 (A and B) illustrates the effects on the starch profile when measuring with Brabender or RVA, and the parameters relating to changes in viscosity, at a specific time or temperature. Figure 2 (A) illustrates the changes within the starch granules during gelatinization: during initial hydration, the granules swell (we speak of starching), which induces an increase in friction in the dispersion and viscosity. When the temperature increases and the quantity of water absorbed increases, under the combined effect of temperature, constant shear and excess water, the crystalline parts of the granules melt, which promotes greater hydration. advancement of amylopectin molecules. This phenomenon then results in additional swelling of the granules and consequently, increased viscosity. When the granules have reached a critical size, under the effect of pressure, the grains burst, inducing a release of amylose and a significant reduction in friction inducing a reduction in viscosity under stress. During cooling, a more or less rapid structural reorganization of the starch takes place (retrogradation) and/or the formation of amylose-lipid complexes if lipids are present in the suspension, which induces an increase in viscosity Farhat et al. (2000), Thierry et al. (2007).
Figure 2
|
Figure
2 Visocoamylographic Profile of
Starch with Brabender (A) and RVA (B) Under Constant Speed Stirring (75 And
160 Rpm, Respectively, According to the Device Instruction Manuals). |
Visocoamylographic profile of starch with Brabender (A) and RVA (B) under constant speed stirring (75 and 160 rpm, respectively, according to the device instruction manuals).
At the end of the manipulation, parameters such as PV (maximum hot viscosity), HPV (minimum hot viscosity), CA (time required to reach PV from PT), PT (starching temperature), BD (PV-HPV breakdown), CPV (final viscosity), SB (Setback CPV-PV) and CS (CPV-HPV) were estimated for each sample.
3) Characterization
of starch gelatinization by DSC
· Principle of differential enthalpy analysis Kalichevsky et al. (1992), Goni et al. (1996), Goodfellow et al. (1990)
The change in the irreversible state occurring during the gelatinization of the starch is accompanied by energy consumption (endotherm) which can be measured by differential enthalpy analysis. DSC is a versatile technique capable of measuring most transitions affecting starch. DSC is used to detect complex formation, first order transition (melting) or second order transitions such as glass transition (Tg). For example, we can quantify the transitions of starch from a crystalline form to an amorphous form, during which heat is either absorbed or released. The energy absorbed or released by the sample during the phase change can be measured by DSC in power compensation as the energy required to maintain an identical temperature of the sample relative to the reference during heating or cooling at constant heating rate. To characterize the thermal properties of starches by DSC, micro-capsules with a capacity of less than 100 µL and which can withstand pressures greater than 10 bar are commonly used. If the crimped capsule containing the sample is conditioned to a specific water content, the reference capsule is generally crimped empty. The width and number of peaks observed on the endotherms can sometimes be linked to the distribution of the size of the starch granules, to the degree of progress of gelatinization, but also to the water content (sufficient quantity of water or excess water). The peak area is calculated by integrating the specific heat capacity Cp (J/kg.K) over a temperature interval. Cp is obtained by the ratio of the heat flux (mW) divided by the fraction (heating rate in °K/s relative to the mass of the test sample in mg). The integration of the Cp dT over the temperature interval gives the enthalpy variation (ΔH) in J/g linked to gelatinization. Starches with high amylose content may exhibit higher enthalpies of gelatinization.
The methodology used is that reported by Thierry et al. (2007). The analyzes are carried out on a Perkin-Elmer DSC 7 operating according to the power compensation principle (Perkin-Elmer, Norwalk) using stainless steel capsules. The minimum (Onset), terminal (End °C) and peak (Peak °C) temperatures are recorded during gelatinization. After measuring the endotherm linked to gelatinization in duplicate, the ΔH of the native starches are calculated and averaged.
4) Determination
of amylose content
The amylose content of starches can be estimated by the DSC method by evaluating the enthalpy variation linked to the fusion of the complexes formed between amylose and purified phospholipids, during cooling of the sample. This methodology is generally more reproducible and quicker to implement than colorimetric analysis. Depending on the conformation of the amylopectin and in the case of the presence of intermediate material in the supramolecular structure of the starch, divergences in amylose contents can be observed between the DSC method and the colorimetric method. The methodology followed is identical to that described previously although it involves the use of a 2% solution of phospholipids (w/v in distilled water) instead of pure distilled water. The amylose content is estimated by evaluating the enthalpy variation of the amylose-lipid complex compared to that of a standard potato solution containing 100% amylose (Avébé, Holland). The analysis is carried out in duplicate and the average amylose content estimated as follows:
%amylose=ΔH/(ΔH°) ×100
With ΔH and ΔH°, the respective enthalpies of the sample and the potato amylose standard
3. RESULTS AND DISCUSSIONS
3.1. Starch content of flours
After obtaining an acceptable coefficient of determination for the standard range (Figure 3), the estimates of starch contents in Ntsambu flours were calculated and are reported in Table 2. They are expressed in g/100g of DM.
The flours analyzed have an average starch content of 72%, between 69 and 75% on a dry basis depending on the variety. These results corroborate those previously obtained from the same samples analyzed at the CNRE (National Center for Environmental Research) laboratory in Madagascar using a polarimetric method. This confirms that the Ntsambu, a starchy resource, has significant food potential to be exploited by local populations. Compared to other starchy resources, Ntsambu flours have a lower average starch content than those of plantains (86%) Gibert et al. (2009), than that of cassava (94%) Julie (2009) and that of red taro (94.3%) Delpeuch et al. (1978)
Figure 3
|
Figure
3 Calibration Curve of Optical
Densities Measured at 510 Nm as a Function of the Quantity of Glucose (µg). |
These results were also compared to those of the fruits of Bactris gasipaes or Colombian “Chontaduro”, which is a fruit of a false palm morphologically quite close to the fruit of Cycas. Ntsambu flours have a starch content equivalent to that of Bactris gasipaes fruits, estimated in the range of 67 to 71% on a dry basis Graefe et al. (2013), Leterme et al. (2006)
Table 2
|
Table 2 Starch Content in the Flours of the 6 Cycas Fruit
Samples |
||||||
|
Samples |
Optical Density (DO) |
Glucose (µg) |
% Starch |
Starch in % dry mass |
||
|
measured DO |
Corrected DO |
% Starch |
Average |
|||
|
Starch - std 1 |
0,2460 |
0,237 |
6,71 |
88,55 |
89,216 |
90% |
|
Starch - std 2 |
0,2500 |
0,241 |
6,82 |
89,88 |
||
|
F.OIC-1 |
0,2950 |
0,286 |
7,97 |
64,24 |
65,289 |
72,5 |
|
F.OIC-2 |
0,3050 |
0,296 |
8,23 |
66,34 |
||
|
F.MBN-1 |
0,2660 |
0,257 |
7,23 |
58,21 |
62,537 |
69,3 |
|
F.MBN-2 |
0,380 |
0,299 |
8,30 |
66,86 |
||
|
F.TSE-1 |
0,306 |
0,297 |
8,25 |
66,68 |
67,409 |
74,8 |
|
F.TSE-2 |
0,313 |
0,304 |
8,43 |
68,13 |
||
|
F.SAL-1 |
0,283 |
0,274 |
7,66 |
61,66 |
61,794 |
68,6 |
|
F.SAL-2 |
0,284 |
0,275 |
7,69 |
61,93 |
||
|
F.MOH-1 |
0,298 |
0,289 |
8,05 |
64,37 |
65,903 |
73,2 |
|
F.MOH-2 |
0,313 |
0,304 |
8,44 |
67,44 |
||
|
F.SEL-1 |
0,303 |
0,294 |
8,18 |
65,67 |
66,287 |
73,6 |
|
F.SEL-2 |
0,309 |
0,300 |
8,34 |
66,90 |
||
However, Cycas fruits also have the advantage of containing a significant lipid fraction.
The differences in starch content observed between Ntsambu flours (70% and 73%) seem to show the presence of two different varieties of Cycas thouarsii in the Comoros. Indeed, the starch content can be characteristic of a species or variety as reported by Delpeuch et al. (1978). F.MBN and F.SAL flours have an equivalent starch content of approximately 69%; subject to further confirmation, this could mean that these flours could come from two plants belonging to the same subspecies of Cycas thouarsii. The four other flours (F.SEL, F.MOH, F.OIC and F.TSE) whose starch content is approximately 73% are likely to come from plants belonging to another subspecies of C. thouarsii, given that these flours were obtained from fruits harvested in different regions. As indicated by Delpeuch et al. (1978), the starch content and the morphology of the starch grain are not influenced by the geographical origin of the plant.
3.2. Starch digestibility
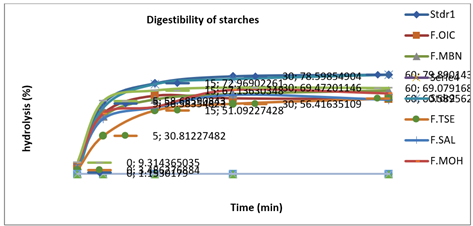
Starch digestibility measured by enzymatic hydrolysis was monitored for 60 minutes. The evolution of the hydrolyzed starch content as a function of time is reported in Table 3. After obtaining the calibration curve (Figure 4), the kinetics of the hydrolyzed starch contents over time is represented in Figure 5, for the different samples.
Table 3
|
Table 3 Rate of Starch
Hydrolyzed Over Time |
|||||
|
Sample/Time |
% hydrolyzed starch |
||||
|
|
0 min |
5 min |
15 min |
30 min |
60 min |
|
Pure starch |
1,15 |
56,58 |
72,97 |
78,60 |
79,89 |
|
Pure starch |
0,68 |
53,30 |
72,22 |
76,20 |
79,70 |
|
F.OIC (1) |
6,64 |
48,62 |
62,97 |
60,86 |
60,27 |
|
F.MBN (2) |
6,53 |
46,16 |
59,93 |
64,30 |
66,96 |
|
F.TSE (3) |
3,49 |
30,81 |
51,09 |
56,42 |
60,59 |
|
F.SAL (4) |
8,17 |
44,42 |
53,42 |
63,48 |
59,60 |
|
F.MOH (5) |
8,38 |
48,45 |
53,95 |
67,59 |
64,81 |
|
F.SEL (6) |
9,31 |
58,69 |
67,14 |
69,47 |
69,08 |
Figure 4
|
Figure
4 Calibration Curve of the Evolution
of Optical Densities at 530 Nm as a Function of the Quality of Maltose (Mg)
Present During Α-Amylase Digestion |
The variations in the rate of hydrolysis of Cycas fruit starches during the action of α-amylase illustrated in Figure 6, seem to indicate that after 20 minutes only the rate of hydrolysis of the starches of the F.SEL samples (69%) and F.OIC (67%) seems maximum. Conversely, if the maximum rate of hydrolysis seems to be reached only after 30 minutes for F.MOH (69.5%) and F.SAL (67%), the maximum rate of hydrolysis of the starches of samples F. TSE and F.MBN, respectively 61% and 68%, is only observed after approximately 60 minutes. Also, the latter 2 seem to have greater resistance to alpha-amylase attack than other varieties. If these starches come from the same plant species, their resistance to enzymatic attack varies from one sample to another. It is then possible to assume that in certain varieties the fraction of resistant starch is more or less important.
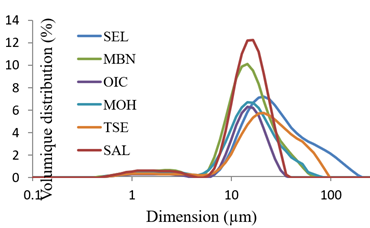
The six samples analysed do not currently make it possible to determine the origin of the differences in enzymatic susceptibility between varieties. However, it can be assumed that part of the differences in digestibility could be due to the fact that these starches belong to different subspecies or varieties, and/or to the fact that the samples have different geographical origins. Differences in susceptibility could have a physical origin, such as being due to granular encapsulations that protect grains from enzymatic attack or spatial conformations that are not conducive to the formation of complementary structures between enzymes and their starchy substrate. The variable resistance to α-amylase attack may also be due to the presence of starch grains of different sizes between varieties. Indeed, for smaller starch grains, the starch hydrolysis rate is generally higher. In order to confirm or refute this hypothesis, we tried to purify the starches of the varieties by successive washing/centrifuging from the different flours after having defatted them with hexane. If the starches appeared to be very white, suggesting a satisfactory level of purity, the particle size distributions by laser particle size analysis in the aqueous phase (using the Fraunhoffer approximation assuming opaque particles) with a Mastersizer 3000 (Malvern, Germany) with water-starch dispersions at an obscuration of approximately 2% do not clearly allow the size of the particles to be related to the percentage of starch hydrolysis, as illustrated in Figure 5. Indeed, despite great care taken in the purification starch, multimodal volume distributions were observed for the OIC, SEL, MOH and TSE samples with the presence of characteristic shoulders. Only the MBN and SAL samples presented a monomodal distribution (outside the fine) characteristic of ideally purified samples. They have respective volume average diameters of 7.52 and 8.37 (Dv10), 15.5 and 15.8 (Dv50) and 32.2 and 25.9 (Dv90).
Figure 5
|
Figure
5 Volumique Distribution of
Starch Grain Sizes of the Six Cycas Fruit Samples |
If the MBN and SAL fruit samples present a significant fraction of small grains and a small fraction of medium-sized grains (in the 20-40µm class), the MBN sample does have an average volume distribution greater than that of SAL, this which appears to be well in line with the trends in observed hydrolysis rates. The hypotheses could be the subject of further work by testing new methods of purifying Ntsambu flour for a more precise evaluation of the particle size distributions of these populations.
In addition, the physical properties of starch grains influence digestibility and processing ability. For example, the starch grains of certain varieties of taro are very small (around 3 to 5µm on average) or more than approximately 10 times smaller than those of the potato. If grain size improves the digestibility of taro starch, taro varieties seem all the more suitable for feeding infants and in the case of certain conditions (FAO, 1991).
In the Comoros, it would be particularly interesting to find new flours suitable to complement or replace existing flours for infant food. The flours currently available are excessively expensive and therefore inaccessible for most households. Also, the first results obtained in terms of digestibility and starch grain sizes call for more in-depth investigations on these Ntsambu flours.
By comparison with the hydrolysis of potato starch, taken here as a standard reference (Std 1 and Std 2), it seems that the kinetics of the digestion of Cycas fruit starches by α-amylase at 37 °C remains equal to that of potato starches. According to Figure 6, the maximum rate of digested starch for Cycas fruit flours varies from one sample to another and is between 61 and 70%, after 30 min. That of potato starch reaches 80% after 60 minutes of digestion. These results clearly illustrate that the starches of Ntsambu flours are likely to contain a significant fraction of resistant starch, greater than that of potatoes.
Figure 6
|
Figure
6 Variation in the Rate of
Hydrolyzed Starch as a Function of Time During the Digestibility of Ntsambu
Starches |
Variation in the rate of hydrolyzed starch as a function of time during the digestibility of Ntsambu starches
Indeed, the speed of digestion of a starch molecule can be compared to the structural complexity of the molecule (helical conformation of amylose, length of the branched chains of amylopectin) or to the reduced mobility of the chains which does not promote the fixation of enzymes for example. According to the literature, the fraction of resistant starch can be even higher as the amylose content is high, this is the case for rice or corn with a high amylose content, or native starches from banana or potato. Also, digestion can be even faster as the proportion of amylopectin is high. The subsequent results in terms of amylose contents should be able to provide additional elements to justify the α-amylase susceptibility of the starch contained in Cycas fruit flours
3.3. Functional parameters of Cycas flours at RVA
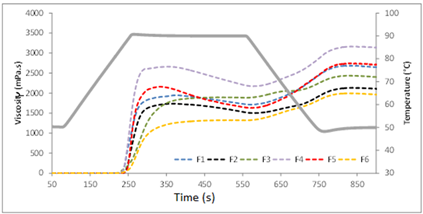
At a concentration in water of 12% flour, the RVA results obtained for the different Ntsambu flours are presented in Table 4 (for non-defatted flours) and Table 5 (for defatted flours). The viscoamylographic profile of the six non-defatted flours is illustrated in Figure 7.
Table 4
|
Table 4 Comparison of RVA Parameters for Non-Defatted
Flours of the 6 Varieties (*). |
||||||||
|
Samples |
PT |
PV |
CA |
HPV |
BD |
CPV |
SB |
CS |
|
F.OIC(F1) |
84.3ab |
1949ab |
143a |
1710a |
239ab |
2631a |
682ab |
921a |
|
F.MBN (2) |
86.1ab |
1740a |
128a |
1501b |
239ab |
2100bc |
361c |
600b |
|
F.TSE (F3) |
83.6a |
1897ab |
267b |
1785a |
112a |
2391ac |
494ac |
606b |
|
F.SAL(F4) |
84.5ab |
2664c |
123a |
2170c |
495bc |
3128d |
464ac |
959a |
|
F.MOH (5) |
86.8b |
2165b |
92a |
1628ab |
537c |
2702a |
538ab |
1074a |
|
F.SEL (F6) |
85.7ab |
1326d |
269b |
1273d |
54a |
1957b |
631ab |
685 b |
|
Average |
85.2 |
1957 |
170 |
1678 |
280 |
2485 |
528 |
807 |
(*) Means followed by an identical letter within the same column are not significantly different (p ≤0.01). With PT the starching temperature in °C, PV the peak viscosity in mPa.s, CA “cookability” in s (time difference between PT and PV, HPV the hot viscosity in mPa.s, BD = HPV- PV, CPV the final cold viscosity in mPa.s, SB = CPV- PV in mPa.s and CS = CPV- HPV in mPa.s.
Figure7
|
Figure
7 Viscoamylographic Profile of
the 6 Non-Defatted Flours at 12% MS |
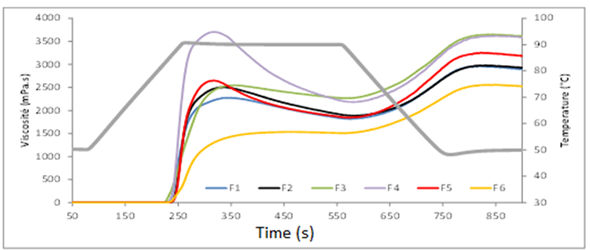
The average starching temperature (PT) of non-defatted flours seems quite high (around 85°C) as reported in Table 4 and Table 5. If the average starching temperature varies little with and without lipid extraction, only 2 samples of non-defatted flours (TSE and MOH) present PTs that are significantly different from each other, while the starching temperature becomes discriminating between varieties with defatted flours. Lipid extraction made it possible to obtain higher maximum hot viscosities (PV). On the other hand, the presence of lipids in flours makes it possible to obtain a much more discriminating PV criterion to differentiate between varieties. However, if the diversity of viscosity observed is significant, from simple to double from 1326 to 2664 mPa.s for non-defatted flours, the differences are even greater in the case of delipidated flours (from 1537 to 3707 mPa.s) which do not do not allow the varieties to be significantly differentiated from each other. A strong variability between repetitions of PV measurement was observed, which suggests that the presence of lipids probably complexed with starch favors obtaining more repeatable viscosity measurements.
It appears that Ntsambu starch has a good ability to form a gel at an average concentration and temperature. This could justify its use as a thickening agent, as is the case with starch extracted from the tubers of Tacca leontopetaloides in Chad Kunle et al. 2003, Whistler et al. 1992. In the Comoros, Tacca has the vernacular name of Ntrindi. This tuber whose starch is used in Chad for food purposes Collinlaw et al. (2009) and also used in the Comoros for feeding infants or producing a dessert. However, the viscosity reported in the case of Tacca seems higher (13.41 ± 4.69 Pa.s) with low concentrations (2.5%) of starch Collinlaw et al. (2009)compared to that of Ntsambu starch.
The diversity of viscoamylographic profiles between varieties illustrated in Figure 7 and Figure 8 is also highlighted by the significant differences observed in Table 4 and Table 5. The cooking ability (CA) criterion which makes it possible to differentiate between different banana genotypes Gibert et al. (2009), allows here to highlight the presence of 2 groups of varieties in the case of non-defatted flours. The extraction of lipids from flours allows for more marked discrimination of varieties into 4 groups. Only this temporal parameter CA was found to be higher in non-defatted flours (170 vs 123s) compared to defatted flours. We can assume that amylose-lipid complexes promote the thermal resistance of the matrix during gelatinization and then gelation. The other parameters linked to viscosity (PV, HPV, CPV) or a difference in viscosity (BD, SB, CS) gave a higher average in the case of extraction of lipids from flours. Despite differences between defatted and non-defatted flours, some samples present good mechanical resistance to shearing under stress with a slight decrease in breakdown viscosity (BD) such as F.TSE or F.SEL. Likewise, during cooling certain samples such as F.OIC and F. MB only show a very limited increase in Setback viscosity (SB), suggesting a fairly low retrogradation potential. A fortiori, the final viscosity of the delipidated F.SAL variety being lower than that hot (3576 vs 3707 mPa.s) i.e. a negative Setback (-131 mPa.s), this variety could easily be considered for use in the composition of cooked foods for which prolonged cold storage should not have a major impact on its organoleptic properties.
Table 5
|
Table 5 Comparison of RVA
Parameters for the Defatted Flours of the Six Samples (*). |
||||||||
|
Samples |
PT |
PV |
CA (s) |
HPV |
BD |
CPV |
SB |
CS |
|
F.OIC (F1) |
84.7a |
2277 |
111ab |
1816a |
461a |
2878ab |
601 |
1061a |
|
F.MBN(F2) |
86.2b |
2505 |
97ac |
1883a |
622ab |
2908a |
404 |
1025a |
|
F.TSE (F3) |
82.7c |
2548 |
136b |
2263b |
286a |
3604c |
1056 |
1341b |
|
F.SAL (F4) |
84.5a |
3707 |
85ac |
2181b |
1526c |
3576c |
-131 |
1395b |
|
F.MOH(F5) |
86.0b |
1574 |
80c |
1844a |
1208bc |
2512a |
1588 |
1317b |
|
F.SEL (F6) |
85.4ab |
1537 |
227d |
1454c |
83a |
3107b |
976 |
1058a |
|
Average |
84.9 |
2358 |
123 |
1907 |
697 |
3107 |
749 |
1200 |
(*) Means followed by an identical letter within the same column are not significantly different (p ≤0.01). With PT the starching temperature in °C, PV the peak viscosity in mPa.s, CA “cookability” in s (time difference between PT and PV, HPV the hot viscosity in mPa.s , BD = HPV- PV, CPV the final cold viscosity in mPa.s, SB = CPV- PV in mPa.s and CS = CPV- HPV in mPa.s.
Figure 8
|
Figure
8 Viscoamlyographic Profile of the
Six Defatted Flours at 12% Dry Mass |
Also, from a technological point of view, the functionalities highlighted on these few varieties (thermal resistant, resistant to hot shear stresses, low potential for retrogradation upon cooling, etc.) could be exploited variously for food formulations, in preparations at medium temperatures, for conveying using peristaltic pumps or for the formulation of cold preparations after gelatinization and gelling of the starch. The gelling properties of Cycas could then be the subject of additional studies for formulation in mixtures with controlled starch conversion rates. As a gelling agent, as is the case in the formulation of certain food products, these starches could be used interchangeably as various thickeners Kunle et al. (2003).
3.4. Analysis of flours by differential enthalpy analysis
The original thermal properties of the starches and the amylose contents corrected with the starch contents of Ntsambu flours can thus be evaluated by DSC.
1) Determination
of amyloses contents of Cycas fruits
The amylose contents of Ntsambu flours estimated by DSC are recorded in Table 6. Within the varieties, we were able to highlight the presence of variable amylose contents between varieties in the range of 13.8 to 19.7% of amylose per 100g of dry starch.
Table 6
|
Table 6 Determination of the Amylose Content of Flours
(*) |
|
|
Samples |
% Amylose |
|
F.OIC |
18,36a |
|
F.MBN |
16,18b |
|
F.TSE |
19,53a |
|
F.SAL |
16,37b |
|
F.MOH |
13,76c |
|
F.SEL |
19,69a |
(*) Averages expressed in g/100g of dry starch. These means followed by an identical letter are not significantly different (p ≤0.01).
This is how the F.OIC, F.TSE and F.SEL samples have significantly higher amylose contents (in the range of 18.36% to 19.69%) than the F. MBN and F.SAL samples. (16.18% and 16.37%, respectively), and a fortiori from the sample with low amylose content F.MOH (13.76%). These results were compared to those obtained with starches from other tropical food plants Delpeuch et al. (1978). Among these starches, yams (Dioscorea dumetorum) gave a lower amylose content (10%) than Ntsambu flours. On the other hand, in other yam accessions (D. librechiana, D. revoluta and others not specified), the amylose contents reported are sometimes significantly higher (34.5%), or close (19% to 23%). than those of Cycas fruits Delpeuch et al. (1978). Ntsambu flours also have amylose contents close to those of certain varieties of sweet potato (17% to 18%) and those of two varieties of cassava (17%) studied by Delpeuch et al (1978). On the other hand, in the case of starch from the “ex Bafut” variety of taro, a significantly lower amylose content has been reported compared to other varieties of the same species (9.5% vs. 14% and 17%). In breadfruit fruits, extremely variable amylose contents from 9% to 22% for starches of Artocarpus communis apirena and Artocarpus communis seminifera have been reported.
Cycas fruit starches therefore have an average amylose content equivalent to that of starches from many other tropical starchy resources. If the amylose content can be variable, it varies from one species to another, within the same species, and can also vary from one variety to another as we were able to observe in our samples. . This average amylose content can fully justify the α-amylase susceptibility of the starch contained in Cycas flours as described previously. With rapid and more or less significant digestion of the starch observed, the amylopectic fraction represents here more than 80% within the starches. The flours analyzed could probably be used for infant food.
2) Gelatinization
of Cycas fruit flours
The results of characterization of the thermal properties of the 6 Ntsambu flours are reported in Table 7. These results illustrate the diversity of thermal resistances (Onsets) of these flours whose average Onset is located at 74.8°C and which varies in the interval from 73.5 to 76.7 °C for F.TSE and F.MBN respectively. The differences in Onsets between samples should be compared to the differences in starching temperature (PT) that could have been observed between varieties even if they do not describe exactly the same phenomena occurring during the gelatinization of starch. If the variations in peak temperature (Pic) and end temperature (End) of Ntsambu flours do not make it possible to highlight any difference between samples, the average temperature interval measured in DSC for the phenomenon linked to gelatinization is of the order of 10°C for each variety, as for many other starchy resources.
Table 7
|
Table 7 Average Gelatinization Temperatures, Peak Area
and Enthalpy of Ntsambu Flours Measured by DSC |
||||
|
Samples |
Onset (°C) |
Pic (°C) |
End (°C) |
DH (J/g) |
|
F.OIC |
73.76ab |
78.33 |
84.05 |
17.55 |
|
F.MBN |
76.68c |
81.25 |
87.36 |
16.56 |
|
F.TSE |
73.50a |
78.09 |
84.58 |
17.15 |
|
F.SAL |
74.05ab |
79 |
85.7 |
16.67 |
|
F.MOH |
76.37bc |
81.17 |
86.83 |
17.04 |
|
F.SEL |
74.37abc |
78.75 |
85.61 |
18.28 |
|
Average |
74.79 |
79.43 |
85.69 |
17.21 |
(*) Means followed by an identical letter within the same column are not significantly different (p ≤0.01).
The extreme temperature range of 73.8 to 87.4°C linked to the gelatinization of the starch of these flours could, among other things, be explained by their average amylose content Attama et al. (1999), Ndouyang et al. (2009). The average peak temperature is around 79°C and varies in the range from approximately 78.3°C to 81.2°C. The final temperature varies from approximately 84 to 87°C with an average of around 85.7°C. These data are similar to those obtained with Tacca starches from Chad or Cii whose temperature Onset varies from 73.8°C to 78.3°C Collinlaw et al. (2009).
The enthalpy variation linked to the gelatinization phenomenon (H) varies in the range from 15.17 to 18.8 J/g with an average of 17.2 J/g for Ntsambu flours. By comparison, Cii flour presents an enthalpy variation of around 8.3 J/g, according to Collinlaw et al. (2009). Manek et al. (2005), the low enthalpy variations observed on Cii flour suggest that the bonding forces stabilizing the structure of the granules in this starch are weaker than those of corn starch granules whose H is approximately 7.01 J. g-1 Gray. (2003), Jbilou (2011)It could therefore be assumed that the bonding forces between granules of Ntsambu could be greater than those of Cii.
For yam flours (Dioscorea dumetorum), Medoua et al. (2005) reported temperature onsets between 70°C and 75°C with an amylose content varying from 9.7% to 11.2% Njintang et al. (2003). The low Onset observed (52-65°C) for Tacca involucrata (Cii) starch could also be explained by its high amylose content of around 36% Attama et al. (1999)This amylose content could promote the phenomena of retrogradation of gelatinized starch during cooling and reinforce the resistant starch content Delpeuch et al. (1978). The starch amylose content of Cycas fruits, estimated at 14% to 20%, is much lower than that of Tacca involucrata starch; thus, a low rate of retrogradation can be assumed for “Ntsambu” starches from the Comoros. This could also explain the more fluid and non-sticky texture of Ntsambu flour porridges obtained after cooling, compared to the porridge produced from Tacca starch.
4. CONCLUSION
Comoros Cycas fruit starch presents appreciable physicochemical and functional properties. This study made it possible to specify some thermal and functional properties of fruit flour starches from Cycas thouarsii from the Comoros or Ntsambu. These flours have an average starch content of 72% on a dry basis. The study of digestibility showed that these flours are as digestible as many other flours such as potato flours only that Ntsambu flours present a significant fraction of resistant starch. The average amylose content (14% to 20%) suggests that these flours can be used in various cooking methods, such as for the production of porridges, cakes and for infant food. These flours have a temperature range linked to gelatinization of between 73.5°C and 86.9°C. These properties give Cycas fruit kernels interesting functional abilities which could be the subject of applications in the food industry, in particular the use of flours for the production of biscuits and various other types of cakes or in pharmacology, for use of starches from these fruits as a support and preservative for active molecules.
CONFLICT OF INTERESTS
None.
ACKNOWLEDGMENTS
None.
REFERENCES
Ali, I. S., Razanamparany, L., & Gibert, O. (2014). Les fruits de Cycas (Cycadacea) des Comores: Utilisation, Compositions Chimique et Nutritionnelle. Afrique Science, 10(2), 394-408. http://www.afriquescience.info
Ali, I.S. (2014). Valorisation Des Fruits de Cycas Thouarsii Dans l'Alimentation de la Population Comorienne (Thèse de Doctorat de Biochimie: Alimentation et Nutrition). Tananarive : Université d'Antananarivo, 141.
Attama, A. A., & Adikwu, M. U. (1999). The Physicochemical Properties of Starch Derived from Tacca Involucrata. Nig. J. Nat Prod. and Med, 3, 71-73. https://doi.org/10.4314/njnpm.v3i1.11766
Buléon, A., Colonna, P., Planchot, V., & Ball, S. (1998). Starch Granules: Structure and Biosynthesis. International Journal of Biological Macromolecules 23, 85-112. https://doi.org/10.1016/S0141-8130(98)00040-3
Chung, H. J., & Lim, S. T. (2006). Physical Aging of Amorphous Starches (a review). Starch/Stärke, 58, 599-610. https://doi.org/10.1002/star.200600547
Collinlaw, J. N., Aba Richard, E., Aboubakar, B., Facho, Y., Nicolas, N., Bouba, A. (2009). Propriétés Physico-Chimiques Et Fonctionnelles De Tacca Leontopetaloides (L) Kuntze, Tubercule Non Conventionnel. Revue de Génie Industriel, 3, 34-45.
Delpeuch, F., Favier, J. C.,
& Charbonnière, R. (1978). Caractéristiques Des
Amidons De Plantes Alimentaires Tropicales. Ann. Technol. Agric, 27(4),
809-826.
Farhat, I. A., Blanshard, J. M. V., & Mitchell,
J. R. (2000). The Retrogradation of Waxy Maize Starch Extrudates:
Effects of Storage Temperature and Water Content. Biopolymers, 53, 411-422. https://doi.org/10.1002/(SICI)1097-0282(20000415)53:5
Favier, J. C., Ireland-Ripert, J., Toque, C., & Feinberg, M. (1995). Répertoire Générale Des Aliments: Table de Composition, 2ème Ed: INRA. Paris: Londres-NY Lavoisier Tec.et Doc; 897.
Gibert, O., Dufour, D., Giraldo, A., Sanchez, T., Reynes, M., Pain, J.-P.,, Alonso, G., Fernandez, A., & Diaz, A. (2009). Differentiation between Cooking Bananas and Dessert Bananas. 1. Morphological and Compositional Characterization of Cultivated Colombian Musaceae (Musa sp) in Relation to Consumer Preferences. Journal Agriculture Food Chemistry, 57, 7857-7869. https://doi.org/10.1021/jf901788x
Goni, I., Garsia-Diz, L., Manas, E., & Saura-Calixto, F. (1996). Analysis of Resistant Starch: A Method for Foods and Food Products. Food Chemistry, 56(4), 445-449. https://doi.org/10.1016/0308-8146(95)00222-7
Goodfellow, B. J., & Wilson, R. H. (1990). A Fourier Transforms IR Study of the Gelation of Amylose and Amylopectin. Biopolymers, 30, 1183-1189. https://doi.org/10.1002/bip.360301304
Graefe, S., Dufour, D., Van Zonneveld, M., Rodriguez, F., & Gonzalez, A. (2013). Peach Palm (Bactris Gasipaes) in Tropical Latin America: Implications for Biodiversity Conservation, Natural Resource Management and Human Nutrition. Biodiversity and Conservation, 22(2), 269-300. https://doi.org/10.1007/s10531-012-0402-3
Gray, J. (2003). Sucres: Aspects Nutritionnels et Sante. International Life Sciences
Institute. French translation c 2005 International Life Sciences Institut, 36.
Guilbot (1964). Les Méthodes Biologiques de Contrôles Analytiques Dans Les Industries de Céréales : Mise au Point de Chimie Analytique, 12ème série. Paris: Masson, 2-40.
Holm, J., Bjôrck, I., Asp, N. G., Sjôberg, L. B., & Lundquist, I. (1985). Starch Availability in Vitro and in Vivo After Flaking, Steam-Cooking and Popping of Wheat. Journal of Cereal Science, 3, 193-206. https://doi.org/10.1016/S0733-5210(85)80013-8
Holm, J., Bjôrck, I., Drews, A.Y., & Asp, N.-G. (1986). A Rapid Method for the Analysis of Starch. Starch, 38, 224-226. https://doi.org/10.1002/star.19860380704
Jbilou, F. (2011). Elaboration de Matériaux à Base de Farine de Maïs: Évaluation et Compréhension Des Relations Entre Structure et Cinétique de Biodégradation [Thèse de doctorat de Génie Biologique]. Lyon: Université Lyon1, 184.
Kalichevsky, M. T., Jaroszkiewicz, E. M., Ablett, S., Blanshard, J. M. V., & Lillford, P. J. (1992). The Glass Transition of Amylopectin Measured by DSC, DMTA and NMR. Carbohydrate Polymers 18, 77-88. https://doi.org/10.1016/0144-8617(92)90129-E
Kunle, O., Yakubu, E. I., Emeje, M. O., & Sam, S. (2003). Extraction, Physicochemical and Compaction properties of Tacca Starch, a Potential Pharmaceutical Excipient. National Institute Pharmaceutical Research and Development (NIPRD), P.M.B. 21, Abuja. Starch 55(7), 319-325. https://doi.org/10.1002/star.200390067
Leterme, P., Andrès, B., Fernando, E., & Angela, M. L. (2006). Mineral Content of Tropical Fruits and Unconventional Foods of the Andes and the Rain Forest of Colombia. Food Chemistry, 95, 644-652. https://doi.org/10.1016/j.foodchem.2005.02.003
Manek, R. V., Kunle, O. O., Emeje, M. O., & Builders, P. (2005). Thermal and Sorption Profile of Starch Obtained from Tacca leontopetaloides. The University of Louisiana at Monroe, School of Pharmacy, 263 Sugar Hall, Monroe, LA 71209, USA- Starch/Sträke, 57(2), 55-61. https://doi.org/10.1002/star.200400341
Medoua,
N. G. J. M. (2005). Potentiels Nutritionnel et Technologique Des
tubercules Durcis de l'igname Dioscorea dumetorum (Kunth) pax : étude du
durcissement post -récolte et des conditions de transformation des tubercules
durcis en farine [Thèse de Doctorat/PhD], 254.
Miller, G. L. (1959). Use of Dinitrosalicylic Acid Reagent for Determination of Reducing Sugar. Analytical Chemistry 31, 426-428. https://doi.org/10.1021/ac60147a030
Montagnac, J. A., Davis, C. R., & Sherry, A. (2009). Tanumihardjo Nutritional Valueof Cassava for Use as a Staple Food and Recent Advances forImprovement. Comprehensive Reviews in Food Science and Food Safety, 8, 181-194. https://doi.org/10.1111/j.1541-4337.2009.00077.x
Ndouyang, C. J., Ejoh Aba, R., Bakar, A., Facho, B., Njintang, Y. N., Mohammadou, B. A., & Mbofung, C. M. (2009). Propriétés Physico-Chimiques et Fonctionnelles de Tacca leontopetaloides (L.) Kuntze, tubercule non conventionnel. e-Revue de génie industriel, Numéro 3 du 1er juillet 2009. (Disponible sur.
Njintang, Y. N., & Mbofung, C. M. F. (2003). Kinetics of Gelatinisation and Mass Transfer During Cooking of Taro (Colocasia esculenta L. Schott) Slices. Starch/Stärke, 55, 170-176. https://doi.org/10.1002/star.200390031
Ragone, D., & Cavaletto, C. G. (2006).
Sensory Evaluation of Fruit Quality and Nutritional Composition of 20
Breadfruit (Artocarpus, Moraceae) Cultivars. Economic Botany, 60(4), 335-346. https://doi.org/10.1663/0013-0001(2006)60[335:SEOFQA]2.0.CO;2
Razanamparany, J. L., Ralaiarison, G.D., Jeannoda, V. H., Monneuse, M. O., & Hladik, C. M. (2003). Potentialités Alimentaires et Nutritionnelles Des Ignames Malgaches. International Working Meeting Food Africa, Yaoundé - Caméroun, 4-9, 30.
Tako, M., & Hizukuri, S. (2000). Retrogradation Mechanism of Rice Starch. Cereal Chemistry, 77, 473-477. https://doi.org/10.1094/CCHEM.2000.77.4.473
Thierry, T., Kuakoon, P., & Klanarong, S. (2007). Gelatinization and Thermal Properties of Modified Cassava Starches. Starch/Stärke, 59, 46-55. https://doi.org/10.1002/star.200600514
Toilibou, S. (2019). Etude des Nutriments et Des Substances Bioactives des fruits d Artocarpus altilis, une MORACEE de la Grande Comore. (Thèse de doctorat de Biochimie : Biodiversité et Santé). Tananarive : Université d'Antananarivo, 129.
Trinder, P. (1969). Determination of Glucose in Blood Using Glucosa Oxidase. Ann Clin Biochem, 6, 24. https://doi.org/10.1177/000456326900600108
Whistler, W. A. (1992). Polynesian Herbal Medicine. Everbest. Hong Kong, 205-206.
|
|
 This work is licensed under a: Creative Commons Attribution 4.0 International License
© IJETMR 2014-2024. All Rights Reserved.