
|
|
|
|
Research on the wear characteristics of horizontal to vertical bends of dilute-phase pneumatic conveying based on CFD-DEM method
Zebing Zheng 1![]()
![]()
1 Postgraduate,
School of Mechanical Engineering, North China University of Water Resources and
Electric Power, Zhengzhou, China
|
|
|
ABSTRACT |
|
|
To solve the
problem that thin phase pneumatic conveying elbow is easy to wear, the
particle mass flow rate, gas velocity, bending diameter ratio and particle
size are selected as the influencing factors. The orthogonal test of four
factors and four levels is carried out by using CFD-DEM coupled numerical
simulation. The results of bending pipe wear, particle velocity and system
pressure drop under different conditions are obtained. The results show that
the particle mass flow and gas velocity have significant effects on the above
three evaluation indexes, while the bending diameter ratio and particle size
have no significant effects on the particle velocity and bending wear. Under
the discussed conditions, the factors corresponding to the minimum wear are: mass flow rate of 0.5kg/s, gas velocity of 30 m/s,
bending diameter ratio of 4.5D, particle size of 2.5mm. |
|||
|
Received 14 March 2024 Accepted 16 April 2024 Published 02 May 2024 Corresponding Author Zebing Zheng, zebing1999@163.com DOI 10.29121/ijetmr.v11.i5.2024.1418 Funding: This research
received no specific grant from any funding agency in the public, commercial,
or not-for-profit sectors. Copyright: © 2024 The
Author(s). This work is licensed under a Creative Commons
Attribution 4.0 International License. With the
license CC-BY, authors retain the copyright, allowing anyone to download,
reuse, re-print, modify, distribute, and/or copy their contribution. The work
must be properly attributed to its author.
|
|||
|
Keywords: Pneumatic
Conveying, Gas-Solid Two-Phase Flow, Wear and Tear, Pressure Drop, Orthogonal
Experiment |
|||


1. INTRODUCTION
Pneumatic conveying is favored by the industry because of its simple structure and convenient operation Lin-li et al. (2019). In actual production, it is usually necessary to arrange bending pipes to realize the change of transport direction, and the particles are generated when they flow through the pipe section with bending pipes. There are certain influences Xi et al. (2021), and scholars have done a lot of research on this.
The reason for the wear phenomenon is that particles contact with the pipe wall at a high kinetic energy, resulting in material loss on the wall surface Zhen-Qiang et al. (2021), and the wear phenomenon is particularly significant at key parts such as elbow and tee Xiao-Yang et al. (2020). Njobuenwu & Fairweather (2012) found through experiments that the most severely worn parts in vertical and horizontal tubes are usually located at 22°, 75° ~ 85° (outside) and 45° (inside). Particles will aggregate at the ridge of the bend to form particle ropes Qiu-Hao (2020), and will gradually develop into O-shaped wear areas San-Ping (2017). In some results, V-shaped wear areas You-You et al. (2020) exist, which is formed by the interaction of particle-wall and particle-particle collisions Peng & Cao (2016). The effects of apparent gas velocity, pipe diameter, bending diameter ratio, solid mass flow rate, particle roundness and other parameters on wear have been studied Peng et al. (2019). The particle velocity characteristic is one of the significant flow characteristics in transport process. Rinoshika (2013) found that the addition of fins plays an important role in optimizing particle fluidity and accelerating. Zhi-hua et al. (2021) deduced the changes of particle velocity by combining the changes of pressure drop in multiple pipelines and the distribution images of solid particles at different positions in the pipelines. Aiming at the internal pressure drop, Li et al. (2021) added an oscillator at the particle inlet to obtain the variation rules of system pressure drop and local pressure drop. Zhou et al. (2022) established a precise pressure drop model and obtained the pressure drop distribution law in the bend. Xu et al. (2023) believes that when particles flow through the elbow, the fluid traction and inertia forces will produce a shift in the direction of velocity, forming a V-shaped wear shape.
To sum up, scholars mostly studied the flow characteristics of bent pipes quantitatively by changing the parameters of single factors, while changing multiple factors and discussing the priority of their influence degree rarely. The flow characteristics in the bend are complex and changeable, and the problem of unstable transportation needs to be solved. In order to quantify the wear and flow characteristics of bending pipe, obtain the influence of parameters on bending pipe flow, and provide theoretical guidance for actual production, the flow characteristics of conveying process under various influencing factors were obtained by using CFD-DEM coupling calculation and orthogonal test. Four influencing factors were set: particle mass flow rate, gas velocity, bending diameter ratio and particle size, and four levels were set for each factor, with bending pipe wear, particle velocity and system pressure drop as evaluation indexes.
2. MATERIALS AND METHODS
2.1. NUMERICAL SIMULATION MODEL
Under the assumption that the fluid is continuous and incompressible, the basic equation of the flow in a tube can be established by means of Reynolds time mean method, and the turbulence model is used to perform the closed calculation of the equation. The calculation model can be written as:
Continuity equation:
![]()
Momentum equation:
![]()
Where, ![]() is the air density, t is the time,
is the air density, t is the time, ![]() is the porosity,
is the porosity, ![]() is the air velocity
vector,
is the air velocity
vector, ![]() is the apparent gas
velocity, p is the gas phase pressure,
is the apparent gas
velocity, p is the gas phase pressure, ![]() is the viscosity stress tensor, F is the particle
force vector on the gas phase.
is the viscosity stress tensor, F is the particle
force vector on the gas phase.
The wear model used in this paper is the wear model proposed by Archard Woon-Shing (1979), which can be written as:
![]()
Where, E is the relative total surface wear rate, ![]() is the mass of a
single particle,
is the mass of a
single particle, ![]() is the mesh volume, P
is the number of particles contained in a single mesh, Q is the impact
velocity of particles on the wall, and k is the trajectory index of
particles. In order to facilitate calculation, the n
value is generally 2.
is the mesh volume, P
is the number of particles contained in a single mesh, Q is the impact
velocity of particles on the wall, and k is the trajectory index of
particles. In order to facilitate calculation, the n
value is generally 2. ![]() is the function
related to particle impact Angle given by Finnie (1972),
which can be written as:
is the function
related to particle impact Angle given by Finnie (1972),
which can be written as:
![]()
2.2. MODEL SETUP
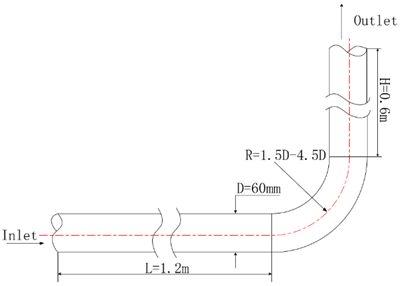
Scholars believe that in numerical simulations of dilute-phase transport in horizontal-vertical bends, maintaining the length of the horizontal pipe upstream of the bend at 0.5 m or more will ensure that the particles are completely fluidised before entering the bend Rinoshika (2013), the model parameters used in numerical simulation are shown in Figure 1. The Hertz-Mindlin contact model was used to simulate the transport process of bulk particles, and spherical particles with a density of 1125kg/m3 were selected. In order to make the bending wear phenomenon significant, the wall material density was reduced to 2500kg/m3, and the wall collision recovery coefficient was 0.5. Elbow outlets are set to free flow. Young's modulus and shear modulus are 1×10⁸ and 2.5×10⁸, static friction coefficient is 0.5, dynamic friction coefficient is 0.01, wall wear constant 1*10-7 is added.
Figure 1
|
Figure
1 Model Parameters |
On the basis of the above model, ICEM software was used to divide structured grids[21]. In order to prevent the influence of low-quality grids on the calculation results, the grid quality was all greater than 0.3. The number of grids after dividing the models from 1.5D to 4.5D was 9210, 9609, 9894 and 10179, respectively.
The orthogonal test method was selected in this study. According to the principles of orthogonal test design, table l16(44) was the most suitable one, and the experimental design arrangement was shown in Table 1.
Table 1
|
Table 1 Orthogonal Test Scheme Design |
||||
|
Number |
Particle Mass Flow/kg·s-1 |
Gas Speed/m·s-1 |
Bending Ratio |
Particle Size /mm |
|
1 |
A1(0.5) |
B1(30) |
C1(1.5) |
D1(1) |
|
2 |
A1 |
B2(35) |
C2(2.5) |
D2(1.5) |
|
3 |
A1 |
B3(40) |
C3(3.5) |
D3(2.0) |
|
4 |
A1 |
B4(45) |
C4(4.5) |
D4(2.5) |
|
5 |
A2(1) |
B10 |
C2 |
D3 |
|
6 |
A2 |
B2 |
C1 |
D4 |
|
7 |
A2 |
B3 |
C4 |
D1 |
|
8 |
A2 |
B4 |
C3 |
D2 |
|
9 |
A3(1.5) |
B1 |
C3 |
D4 |
|
10 |
A3 |
B2 |
C4 |
D3 |
|
11 |
A3 |
B3 |
C1 |
D2 |
|
12 |
A3 |
B4 |
C2 |
D1 |
|
13 |
A4(2) |
B1 |
C4 |
D2 |
|
14 |
A4 |
B2 |
C3 |
D1 |
|
15 |
A4 |
B3 |
C2 |
D4 |
|
16 |
A4 |
B4 |
C1 |
D3 |
The orthogonal experiment results are shown in Table 2. Range analysis and variance analysis are used to discuss the experimental results.
Table 2
|
Table 2 Orthogonal Test Results |
|||
|
Number |
Wear/mm |
Pressure Drop/kPa |
|
|
1 |
2.040 |
19.062 |
3.006 |
|
2 |
1.722 |
19.705 |
3.326 |
|
3 |
2.027 |
20.251 |
3.989 |
|
4 |
1.553 |
20.374 |
4.272 |
|
5 |
2.149 |
15.931 |
4.206 |
|
6 |
3.309 |
16.657 |
5.287 |
|
7 |
4.191 |
26.538 |
7.607 |
|
8 |
4.318 |
25.789 |
8.362 |
|
9 |
1.612 |
14.432 |
5.964 |
|
10 |
2.449 |
19.145 |
7.875 |
|
11 |
5.319 |
23.679 |
10.262 |
|
12 |
7.735 |
30.717 |
13.130 |
|
13 |
2.278 |
18.719 |
8.516 |
|
14 |
3.887 |
26.180 |
11.651 |
|
15 |
4.459 |
19.908 |
12.249 |
|
16 |
7.541 |
24.731 |
14.534 |
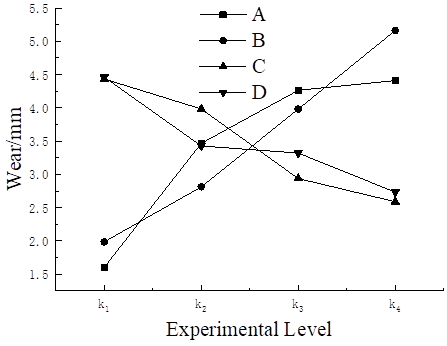
The wall wear degree obtained by orthogonal experiment is shown in Table 3, where ki(i=1,2,3,4) is the mean value of the experimental results at the first, second, third and fourth levels of each corresponding factor, and Rank is the ranking of the influence degree of each factor on the wear degree. It can be seen from Table 3 that the effects of various factors on wear are ranked as B > A > C > D, this trend is very similar to the results of Zhou et al. (2022) , so the result is considered reliable.
Table 3
|
Table 3 Range Analysis of Wear Depth in Orthogonal
Experiment |
||||
|
A |
B |
C |
D |
|
|
k1 |
1.605 |
1.987 |
4.436 |
4.463 |
|
k2 |
3.467 |
2.813 |
3.984 |
3.429 |
|
k3 |
4.264 |
3.983 |
2.939 |
3.322 |
|
k4 |
4.410 |
5.164 |
2.589 |
2.734 |
|
Range |
2.805 |
3.177 |
1.847 |
1.730 |
|
Rank |
2 |
1 |
3 |
4 |
The bending to diameter ratio is negatively related to the change of the maximum wear value, because when the particle is in direct contact with the wall, the increase of the bending to diameter ratio will reduce the axial force acting on the wall and reduce the wear. During the movement of the bending pipe, the velocity direction of the particles is constantly forced to be corrected by the constraint of the wall surface, which reduces the axial pressure of the particles on the wall and reduces the wear in a long range. The increase of particle size means the increase of particle mass. Under the same mass flow rate, the number of particles with large particle size decreases, so the particle size and maximum wear value decrease in a stepped manner. Although the change of particle size has a low effect on wear, the range value reaches 1.730mm. Table 4 provides the ANOVA results of the orthogonal test, including sum of squares of deviation (SS), degrees of freedom (DF), mean square (MS), statistics (F), and probability of significance (P). When P < 0.05, this factor has little effect on wear. The P values of mass flow rate, gas velocity and bending diameter ratio are lower than 0.05, which have significant effects on wear. The particle size higher than 0.05 was not significant.
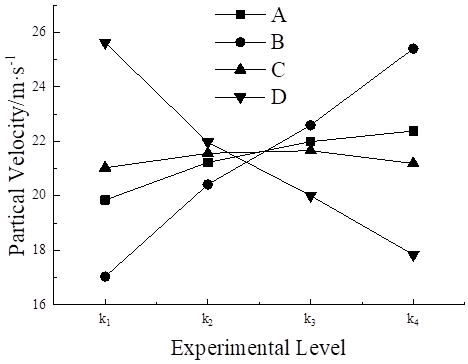
Table 5 shows the range
analysis of the highest particle velocity in the orthogonal test (particle
velocity is replaced by particle velocity below), and the degree of influence
on particle velocity is ranked as B > D > A > C.
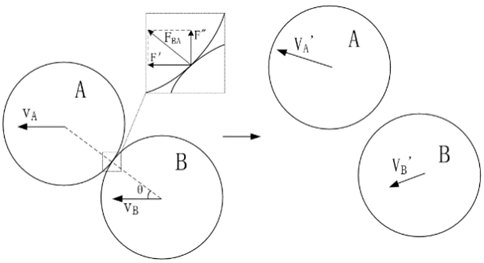
Figure 3 shows the curve of the relationship between each factor and grain velocity. In the flow field, particles are subjected to the radial force given by the flow field and the force generated by the particle-particle collision. As shown in Figure 4, particle B provides particle A with an axial component for acceleration and a radial component for changing the direction of motion. The velocity direction of particles is deflecting, which makes it easy to collide with particles next time, and the increase of mass flow increases the particle-particle collision frequency. The particle velocity increases when the particle reaches the bend, and the mass flow rate is positively correlated with the change of particle velocity, and the increase rate decreases to 0.391m /s with the increase of mass flow rate. At low gas velocity, the kinetic energy given by the flow field is less, and the particles accumulate at the bottom of the pipe. After increasing the gas velocity, the picking up process of particles becomes easier, and the acceleration and deceleration probabilities of individual particles increase with the increase of particle density, and the slope of the curve fluctuates slightly. The particle velocity is concentrated in the range of 21-22 m/s, and the range is only 0.631. When the bending diameter ratio increases from 1.5D to 3.5D, the speed increases gradually, while when the bending diameter ratio increases to 4.5D, the speed decreases slightly. The particle velocity decreases gradually with the increase of particle size. Under the experimental condition of 1mm particle size, the highest particle velocity was 25.624 m/s, and the range of different particle size levels was 7.781 m/s. When the particle size increased from 1mm to 1.5mm, the particle velocity decreased by 3.651m /s, and some particles reached the fluidization state before contacting the bottom of the tube wall. When the particle size increases from 1.5mm to 2.5mm, the particle velocity decreases from 21.9727 m/s to 17.8428 m/s at a relatively stable rate, and the difference between D23 (the difference between k2 and k3 under the D factor) and D34 is only 0.2129 m/s, which can be considered as a near-linear change in the curve. As can be seen from Table 6, mass flow rate, gas velocity and particle size have significant effects on particle velocity, and the P-values of gas velocity and particle size are only 0.01, which have significant effects on particles. The P value of the bending diameter ratio was greater than 0.05, so it was not significant.
Table 4
|
Table 4 Analysis of Variance of Wear Depth in
Orthogonal Experiment |
|||||
|
Source |
SS |
DF |
MS |
F |
P |
|
A |
17.142 |
3 |
5.714 |
17.996 |
0.02 |
|
B |
23.057 |
3 |
7.686 |
24.206 |
0.013 |
|
C |
9.017 |
3 |
3.006 |
9.466 |
0.049 |
|
D |
6.205 |
3 |
2.068 |
6.514 |
0.079 |
|
Error |
0.953 |
3 |
0.318 |
||
|
Total |
56.374 |
15 |
|||
Figure 2
|
Figure 2 Variation
Trend of Elbow Wear Depth at Different Levels in Orthogonal Test |
Table 5
|
Table 5 Analysis of Particle Velocity Range in Orthogonal
Experiment |
||||
|
A |
B |
C |
D |
|
|
k1 |
19.848 |
17.036 |
21.032 |
25.624 |
|
k2 |
21.229 |
20.422 |
21.565 |
21.973 |
|
k3 |
21.993 |
22.594 |
21.663 |
20.014 |
|
k4 |
22.384 |
25.403 |
21.193 |
17.843 |
|
Range |
2.536 |
8.367 |
0.631 |
7.781 |
|
Rank |
3 |
1 |
4 |
2 |
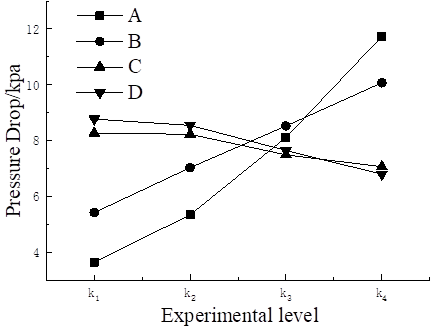
Table 7 shows the range analysis of the system pressure drop in the orthogonal test, and the specific values of the system energy loss under the four influencing factors are obtained. The degree of influence of each factor on the system pressure drop is ranked as A > B > D > C from the largest to the smallest.
Figure 3
|
Figure
3 Variation
Trend of Particle Velocity at Different Levels in Orthogonal Test |
Figure 4
|
Figure
4 Schematic Diagram of Velocity Direction Correction Caused by
Particle-Particle Collision |
Table 6
|
Table 6 Analysis of Particle Velocity Range in Orthogonal
Experiment |
|||||
|
Source |
SS |
DF |
MS |
F |
P |
|
A |
15.016 |
3 |
5.005 |
16.213 |
0.023 |
|
B |
149.777 |
3 |
49.926 |
161.716 |
0.001 |
|
C |
1.076 |
3 |
0.359 |
1.162 |
0.452 |
|
D |
130.961 |
3 |
43.654 |
141.402 |
0.001 |
|
Error |
0.926 |
3 |
0.309 |
||
|
Total |
297.756 |
15 |
|||
Table 7
|
Table 7 Analysis of Pressure Drop Range in Orthogonal
Experimental System |
||||
|
A |
B |
C |
D |
|
|
k1 |
3.648 |
5.423 |
8.272 |
8.773 |
|
k2 |
5.343 |
7.035 |
8.227 |
8.550 |
|
k3 |
8.116 |
8.526 |
7.491 |
7.651 |
|
k4 |
11.737 |
10.075 |
7.068 |
6.794 |
|
Range |
8.089 |
4.652 |
1.204 |
1.980 |
|
Rank |
1 |
2 |
4 |
3 |
Figure 5 shows the relationship curve of each factor to the system pressure drop. The increase of particle mass flow rate increases the material mass in equal proportion, thus forming a positive feedback effect on the pressure drop. Under the given gas velocity, the increase of particle velocity gradually decreases, so the curve presents an increasing trend. As the gas velocity increases, the system pressure drop increases at a relatively stable rate. When the gas velocity increases from 30 m/s to 35 m/s, the particle velocity increases under the action of drag force, and the pressure drop increases by 1.612 kPa. When the gas velocity increases to 40 m/s, particles can violently collide with the wall at a higher particle velocity, and the pressure drop increases by 1.4916 kPa; when the gas velocity reaches 45 m/s, the pressure drop increases again by 1.5482 kPa. Combined with Table 5, it can be seen that the particle velocity reaches a higher level of 25.4027 m/s, the particle rebound height increases, and the pressure drop increases. At low bending diameter ratio, the collision Angle between particles and the wall is larger, and the energy loss of particles in the collision is also large. However, when the bending diameter ratio increases from 1.5D to 2.5D, the bending pipe length increases, and the pressure drop decreases by 0.0447kPa. When the bending diameter ratio increases to 3.5D, the pressure drop drops sharply from 8.2274kPa to 7.4914kPa. The influence of tube length extension on pressure drop is much higher than that of impact Angle decrease. When the bending diameter ratio is increased to 4.5D, the time difference value is only 0.4237kPa, which is slightly lower than 0.736kPa of C23. For the change of particle size, the size of D12 is 0.2238, which is significantly different from 0.8988 and 0.8572 of D23 and D34, that is, the pressure drop decreases slowly at first, and then rapidly decreases relatively steadily when the particle size reaches the range of 1.5mm to 2.5mm. The causes of pressure loss include pressure loss during particle fluidization and acceleration, energy loss caused by particle collision with elbow, and energy required for particle reacceleration.
Figure 5
|
Figure
5
Variation Trend of System Pressure Drop at Various Levels in Orthogonal Test |
Too deep wear depth may lead to premature failure of bending pipe and other problems, so wear is the problem that needs to be given priority in the actual production process. When only wear is considered, the best factor level combination is A1B1C4D4.
Table 8
|
Table 8 Variance Analysis of
Pressure Drop in Orthogonal Experimental System |
|||||
|
Source |
SS |
DF |
MS |
F |
P |
|
A |
148.265 |
3 |
49.422 |
749.881 |
0.000 |
|
B |
47.732 |
3 |
15.911 |
241.42 |
0.000 |
|
C |
4.128 |
3 |
1.376 |
20.880 |
0.016 |
|
D |
7.537 |
3 |
2.512 |
38.122 |
0.007 |
|
Error |
0.198 |
3 |
0.66 |
||
|
Total |
207.86 |
15 |
|||
4. CONCLUSIONS and RECOMMENDATIONS
In this paper, orthogonal tests were carried out on the basis of thin phase transportation. By changing the parameters of particle mass flow rate, gas velocity, bending diameter ratio and particle size, the flow characteristics during thin phase transportation were systematically analyzed with elbow wear, particle velocity and system pressure drop as evaluation indexes, and the following conclusions were drawn:
1) Particle mass flow rate has a significant impact on elbow wear, particle velocity and system pressure drop, and the increase of the three factors changes with the increase of mass flow rate. The impact of mass flow on the system pressure drop is particularly strong, and the P value is much less than 0.01, which should be given priority in the experimental design.
2) Fluid, as the main energy source of particles, directly affects the initial acceleration and re-acceleration process after collision, so the influence on bending wear, particle velocity and system pressure drop is significant, and the system pressure drop is linear with the gas velocity.
3) The bend to diameter ratio has a significant effect on the wear of the bend pipe and the system pressure drop, and the grain velocity does not change significantly in the bend pipe, so the change of the bend to diameter ratio does not have a significant effect on the grain velocity.
4) Because of its own weight, large particles have a large demand for energy and can have a certain disturbance effect on the flow field, so the particle size has a significant impact on the particle velocity and system pressure drop. Because of the protective effect of the rope bundle phenomenon on the wall surface, the influence of particle size on the wear of bending pipe is not significant.
5) In the case of wear only, the optimal horizontal combination of factors is mass flow rate of 0.5kg/s, gas velocity of 30 m/s, bending diameter ratio of 4.5D, and particle size of 2.5mm.
CONFLICT OF INTERESTS
None.
ACKNOWLEDGMENTS
None.
REFERENCES
Biao, H. (1984). Pneumatic
Conveying [M]. Shanghai:
Shanghai Science and Technology Press.
Bing-Tao, H., Rong-Tao, Z., Chao-Yong, L. (2019). Simulation Study on Erosion Failure of Elbow and Analysis of Influencing Factors [J]. Journal of Changzhou University (Natural Science Edition), 31(02), 27-34.
Finnie, I. (1972). Some Observations on the Erosion of Ductile Metals[J]. Wear, 19(1), 81-90. https://doi.org/10.1016/0043-1648(72)90444-9
Li, X., Yan, F., & Tu, P. P. (2021). Particle Dynamics Analysis in Bend in a Horizontal-Vertical Pneumatic Conveying System With Oscillatory Flow[J]. Advanced Powder Technology, 32(3), 637-645. https://doi.org/10.1016/j.apt.2020.12.031
Lin-li, Z., Xu-ming, P., & Xu, L.
(2019). Optimization of Pneumatic Conveying Kinetic Parameters of Powder Particles and Analysis of
Pressure Drop Characteristics [J]. Chemical
Engineering & Machinery, 46(01), 29-34.
Nan, L., Hui-Qing, L., & Yue, C. (2013). Effects of Incidence Angle and Geometry of Elbows on the Erosion [J]. Science Technology and Engineering, 13(18), 5135-5140.
Njobuenwu, D. O., & Fairweather, M. (2012). Modelling of Pipe Bend Erosion by Dilute Particle Suspensions[J]. Computers & Chemical Engineering, 42, 235-247. https://doi.org/10.1016/j.compchemeng.2012.02.006
Peng, S., Chen, Q., & Shan, C. (2019). Numerical Analysis of Particle Erosion in the Rectifying Plate System During Shale Gas Extraction[J]. Energy Science & Engineering, 7(5), 1838-1851. https://doi.org/10.1002/ese3.395
Peng, W., & Cao, X. (2016). Numerical Prediction of Erosion Distributions and Solid Particle Trajectories in Elbows for Gas-Solid Flow[J]. Journal of Natural Gas Science and Engineering, 30, 455-470. https://doi.org/10.1016/j.jngse.2016.02.008
Qian, C., Can, K., Shuang, T. (2022). Mechanisms of Wear of the Inner
Wall of the Elbow Pipe Interacting
With Non-Spherical Solid Particles [J]. Tribology, 42(06),
1094-1104.
Qiu-Hao. S. (2020). Research on Particle Diffusion Characteristics of Roping Phenomenon in Dilute Phase Pneumatic Conveying[D].Jiangsu: Southeast University.
Rinoshika, A. (2013). Effect of Oscillating Soft Fins on Particle Motion in a Horizontal Pneumatic Conveying[J]. International Journal of Multiphase Flow, 52, 13-21. https://doi.org/10.1016/j.ijmultiphaseflow.2012.12.010
San-Ping, Z. (2017). Numerical Simulation of Erosion of Elbow Based on Stokes Number [J]. Corrosion & Protection, 38(07), 557-561.
Wang, T. (2023). Numerical Simulation Study of Shrimp Feed Dilution Phase Pneumatic Conveying Automatic Feeding System [D]. Qingdao University of Science and Technology.
Woon-Shing, Y. (1979). Erosion in a Curved Pipe[J]. Wear, 55(1), 91-106. https://doi.org/10.1016/0043-1648(79)90182-0
Xi, S., Hu, T., & Jianmin, R. (2021). Numerical Simulation of Flow Characteristics
in Elbow Sediment Flow Based on CFD-Eulerian Model [J].
Journal of Basic Science and Engineering, 29(06), 1418-1428.
Xiao-Yang, S., Xue-Wen, C., & Zhen-Qiang, X. (2020). Erosion Prediction of Gas-Solid Flow Based
on DSMC-CFD Method [J]. Surface Technology, 249(09),
274-280.
Xu, L., Wu, H., & Wang, J. (2023). Simulation of Erosion in Pneumatic Conveying Bends Based on the DDPM Model [J]. Science & Technology in Chemical Industry, 31(03), 20-25.
Yan, F., Li, X., Zhu, R. (2020). An Experimental Study on a Horizontal-Vertical Pneumatic Conveying System Using Oscillatory Flow[J]. Advanced Powder Technology, 31(6), 2285-2292. https://doi.org/10.1016/j.apt.2020.03.019
You-You, G., Wen, Y., & Qiang, X.
(2020). Numerical
Simulation of Erosive Wear on Bending Pipe Based on CFD [J]. Oil-Gas Field
Surface Engineering, 239(03), 84-89+94.
Zhen-Qiang, X., Xue-Wen, C., & Chao, W. (2021). Research
Progress of Solid Particle Erosion Theories and Anti-erosion Methods
in Elbow [J]. Surface Technology,
50(08), 170-179.
Zhi-hua, L., Xian-Bing, Z., & Li-Hao, H. (2021). Analysis of Transportation Characteristics of Carbon Black in Pneumatic Conveying Elbow [J]. China Rubber Industry, 68(10), 769-773.
Zhou, F., Li, J., Yang, D. (2022). Experimental Study on Collision Characteristics of Large Coal Particles (7-15 mm) in 90° Elbows of Pneumatic Conveying Systems[J]. Powder Technology, 396, 305-315. https://doi.org/10.1016/j.powtec.2021.10.038
|
|
 This work is licensed under a: Creative Commons Attribution 4.0 International License
© IJETMR 2014-2024. All Rights Reserved.