
|
|
|
|
Bouthaïna Fersi Maazoun 1![]() , Mariem Ben Mabrouk 1
, Mariem Ben Mabrouk 1![]() , Mahdi Gargouri 1
, Mahdi Gargouri 1![]() , Faouzi Masmoudi 2
, Faouzi Masmoudi 2![]()
1 MODILS
Laboratory, Faculty of Economics and Management of Sfax, University of Sfax,
Tunisia
2 Professor, Department of Mechanical Engineering, University of Sfax, National School of Engineers of Sfax, Tunisia
|
|
|
ABSTRACT |
|
|
Manufacturing companies are constantly driven to minimize costs, maximize efficiency, and enhance production quality, as these factors are pivotal for maintaining a competitive edge in the market. Lean manufacturing is a pivotal strategy that plays a crucial role in assisting companies for achieving significant continuous improvement in performance through the elimination of all wastes of resources and time in the total business process. The main objective of this paper is to validate the results of implementing Lean manufacturing through the DMAIC concept. This study focuses on a case study conducted in a glass transformation company that aims to improve the flow within the production workshop by implementing pull systems and minimizing waste. To achieve this objective, a comprehensive literature review was conducted to examine different frameworks for applying the Lean method. The
implementation of DMAIC has provided a better structure for the entire
project, enabling the selection of appropriate improvement solutions and the
use of the right Lean tools. This approach offers several advantages that are
not present in other frameworks. The results of this implementation have
shown a significant improvement in production planning, flow efficiency, and
a substantial financial gain for the company. |
|||
|
Received 15 February 2024 Accepted 16 March 2024 Published 31 March 2024 Corresponding Author Bouthaïna Fersi Maazoun, bouthaina.maazoun@usf.tn
DOI 10.29121/ijetmr.v11.i3.2024.1406 Funding: This research
received no specific grant from any funding agency in the public, commercial,
or not-for-profit sectors. Copyright: © 2024 The
Author(s). This work is licensed under a Creative Commons
Attribution 4.0 International License. With the
license CC-BY, authors retain the copyright, allowing anyone to download,
reuse, re-print, modify, distribute, and/or copy their contribution. The work
must be properly attributed to its author.
|
|||
|
Keywords: Lean
Manufacturing, DMAIC, Lean Tools, Continuous Improvement |
|||


1. INTRODUCTION
In today's highly
competitive business landscape, numerous companies strive to establish their
presence despite limited resources. However, in order to achieve greater
profitability, these companies often find themselves in need of more efficient
manufacturing processes. This is where the adoption of lean management
techniques comes into play. By implementing this approach, businesses across
various sectors such as manufacturing, for-profit, non-profit, education, and
healthcare can significantly enhance their effectiveness and efficiency The
lean approach has proven to be a game-changer for numerous industries, enabling
them to produce superior products in less time and with fewer efforts Dave (2020).
After the conclusion
of World War II, Japanese manufacturers, specifically those in the automotive
industry, were confronted with a significant predicament: shortages of
essential resources such as materials, finances, and manpower. It was during
this challenging period that Eiji Toyoda and Taiichi Ohno, visionaries at the
Toyota Motor Company in Japan, pioneered a groundbreaking concept known as the
Toyota Production System. Kumar et al. (n.d.).
Following its
resounding success in Japan, lean manufacturing quickly gained traction among
companies and industries worldwide, particularly in the United States Fawaz Abdullah (2003). Moreover, the lean approach fosters a culture of
continuous improvement, encouraging employees to identify and address
inefficiencies, resulting in a more agile and adaptable organization.
This document
presents a relevant Lean Manufacturing application, implemented by following
the systematic steps of the DMAIC approach to reduce the various waste forms
that involve a high inventory of work-in-process for a glass transformation
company with a complex workflow. In
order to successfully implement the Lean concept, the team used a plethora of
Lean tools like, value stream mapping, 5S, etc. For the paper’s organization,
the first part is dedicated for a literature review concerning Lean Manufacturing
and its applicability as well as the DMAIC cycle. The second part will be
focusing on the methodology used for the implementation of the Lean
Manufacturing project. The third part
will include the gain generated and the Lean application’s efficiency in this
company. A conclusion and some perspectives will be discussed in the last part.
2. Literature review
2.1. Lean concept
The Lean philosophy is centered around the reduction and elimination of non-value added activities, commonly referred to as "Mudas" in Lean terminology. By implementing Lean production techniques, companies can achieve higher levels of productivity with fewer human resources, reduced financial investment, less space, and fewer equipment requirements to manufacture the same product Salonitis & Tsinopoulos (2016).
Figure 1
|
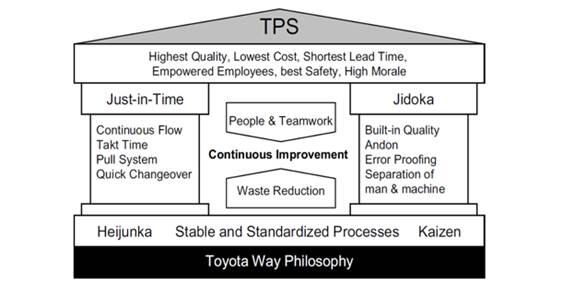
Figure
1 The Core Principles of the
Toyota Production System Romvall et al. (2010) |
Toyota, the originator of Lean, has
likened its philosophy to a temple, symbolizing the foundation of Lean project
construction and the pillars that fortify its strength (refer to Figure 1). Each component of this temple serves to define the objectives of the
methodology, highlighting the areas that require attention and the tools that
should be employed Rüttimann & Stöckli
(2016).
It also adds five principles to
improve the company's functioning: determining the product's value in the eyes
of clients, identifying, and clarifying the value stream for the product,
providing a fast and undisturbed value stream, allowing clients to elicit value
from the producer, and striving for excellence Dekier (2012).
2.2. Lean manufacturing
Lean Manufacturing was
first coined in 1991 by James P. Womack, Daniel T. Jones, and Daniel Roos in their book "The Machine That Changed the
World." They compared Japanese and American companies and found that
Toyota Motor Company, with its Toyota Production System, was the most
efficient. Dekier (2012).
The Toyota Production System (TPS)
was hailed as the first system that followed the principles of Lean. In 2001,
Womack and Jones published "Lean Thinking: Banish Waste and Create Wealth
in Your Corporation," which defined the foundations of the
Lean Philosophy. Lean Manufacturing is considered a successor of the TPS
and applies the instruments developed by Toyota. Palange & Dhatrak (2021).
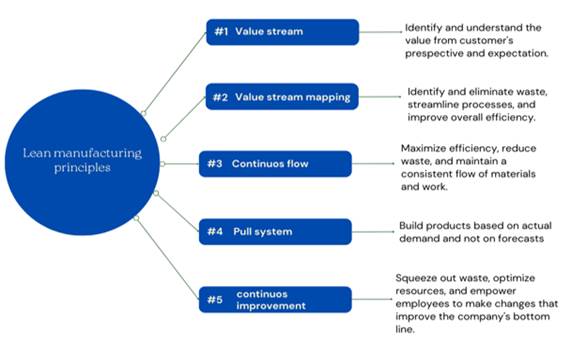
In order to effectively implement Lean
principles, companies must adhere to the principles of Lean implementation.
These principles have been extensively discussed in various books and articles,
including works by Jerry (2003), Liker (2004), Andersson et al. (2006), Su et al. (2006). For a
comprehensive overview, refer to Figure 2.
Figure 2
|
Figure
2 The Lean Manufacturing
Principles |
The implementation of Lean has been
closely linked and integrated with various other concepts, services, and
paradigms. One such example is Lean Sigma Mostafa et al. (2016) which combines Lean's focus on efficiency and speed with Six Sigma's
emphasis on accuracy and precision. By utilizing Lean principles, resources are
effectively utilized to create value, while Six Sigma ensures that tasks are
done correctly the first time.
2.3. DMAIC approach
DMAIC, inspired by Deming practices
and the Plan, Do, Check, and Act (PDCA) Cycle Gupta (2013). This process ensures continuous improvement and has proven to be
highly beneficial for numerous organizations.
DMAIC stands for the five steps:
Define, Measure, Analyze, Improve, and Control. Interestingly, DMAIC can be
operated without making reference to the Six Sigma
approach. For instance, in one study, the DMAIC cycle was exploited to improve
the supply chain Dossou & Dedeban
(2016), while in another study, it was used to analyze the root causes of
circuit breaker failure in a distribution system Popov et al. (2018).
The DMAIC Methodology is a six-step
approach used in Six Sigma projects. The first step is the Define Phase, where
the problem is identified, the project goal is established, and the customers
affected by the problem are determined. The second step is the Measure Phase,
where the existing system or process is measured and
metrics are established. The third step is the Analyze Phase, where the
defective process is analyzed to identify input variables that affect the
output. The fourth step is the Improve Phase, where solutions to the problem
are selected and implemented to improve efficiency, cost-effectiveness, and
speed. The fifth step is the Control Phase, where modifications to management
systems are made to ensure the improvements are sustainable. Continuous
monitoring is also necessary to confirm the desired improvement has been achieved Kumar and Sharma (2012).
3. Mehodology
A diagnostic is an important step in any project as it helps
identify issues within an organization. It involves observation,
identification, and analysis to establish connections between relevant
variables. In this case, a Lean assessment was used to evaluate the company's
operations and determine indicators related to costs, quality, and
timelines. Lean assessment is based on the “Genchi Genbutsu”
approach which means going to the source to check the situation for yourself
and emphasizes Gemba processes, a Japanese word meaning “where reality is”. The
Genba or Gemba walk is an activity for managers which
consists of going into the field to look for waste and opportunities for
improvement that are at the origin of added value. Loyd et al. (2020b).
Company managers were involved in the
assessment and rated the level of Lean integration using a scale from 0 to 4. A
questionnaire based on eight Lean principles was used to calculate results,
with each principle assigned a rating out of 100 points for a total evaluation
score of 800 points. The company scored 120 points, indicating deficiencies in
accountability, continuous improvement, and transparency. Due to the challenges
posed by the COVID-19 pandemic, the company chose to prioritize areas that can
be improved with minimal cost and bring added value to society, focusing on the
principles of process orientation, flow, and transparency. The Lean methodology
was implemented with the primary objective of enhancing the physical flow
within the polishing workstations and optimizing stock management. The project
team recognized that Lean Manufacturing is the most effective solution for
identifying non-value-added activities and improving overall workflow, provided
that the company is committed to eliminating various forms of waste within the
workshop.
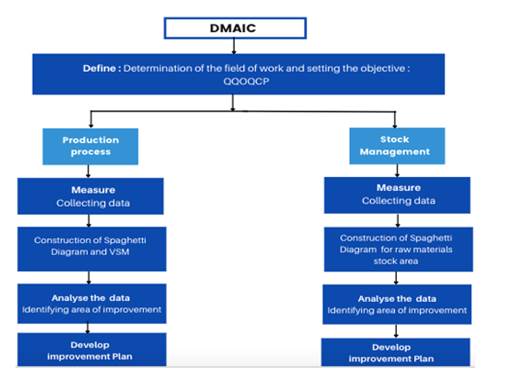
The DMAIC problem-solving methodology
has been selected to implement Lean Manufacturing like presented in the Figure 3.
Figure 3
|
Figure
3 The DMAIC Problem-Solving
Methodology |
3.1. Production line
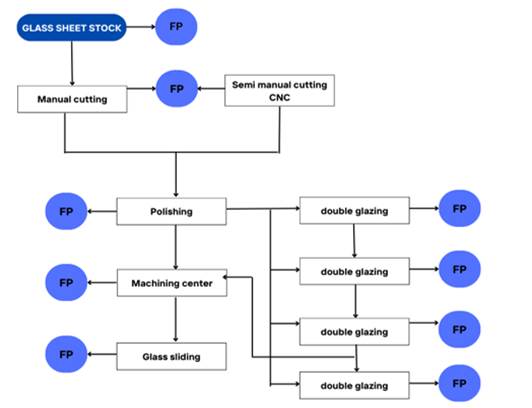
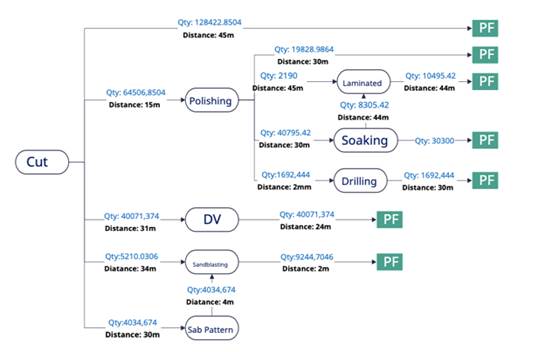
The first step is to observe the
production line and collect required information During the observation of the
production line we discovered the existence of different categories of products
that the company manufactures refer to the Figure 4 in which is represented all the process of the transformation of the
glass.
Figure 4
|
Figure
4 Glass Transformation Flow
Diagram |
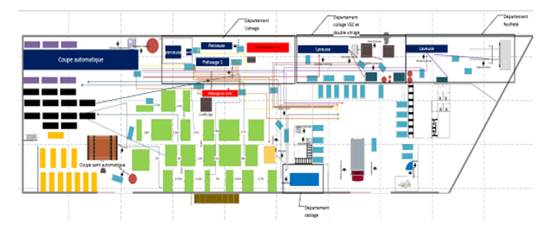
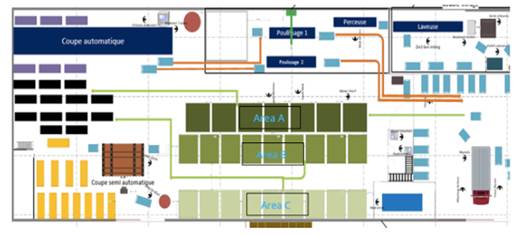
The initial layout of the production
departments has unveiled a series of challenges that warrant attention. The
primary focus was on analyzing the distance between each workstation, alongside
assessing production quantities and intermediate stock levels between each
process. This critical evaluation has been succinctly represented in the
diagram below, illustrating the spatial arrangement of workstations, the flow
of materials, and the accumulation of intermediate stocks.
Figure 5
|
Figure
5 Workstations Overview |
The Figure 5 illustrates that the automatic cutting machine serves as the main
machine in the factory, as all products go through it. The polishing station,
double glazing, sandblasting, and sandblasting pattern are directly related to
the cutting machine, while there is a significant distance between the stations
in relation to the quantity demanded. Taking the example of the double-glazing
department, it is located 31m away, and the sandblasting department is 34m
away. As shown by the spaghetti diagram (Figure 6), due to the flow intersections, operators spend between 10 and 15
minutes to bring a trolley with a frequency of 3 times per day, resulting in a
total of 45 minutes per day.
Based on this analysis, one can
observe the presence of a poor layout causes waste in
transportation, handling, and movement between workstations.
Figure 6
|
Figure
6 Diagram Spaghetti |
Among the problems encountered in the
production workshop is that of an imbalance between the production departments
and a high stock of work in progress (WIP) and given that the company does not
have any production monitoring indicators, we calculated the capacity of each
station to determine the bottleneck station by conducting timing assessments
for each workstation over a span of five days as shown the Table 1:
Table 1
|
Table 1 Workstation Capacity |
|||
|
Operations |
Machine capacity |
Number of machine |
Client orders |
|
Cut |
0.05 m/s |
1 |
0.045 LM |
|
Polishing |
0.002 m/s |
2 |
0.008 LM |
|
Double glazing
operation |
0.009 m/s |
1 |
0.005 LM |
|
Sandblasting |
0.003 m/s |
1 |
0.001 LM |
|
Drilling |
0.01 m/s |
1 |
0.0002 LM |
|
Lamination |
0.014 m/s |
1 |
0.0014 LM |
|
Soaking |
0.008 m/s |
1 |
0.005 LM |
Upon
analyzing the table, it becomes
evident that the capacity of the polishing machine falls short of meeting
customer demand. Furthermore, when comparing the capacities of the drilling,
laminating, and soaking processes with that of the polishing operation, it
becomes apparent that the latter is significantly lower. This discrepancy leads
to a substantial waiting time for work-in-progress inventory, as depicted in
the flow maps.
Consequently, the table uncovers the
presence of a bottleneck machine, namely the polishing machine.
From this analysis the focus was on
developing a comprehensive Value Stream Map (VSM) tailored specifically to the
polishing process. This strategic approach enables to
gain a deep understanding of the current state of affairs,
pinpoint areas of inefficiency, and identify opportunities for improvement.
For the polishing workstation, the
manufacturing time for a specific number of pieces was tracked, along with
calculating the linear meterage of each piece. Subsequently, the capacity of
each workstation in meters per second was determined.
All the data collected will be
presented in the tables below (Table 2) and (Table 3).
Table 2
|
Table 2 Surface Measurement
for the Glass Sheet |
|||
|
Number of glass sheet |
Lenghth |
Width |
LM |
|
1 |
0.947 |
0.662 |
3.218 |
|
2 |
0.947 |
0.912 |
3.718 |
|
3 |
0.14 |
2 |
4.28 |
|
4 |
1.16 |
0.78 |
3.88 |
|
5 |
1.16 |
0.78 |
3.88 |
|
6 |
1.16 |
0.78 |
3.88 |
|
Sum |
22.856 |
||
Table 3
|
Table 3 Timing Measurement |
|
|
|
|
|
|
|
|
Operation |
1 |
2 |
3 |
4 |
5 |
6 |
Average Value Added |
|
Verification of the dimensions
of the piece |
12 |
||||||
|
Placement of the piece on
the machine |
6 |
6 |
15 |
10 |
7 |
6 |
|
|
Passage of the piece on the
conveyor |
11 |
17 |
6 |
17 |
26 |
11 |
|
|
Polishing operation on the
side (Width) |
70 |
78 |
50 |
50 |
71 |
72 |
6,51,66,66,667 |
|
Passage of the piece on the conveyor |
15 |
17 |
15 |
18 |
24 |
23 |
|
|
Return and placement of the
piece on the machine |
10 |
14 |
17 |
15 |
15 |
12 |
|
|
Passage of the piece on the
conveyor |
17 |
10 |
9 |
11 |
28 |
14 |
|
|
Polishing operation on the
side (Length) |
78 |
78 |
54 |
51 |
81 |
80 |
7,03,33,33,333 |
|
Passage of the piece on the
conveyor |
11 |
17 |
15 |
13 |
21 |
9 |
|
|
Return and placement of the
piece on the machine |
17 |
20 |
23 |
14 |
11 |
15 |
|
|
Passage of the piece on the
conveyor |
22 |
9 |
11 |
8 |
18 |
11 |
|
|
Polishing operation on the
side (Width) |
70 |
77 |
53 |
81 |
70 |
70 |
7,01,66,66,667 |
|
Passage of the piece on the
conveyor |
10 |
17 |
16 |
18 |
23 |
24 |
|
|
Return and placement of the
piece on the machine |
14 |
14 |
26 |
15 |
15 |
9 |
|
|
Passage of the piece on the
conveyor |
20 |
12 |
11 |
13 |
11 |
14 |
|
|
Polishing operation on the
side (Length) |
78 |
77 |
54 |
81 |
81 |
81 |
7,53,33,33,333 |
|
Convyor |
16 |
12 |
6 |
20 |
12 |
33 |
|
|
Return and placement of the
piece on the machine |
13 |
||||||
|
Polishing operation |
70 |
70 |
|||||
|
Passage of the piece on the
conveyor |
36 |
||||||
|
Placement of the finished
product on the glass transport and storage trolley |
8 |
10 |
35 |
6 |
13 |
6 |
|
|
Sum of the operations |
485 |
485 |
416 |
441 |
527 |
585 |
Sum of AV |
After implementing all necessary
measures, the Value Stream Mapping (VSM) for the polishing process was
designed. This map involved every step of the polishing operation, from the
initial preparation of materials to the final placement of the finished product.
By visualizing the entire value stream. Each stage was carefully analyzed to
identify potential inefficiencies, bottlenecks, and opportunities for
improvement. The VSM is represent in Figure 7.
Figure 7
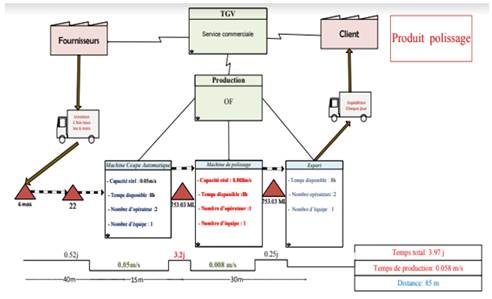
|
Figure
7 Value Stream Mapping (VSM) of
the Polishing Process |
The analysis of the indicators has
revealed the following issues:
·
Problems with departmental
layout.
·
Poor synchronization
between all positions, resulting in a significant gap between the capacities of
each position and consequently, high waiting time for work-in-progress stocks.
·
The polishing machine is
causing a bottleneck at the workstation.
·
The production time for
the laminated product is very high due to the polishing machine and the
subcontractor's delivery delay (dipping operation).
With the identification of the
polishing station as the bottleneck within the production line, the improvement
plan is strategically oriented towards optimizing the flow process at this
critical juncture. Recognizing the pivotal role that efficient polishing
operations play in the overall productivity and output of the manufacturing
process, the primary objective is to streamline and enhance the flow of work
specifically within the polishing stage.
3.2. Stock
management
The storage areas at the production workshop level present
problems at the level of Organization and administrative tasks, flows and risks
for the employees.
The main objective must be the organization and optimization
of storage station flows so that they generate real added value in the
production process.
The storage area for raw materials consists of various models
of glass sheets that are stored in wooden boxes. These boxes have a width of 30
cm and a height of 2.5 m. The number of glass sheets in each box varies
depending on the model, ranging from 13 to 31 sheets as represented by the
green zone in the Figure 8.
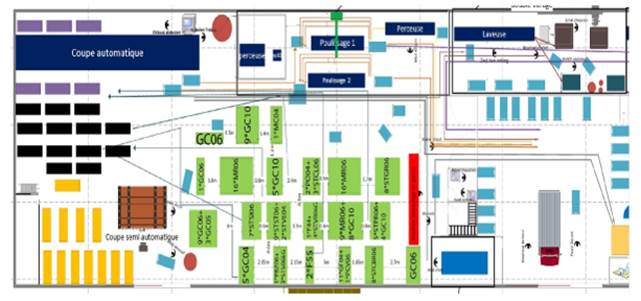
In order to gather accurate data, we measured
the distances between the wooden boxes and the passageways, as well as the time
it takes for the operator to handle and transport the glass sheets from the
warehouse to the cutting stations. These measurements were crucial in
determining the efficiency of our operations.
By carefully analyzing these
factors, we aim to enhance our storage system, streamline our processes, and
ultimately improve overall productivity.
Figure 8
|
Figure
8 Spagetti Diagram of Glass Sheet
Stroage |
According to the spaghetti
diagram show different problems:
·
There is a
crossing of flows between the boxes, since the storage
trestles are not well arranged. Additionally, the crossover between the storage
flow and the polishing machine flow.
·
The boxes of
glass sheets presented by the green color are not organized according to any
classification despite the existence of all the names of the models. The distance between each trestle is different which has caused a disorder in terms of stock but
also the spaces for handling and moving the boxes are very narrow which shows a
loss considerable time.
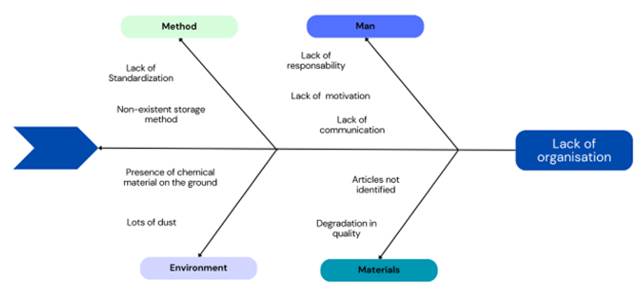
The next step is to analyze
the various issues encountered in the maintenance store and mezzanine storage
areas, the 5M method was employed. This method helped identify the root causes
of the problems (Figure 9) and facilitated their resolution.
Figure 9
|
Figure
9 Ishikawa Diagram (Storage Areas) |
The analysis reveals several
key issues contributing to the inefficiencies in stock management:
·
Inadequate Space Utilization: Storage
areas are not optimized for maximum capacity utilization, leading to wasted
space and congestion.
·
Poor Organization: Items are haphazardly stored
without a coherent organizational system, making it difficult to locate and
retrieve specific items promptly.
·
Absence of Standard Operating Procedures (SOPs): The
absence of clear SOPs for stock management leads to inconsistency and confusion
among staff members
·
Poor Organization: Items are haphazardly stored
without a coherent organizational system, making it difficult to locate and
retrieve specific items promptly leads to inconsistency and confusion among
staff members.
3.3. Improvement
plan
Optimizing operations within the production workshop,
it's imperative to address not only the efficiency of the production line but
also the effectiveness of stock management. This section outlines comprehensive
improvement plans for both aspects, aiming to streamline processes, minimize
waste, and maximize productivity. Those tables below represent the improving
plan for both production workshop and stock management.
Table 4
|
Table 4 Improving Plan (Production Flow) |
|
|
Problems detected |
Improving actions |
|
- Wasted Operator
Travel: The existing layout requires operators to traverse
unnecessary distances between workstations, resulting in wasted time and
energy. - Crossing of Flows:
Inefficient arrangement of machinery and workstations leads to the
unnecessary crossing of material flows within the department, increasing the
risk of congestion and delays. - Productivity Impacts:
Cumulative effects of inefficient layout contribute to decreased
productivity, higher operational costs, and potential quality issues. |
1. Machinery Reconfiguration Optimize the placement of
polishing machinery and equipment to minimize the distance traveled by
operators and reduce processing times. Consider reconfiguring the
layout to create a more linear workflow, allowing materials to move
seamlessly from one workstation to the next without unnecessary detours. 2. Employee Involvement Involve frontline employees
in the layout redesign process to leverage their insights and expertise. 3. Continuous Monitoring and Improvement Encourage a culture of continuous improvement within the polishing
department, where employees are empowered to propose innovative ideas and
solutions for enhancing efficiency. |
|
Machine Downtime: The unexpected stoppage of the second polishing machine halts the
production process, leading to delays and potential loss of productivity. Bottleneck Formation: The idle second polishing machine creates a bottleneck in the production
line, causing congestion and impeding the smooth flow of work. Operational Disruptions: The impact of machine
downtime extends beyond immediate production delays, affecting downstream
processes and overall operational efficiency. |
1. Repair of the Second Polishing Machine Promptly initiate the repair
process for the malfunctioning second polishing machine to minimize downtime
and resume normal production operations. 2. Improved Value Stream
Mapping (VSM) |
Table 5
|
Table 5 Improving Plan for Storage Areas |
|
|
Problems |
Improving actions |
|
- Inadequate Space
Utilization: Storage areas are not optimized for maximum capacity utilization, leading
to wasted space and congestion. - Poor Organization: Items are haphazardly stored without a coherent organizational system,
making it difficult to locate and retrieve specific items promptly. - Absence of Standard
Operating Procedures (SOPs): The absence of clear SOPs for stock management leads to inconsistency
and confusion among staff members |
1. Implementation of 5S Practices a) Sort: Remove unnecessary items from the storage spaces, disposing items that are no longer needed. b) Set in order: Establish a systematic storage system, organizing items in a logical and
accessible manner to maximize space and facilitate easy retrieval. c) Shine: Clean and maintain the storage areas regularly to ensure a safe and
hygienic working environment. d) Standardize: Implement standardized procedures for storing and
accessing items including labeling systems and storage protocols. e) Sustain: Develop a plan for ongoing maintenance and monitoring to sustain the
improvements achieved through the 5S practices. 2. Maximizing Storage
Capacity for the glass sheet Implementation of the ABC
method to standardize the stock of glass sheets, optimizing inventory levels,
and improving efficiency. 3. Optimization of Flow
Crossings Redesign layout and pathways to minimize unnecessary crossings and
optimize material flow, enhancing efficiency and reducing the risk of
accidents or delays. |
The following section will comprehensively present all
results achieved and improvements attained as a direct consequence of the
implemented actions aimed at enhancing efficiency and optimizing operations.
4.
Results and
discussion
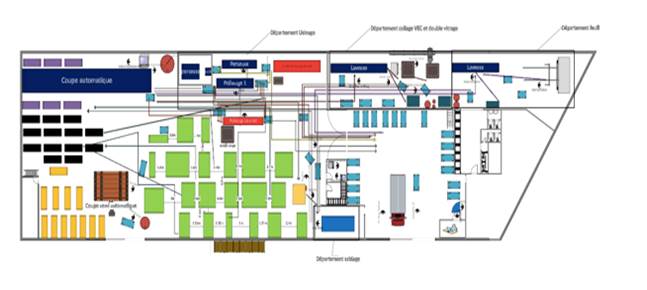
The implementation of the new layout in the machining
department has yielded several significant improvements. Most notably, the
restructuring has successfully eliminated the crossing of flows within the
department, a previously persistent issue contributing to inefficiencies and
waste. By streamlining the flow of materials and activities, we anticipate a
notable reduction in waste generation, thereby enhancing overall productivity
and cost-effectiveness. Moreover, the reconfigured layout has provided additional
space for storing trolleys adjacent to the machines, optimizing accessibility,
and facilitating smoother workflow operations. Additionally, the relocation of
the second polishing machine has resulted in the liberation of the corridor
space, creating a safer and more navigable environment for operators
maneuvering with trolleys. This newfound spatial freedom has had a tangible
impact on operational efficiency, notably reducing the delivery time of
trolleys from the cutting machine to the double glazing
department. (Figure 9)
Figure 10
|
Figure
10 Diagram Spaghetti After the Improvement Action |
Following the implementation of these initiatives,
improvements were expected within the Value Stream Mapping (VSM). In the
subsequent section, a thorough comparison was made between the indicators of
the value flow map of the polishing station before and after the application of
the improvements (Table 6).
Table 6
|
Table 6 Comparison Between
the Different Indicators Before and After the Improvement |
||
|
Indicator |
Initial
state |
Current state |
|
Production
capacity of the two polishing machines ML/days |
57.6 |
230.4 |
|
Number
of operators for one polishing machine |
2 |
1 |
|
Production
lead times for polishing products |
13.77d |
0 m2 |
|
Production
lead times for laminated products |
17,509day |
3.97 day |
|
Production
lead times for drilling products |
4.106d |
1.695 day |
|
Crowded
space in front of the polishing machine |
48m2 |
8.689 day |
The implementation of 5S principles has brought about
significant improvements in the efficiency and organization of store storage
and the mezzanine area.
·
Time savings: previously, employees spent
approximately 10 minutes searching for items, tools, or spare parts up to 10
times a day. With the 5S improvements, this time has been reduced to just 3
minutes, resulting in a daily time saving of 1 hour and 50 minutes, a remarkable
gain of 80%.
·
Elimination of losses: poor organization led to 10% of
items being unable to be found, necessitating replenishment of stock. However,
with all items now identified and visible, and with the store manager having a
tracking log for stock status, losses due to misplaced items have been
effectively eliminated.
·
Preservation of lifetime of
articles: items previously subjected to
dust and dirt suffered from degradation in quality, and clutter resulted in
destruction of some parts and tools. However, through the implementation of 5S,
all items and tools are now cleaned, well-maintained, and stored appropriately,
minimizing the risk of damage, and prolonging their lifetime.
·
Time
and Risk Reduction:
the previous lack of organization led to wasted time searching for items, while
cluttered spaces posed risks to employee safety. However, with improved
organization and easy access to desired items, time is saved, and the risk of
accidents is minimized.
The redesign of the storage space for
glass sheets, coupled with the implementation of the ABC method, has led to
several notable improvements.
1) Gain #1: Maximizing storage capacity
By strategically applying the ABC
method, we were able to categorize glass sheets based on their value and
importance, allowing us to allocate storage space accordingly. High-value
sheets are stored in easily accessible areas, while low-value sheets are placed
in less accessible locations. This optimized arrangement maximizes the
utilization of available space, ensuring that every square inch is utilized
efficiently.
2) Gain #2: Minimization of risks
The redesign of the storage space has
resulted in the creation of a new corridor, providing operators with ample room
to maneuver safely. This not only reduces the risk of work accidents but also
mitigates the risk of material loss due to breakage of glass sheets. With more
space to work in, operators can handle materials more safely and securely,
minimizing the likelihood of accidents and costly damages.
3) Gain #3: Reduction in handling times
The implementation of the ABC method
and redesign of the storage space have also resulted in a significant reduction
in handling times. The new storage layout, guided by the ABC categorization,
ensures that high-value items are easily accessible, reducing the time required
to locate and retrieve them. Additionally, the new organizational flow,
depicted in the updated "spaghetti" diagram, highlights the
improvement in material flows. With the absence of crossings and the presence
of a continuous flow, materials can move seamlessly through the production
process, reducing handling times and improving overall efficiency refer to Table 7 and Figure 10.
Table 7
|
Table 7 Measurement of Distance and Time After Improvement Actions |
|||
|
Distance |
Time |
||
|
Before |
After |
Before |
After |
|
53 |
39 |
25 |
10 |
|
42 |
33 |
21 |
10 |
|
49 |
27 |
24 |
8 |
|
25.2 |
21 |
16 |
8 |
|
19.6 |
17 |
11 |
8 |
|
15.9 |
8.2 |
9 |
8 |
|
25.3 |
12.6 |
10 |
8 |
Figure 11
|
Figure
11 The Current State of the
Production Manufacturing |
To effectively demonstrate the
impact of improvement actions from the initial state to the final state, a
comprehensive reassessment was conducted of Lean principles that were targeted
in the initiatives of the project. Through this reassessment, the objective was
to provide a clear visualization of the progress achieved. The results revealed
a significant improvement in the evaluation scores, which increased from 120 to
154 out of a total of 800 points.
This notable increase
underscores the effectiveness of the improvement actions undertaken,
highlighting tangible advancements in operational efficiency, process
optimization, and adherence to Lean principles.
5.
Conclusion
and prespectives
This paper presents a
practical application of Lean Manufacturing utilizing the DMAIC approach, a
concept often associated with Six Sigma methodologies. Through the
implementation of Lean principles, notable improvements were achieved across
various aspects of the production workshop. The optimization of physical flows
within the workshop layout led to a significant reduction in unnecessary
travel, enhancing efficiency. Additionally, the application of 5S resulted in
improving and optimizing the stock management and work organization.
Furthermore, these enhancements contributed to a positive impact on the working
environment, fostering motivation and employee engagement.
As the future of this project
is considered, several prospects emerge. One potential area of focus is the
implementation of Total Productive Maintenance (TPM) programs can optimize,
this proactive approach can help minimize downtime and ensure optimal equipment
performance. Additionally, using the concept of Just-in-Time (JIT) inventory
management to minimize waste and inventory holding costs, while establishing a
production schedule could aid in reducing work-in-progress inventory and
promoting synchronization between workstations.
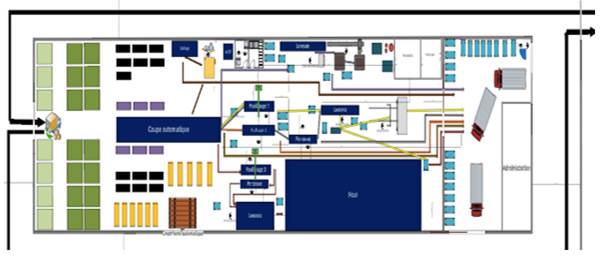
A
comprehensive proposal for the enhancement of production manufacturing has been
put forth to the company, aimed at streamlining operations and optimizing
workflow while simultaneously improving working conditions. This proposed plan (Figure 11) encompasses a
multifaceted approach, addressing various aspects of the production process to
drive efficiency and effectiveness. Central to the proposal is the optimization
of flow within the production line, achieved through strategic layout
adjustments, workflow reorganization, and the implementation of lean
principles. By reconfiguring the layout and redefining workflow sequences, the
aim is to minimize bottlenecks, reduce cycle times, and enhance overall
productivity. The ultimate goal of this proposal is to create a more efficient,
productive, and employee-friendly manufacturing environment that fosters
continuous improvement and sustainable growth. Through careful planning,
implementation, and monitoring, the company can expect to realize significant
benefits in terms of operational efficiency, product quality, and employee
satisfaction.
Figure 12
|
Figure 12 Proposal of New Workstations
Layout |
CONFLICT OF INTERESTS
None.
ACKNOWLEDGMENTS
None.
REFERENCES
Andersson, R., Eriksson, H., & Torstensson, H. (2006). Similarities and Differences Between TQM, Six Sigma and Lean. The TQM Magazine, [E-Journal] 18(3), 282-296. https://doi.org/10.1108/09544780610660004
Dekier, L. (2012). The Origins and Evolution of Lean Management System. Journal of International Studies, 5(1), https://doi.org/10.14254/2071-8330.2012/5-1/6
Dossou, P., & Dedeban, G. (2016). Using DMAIC for Making Sustainable Supply Chain Efficient in a GRAI Environment. In Ecoproduction, 63-85. https://doi.org/10.1007/978-3-319-46451-0_5
Gupta, N. (2013). An Application of DMAIC Methodology for Increasing the Yarn Quality in Textile Industry. IOSR Journal of Mechanical and Civil Engineering, [E-Journal] 6(1), 50-65. https://doi.org/10.9790/1684-0615065
Jerry, K. (2003). LEAN Principles, Manufacturing Extension Partnership. Utah: Manufacturing Extension Partnership.
Kumar, N., Hasan, S. S., Srivastava, K. V., Akhtar, R., Yadav, R. K., & Choubey, V. K. (n.d.). Lean Manufacturing Techniques and Its Implementation: A Review. Materials Today: Proceedings, 64, 1188-1192. https://doi.org/10.1016/j.matpr.2022.03.481
Liker, J.K. (2004). The Toyota Way: 14 Management Principles from the World's Greatest Manufacturer. New York: McGraw-Hill.
Loyd, N., Harris, G. A., Gholston, S., & Berkowitz, D. (2020b). Development of a Lean Assessment Tool and Measuring the Effect of Culture from Employee Perception. Journal of Manufacturing Technology Management, 31(7), 1439-1456 https://doi.org/10.1108/JMTM-10-2019-0375
Mostafa, S., Chileshe, N., & Abdelhamid, T. S. (2016). Lean and Agile Integration within Offsite Construction using Discrete Event Simulation. Construction Innovation: Information, Process, Management, 16(4), 483-525. https://doi.org/10.1108/CI-09-2014-0043
Palange, A., & Dhatrak, P. (2021b). Lean Manufacturing a Vital Tool to Enhance Productivity in Manufacturing. Materials Today: Proceedings, 46, 729-736. https://doi.org/10.1016/j.matpr.2020.12.193
Panagos, P., Ford, A. L., Williams, J. A., Khoury, N., Sampson, T., McCammon, C., & Lee, J. M. (2012, February). Abstract 175: Applying Toyota Lean Manufacturing Principles to Stroke Care: Accelerating Door-to-Needle times. Stroke, 43. https://doi.org/10.1161/str.43.suppl_1.A175
Popov, I., Jenner, D., Todeschini, G. and Igic, P. (2018). Use of the DMAIC Approach to Identify Root Cause of Circuit Breaker Failure. In: 2018 International Symposium on Power Electronics, Electrical Drives, Automation and Motion (SPEEDAM). Amalfi: IEEE. 996-1001. https://doi.org/10.1109/SPEEDAM.2018.8445417
Romvall, K., Wiktorsson, M., & Bellgran, M. (2010). Competitiveness by Integrating the Green Perspective in Production – A Review Presenting Challenges for Research And Industry.
Rüttimann, B. G., & Stöckli, M. T. (2016). Lean and Industry 4.0-Twins, Partners, or Contenders? A Due Clarification Regarding the Supposed Clash of Two Production Systems. Journal of Service Science and Management, 09(06), 485-500. https://doi.org/10.4236/jssm.2016.96051
Rüttimann, B.G., & Stöckli, M.T. (2016). Going Beyond Triviality: The Toyota Production System-Lean Manufacturing Beyond Muda and Kaizen. Journal of Service Science and Management, [E-Journal] 09(02), 140-149. https://doi.org/10.4236/jssm.2016.92018
Salonitis, K., & Tsinopoulos, C. (2016). Drivers and Barriers of Lean Implementation in the Greek Manufacturing Sector. Procedia CIRP, 57, 189-194. https://doi.org/10.1016/j.procir.2016.11.033
Sharaf, I. (2019). Six Sigma DMAIC Methodology: A Powerful Tool for Improving Business Operations. https://doi.org/10.4028/www.scientific.net/AMR.488-489.1147
Shingō, S., & Dillon, A.P. (1989). A Study of the Toyota Production System from an Industrial Engineering Viewpoint. Rev. ed. Cambridge: Cambridge Mass Productivity Press.
|
|
 This work is licensed under a: Creative Commons Attribution 4.0 International License
© IJETMR 2014-2024. All Rights Reserved.