
|
|
|
|
EDUCATION IN CIVIL ENGINEERING THROUGH JOURNALS PUBLICATIONS: THE RELATION BETWEEN THE PUBLICATION TIME AND ITS REGIONAL RANKINGS
Oluwasegun Emmanuel 1![]()
![]()
1 M.Sc.,
Department of Materials Engineering and Construction Processes, Wroclaw
University of Science and Technology, Wybrzeże Wyspiańskiego 27, 50-370 Wroclaw, Poland
|
|
|
ABSTRACT |
|
|
The fast and
quality dissemination of research breakthroughs via journals is essential to
the researchers. Hence, this study analyzed the average duration for Civil
Engineering journals based on the points allocations in Poland’s Ministry of
Science and Higher Education (MEiN) list. A total
of 30 journals were randomly selected and grouped based on the regional
points allocation. The date of submission to the date of acceptance (SA) and
the date of acceptance to the date of publication (SP) were extracted from
3557 articles. Version 26 IBM Statistical Packages for Social Sciences (SPSS)
was used to analyze the average duration for the dataset. Multivariate
Analysis of Variance (MANOVA) was used for the analysis of the relationship
between the points allocation and the Scopus impact factors (IF), Web of
Science impact factors (WoS IF), source normalized
impact per paper (SNIP), SA, and SP. The results show that the average
duration SA and SP for journals with 200, 140, and 100 points within the 5
years are 305.28, 285.25, 317.93 days, respectively, while for journals with
70, 40, and 20 points, the average duration is 180.50, 324.60, 206.41 days.
Further analysis shows a statistically significant difference between the
Scopus IF, WoS IF, SNIP, and allocated points. They
indicate that these journal metrics affect journal categorization. |
|||
|
Received 19 July 2023 Accepted 20 August 2023 Published 04 September 2023 Corresponding Author Oluwasegun
Emmanuel, oluwasegun.emmanuel@pwr.edu.pl DOI 10.29121/ijetmr.v10.i8.2023.1358 Funding: This research
received no specific grant from any funding agency in the public, commercial,
or not-for-profit sectors. Copyright: © 2023 The
Author(s). This work is licensed under a Creative Commons
Attribution 4.0 International License. With the
license CC-BY, authors retain the copyright, allowing anyone to download,
reuse, re-print, modify, distribute, and/or copy their contribution. The work
must be properly attributed to its author.
|
|||
|
Keywords: Article, Average Duration, Education, Impact Factor, Ministry of Science and Higher Education, Research, Points, Source Normalized Impact Per Paper |
|||


1. INTRODUCTION
Pre-college is an academic experience that aids high school
students to prepare in transition for the college life. Research publication is
not a common phenomenal at this phase of the students’ career. Though, these
students are more likely to pursue a career in engineering after completing
their pre-college studies according to Miller et al. (2020). The task at
this level is tailored towards commitment to research, collaboration, and
engineering literacy with the objective of greater command of the engineering
design, awareness, and capacity for teaching Marshall & Berland (2012). University
education in civil engineering on the other hand focuses on the exploration,
implementation, and exploitation of innovation using a systematic approach,
such as information technology, energy, and transportation systems. After
obtaining both theoretical and practical research knowledge, graduates in this
discipline are awarded a scientific degree.
Research is often a slow process, requiring careful design,
optimization, and replication of experiments. When enough data has been
obtained to write a manuscript, researchers will likely want to publish it as
soon as possible. The rapid publication can accelerate the dissemination of
results, reduce the chances of being scooped, and allow a faster return to the
laboratory to work on the subsequent study. Most National Science Centre
competitions operate based on April 30, 2010, Act, where scientific publications
are part of the evaluated criteria for researchers applying for grants,
internships, and projects.
More than 1.5 million scholastic articles in various academic
fields are published annually, according to a survey by Elsevier; therefore,
peer review becomes a prominent instrument for determining which research
should be brought to the attention of other researchers. In 2021, Elsevier
published over 600,000 peer-reviewed papers, which was an increase of 89%
greater than total ten years ago. Some journals are published on the internet
and while others have a combination of internet publication and the hardcopy.
Several articles have been published on delays in the publication of scientific
materials Björk & Solomon (2013),
Dong
et al. (2006). Publication delays for scholarly articles may
be lengthy or brief. In his research, Haustein
(2012) considered brief
delays as a quality indicator demonstrating the relevance of scientific
journals.
In a world, full of information emanating from several publications, it is imperative that standard for measuring the impact of these publications be established. The journal metrics are important for the evaluation and selection of the quality of journal to publish in. These metrics are published on a yearly basis in the websites of major journal databases e.g., Scopus, google scholars and WoS. According to Elsevier. (2023a), some of the journal metrics outlined are citescores, SCImago Journal Ranking (SJR), SNIP, Journal Impact Factor (JIF) etc. In this study, the authors will test the hypothesis that there is a relationship between the MEiN points allocation and journal metrics (WoS IF, Scopus IF, SNIP, citescore, SJR) etc.
This study examine the average
duration of article publication and their point allocation in the Polish Ministry
of Science and Higher Education. The following objectives will be achieved:
·
Determine the average duration of article publication from
manuscript submission to publication by examining the points listed.
·
Examination of the relationship between journal metrics (WoS IF from the journal citation report (JCR), Scopus, SNIP
etc. and the points allocated in the MEiN list.
The
novelty of this study was that it analyzes the
duration of publication and the points apportioned in civil and
transport-engineering journals listed. In contrast, the relationship between
some journal metrics and the points allocated is examined. This study will help
pre-college students and researchers select an efficient and quality journal
for their manuscripts. At the same time, the Ministry of Science and Higher
Education can review the points allocated. This study was limited exclusively
to Civil engineering and transport areas of specialization. Hence,
professionals in different branches of this field were the respondents.
2. LITERATURE REVIEW
2.1. Civil Engineering
Education and Research
According to Zhao et al. (2018), engineering innovation and training platform is described as an open ecosystem with university, students and organization as a unified entity that collaborate. The need for interaction between the industry and the civil engineering training has become important Chakrabarti (2016). Gamayunova (2015) in a proceeding, reiterate that academic reputation of institutions is characterized based on the number of applicants and scientific activities carried out in different areas of the department. In making the results of academic researchers visible, institutions have encouraged their teachers to register their works in various scientific databases.
The sustainability of engineering education is dependent on the commitment of key management through the integration of several levels of the university structure Sigahi & Sznelwar (2023). De Bronstein et al. (2023), described the role of higher education in the development of future engineers as transformational agent. In their study, they affirm that sustainability and entrepreneurial skill should be the basic element for students to obtain the methodical approach to the challenges of humanity. The introduction and use of teaching tools and application e.g., CAD, virtual reality, augmented reality etc. in the field of civil engineering will aid research work and provide support for the engineers Sampaio et al. (2010).
2.2. Concept of
Peer-Review
According to the Cambridge dictionary, peer review is the
process of a scientist or expert in the same field perusing, evaluating, and
commenting on the work of another scientist or expert in the same field, or the
product of this process. Prior to publication, peer review is a proved method
for evaluating the quality of research and its presentation. Editors and
evaluators with extensive expertise in the relevant field who are anonymous and
highly competent evaluate the submitted manuscripts. The validity and
originality of the manuscripts are evaluated on multiple levels. The primary
objective is to publish a ground-breaking article in its field of study. In
addition, it provides authors with feedback to enhance the content of their
research papers prior to publication. The peer review process evaluates the
validity, significance, and originality of the work, as opposed to the author.
Elsevier in their write up, grouped peer-review into single, double, triple
anonymized and open reviews with the general aim of achieving transparency Elsevier. (2023b). In the Guardian
news report of 7th May 2015, peer review is described as a complex
exercise carried out by busy people. This sometimes contribute to the imperfect
process.
In the opinion of Spier (2002), peer review is described as a turf battle with the grand prize of knowledge, science, and doctrine being published. Journal peer review has a variety of primary goals. One is to determine whether a work fulfils the requisite quality and originality standards for publication in a particular journal Mayden (2012) following its mission and editorial policies. In other words, the peer review process aims to provide a quality mark that can serve as an indicator of trustworthiness for non-expert readers Jubb (2016). Kelly et al. (2014) Peer review also aims to determine whether the paper will appeal to the journal's audience. Peer review has an essential curatorial function in which authors implement feedback from editors and peer reviewers to refine and improve their manuscript, sometimes as part of a lengthy and frequently iterative process.
2.3. Article
Publication Review Processes and Procedures
Publication timeliness is one of the most important factors authors consider when selecting a journal for manuscript submission. Publication schedules for submitted manuscripts vary by journal and field of study. Chen et al. (2013) in their study, divided the duration of publication into two segments; acceptance time which was described as the duration from first manuscript submission to acceptance. Here is where the peer review process actually takes place. The second segment is referred to as the publication time; from acceptance of manuscript to publication. Huth (1999) in his opinion stated that “quality of the article, novelty, features of the authors could have influence on the speed of publication” while he did not rule out completely that the reviewers may be responsible for the delays in the publication time. Taşkın et al. (2022) further corroborated this in their work on the factors affecting publication duration. They listed features of the authors, number of authors and countries of the researchers as the contributing factors of publication time.
Mohanty et al. (2021), in a study on the speed of publication in anaesthesiology journal noted that the average of 186 days is required for manuscript submission to publication. They also observed that there was no correlation between publication pace, impact factor (IF), and article publication fee (APC). Using a stratified random sample of 135 journals indexed in Scopus, Björk & Solomon (2013) examined the average waiting period in journals. They discovered that science, technology, and medicine have the minimum delays, while social sciences, humanities, business, and economics have the longest. Weak association was discovered between delays in publication times and the IF. Journal with high IF was observed to have a lower delay times Sebo et al. (2019).
2.4. Overview of the
Polish Ministry of Science and Higher Education Journal List
The ministry was established in May 2006 to connect with
students, universities, and researchers. The ministry's management is under the
Minister of Education and Science, secretary of State, 4 Secretaries of State
for monitoring and implementing scientific reforms and higher education,
education functions, research institutes, development education and science,
and a general director. The ministry is currently divided into ten (10)
departments and several agencies, amongst which are National Centre for Research
and Development (NCBR), Polish National Agency for Academic Exchange (NAWA),
and National Science Centre (NCN).
In the bid to improve and encourage scientific activities, the ministry has the list of scientific journals, list of publishing houses with peer review monographs, finances for sciences, programs for scientific institutions, translations of new scientific achievements into English language. The first edition of the list of scientific journals was released on 13th July 2012 while the second edition was released on 25th January 2017 based on the comprehensive evaluation of the years 2013-2016. This was divided into 3 parts as shown in Table 1.
Table 1
|
Table 1 Inaugural Edition of the List of Scientific Journals (Mein, 2022) |
|||
|
Number of parts |
Basis for journal listed |
Number of journal listed (2012) |
Number of journal listed (2017) |
|
Part A |
Number of points for publication in scientific journals with an
impact factor in the database of Journal Citation Reports |
10,230 |
11,737 |
|
Part B |
Number of points for publication in scientific journals without
impact factor |
1,854 |
3,080 |
|
Part C |
Number of points for publication in scientific journals in the
European Reference Index for Humanities Database |
4,337 |
4,197 |
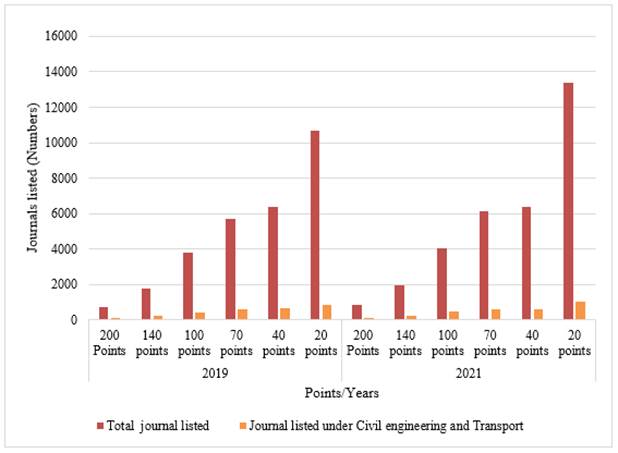
The Act of July 20, 2018- Article 267, section 3 of the Law on higher education and science (Journal of Law, item 1668 as amended), the third edition of the list of scientific journals with allocated points, was released in 2019. A total of 29,037 journals and 1639 conferences and seminars were listed. These journals were divided into Forty-four (44) specializations and grouped based on a point basis, as shown in Figure 1. In 2021, 3639 journals were added.
Figure 1
|
Figure 1 Comparison of the Total Number of Listed Journals and the Journals Under the Civil and Transport Engineering. |
3. MATERIALS AND METHODS
3.1. Pilot Survey
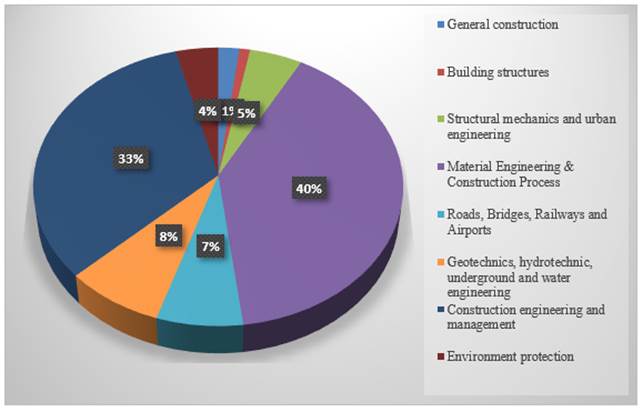
The field of Civil engineering and transport was segmented into different branches. A survey was carried out using questionnaire to determine the frequency of publication in different branches. A total of 100 Academicians and researchers in the field of civil engineering and transport within the country participated in the survey. From the results in Figure 2 the top five area of specializations chosen are; Material engineering, Construction engineering and management, Geotechnics and hydrotechnics, Roads and Bridges and Environment protection. The journals in these areas of specialization were randomly selected.
Figure 2
|
Figure 2 Area of Specialization |
3.2. Data Collection
The publication history of 30 leading journals under the specialization of Civil and transport engineering in the Polish MEiN list were searched. Each journals were categorized based on the point allocated in the MEiN. Five journals were randomly selected per each point category. The selected journals are indexed in the Scopus and WoS databases. All articles approved for publication between January 1, 2017, and December 31, 2021, were listed. For each article, the authors extracted the total number of days between the date of manuscript submission to the journal and the date of acceptance. In addition, the number of days between the date of acceptance and the date of paper publication (print) or publication online was also extracted.
Articles lacking these dates and non-research articles
(e.g., letters to the editor, comments, errata, notes, forum, etc.) were
excluded. 24 articles were chosen at random based on the number of issues per
year. In this case, two articles were selected at random from journals with 12
issues per year, while 6 articles were selected at random from journals with 4
issues per year. In journals with less than 24 articles per year, all articles
within the year are selected. At the end of the collation, 3557 articles
containing the required information were searched. Additionally,
five years IF, SNIP, citescores, the number of
citations per year for each journals were obtained
from the Scopus database while the IF for the JCR were obtained from the WoS database.
3.3. Data Analysis
The average duration was calculated using Equation 3-1. The data was obtained from the submission date to the date of acceptance (SA) for each article, and the same was done from the date of acceptance to the publication date (SP). The average duration for each year was calculated as shown in Table 2 and IBM SPSS version 26 was used to evaluate the data.
![]() (3-1)
(3-1)
Where:
A -Mean of the duration
n – Number of values
ai- Dataset values
Table 2
|
Table 2 5-Year Average Duration of Articles in Different Journals and Point Allocation |
|||||||||||
|
Points |
Journals |
2017 (SA) |
2017 (SP) |
2018 (SA) |
2018 (SP) |
2019 (SA) |
2019 (SP) |
2020 (SA) |
2020 (SP) |
2021 (SA) |
2021 (SP) |
|
|
A |
71.25 |
12.96 |
41.96 |
24.21 |
95.21 |
25.58 |
171.13 |
10.33 |
203.33 |
28.33 |
|
|
B |
131.17 |
45.67 |
136.33 |
55.29 |
147.50 |
75.50 |
131.38 |
34.92 |
94.83 |
22.04 |
|
200 Points |
C |
143.92 |
36.50 |
142.17 |
42.63 |
146.33 |
34.13 |
207.75 |
48.38 |
198.04 |
40.38 |
|
D |
595.08 |
300.21 |
395.13 |
219.75 |
385.13 |
317.54 |
484.00 |
207.38 |
470.58 |
187.25 |
|
|
E |
140.92 |
33.67 |
214.00 |
36.67 |
167.46 |
41.83 |
325.67 |
38.42 |
421.54 |
50.83 |
|
|
|
F |
186.33 |
14.83 |
237.83 |
12.92 |
152.71 |
12.92 |
198.79 |
20.29 |
296.21 |
23.38 |
|
140 Points |
G |
266.83 |
41.42 |
270.13 |
18.21 |
394.38 |
18.50 |
281.38 |
19.88 |
235.50 |
21.71 |
|
H |
303.33 |
23.42 |
232.63 |
9.42 |
211.38 |
16.33 |
195.79 |
21.33 |
252.63 |
16.08 |
|
|
I |
310.17 |
22.58 |
246.42 |
17.88 |
282.71 |
26.54 |
320.38 |
29.04 |
244.54 |
34.96 |
|
|
J |
276.75 |
7.67 |
308.13 |
7.83 |
384.83 |
9.96 |
315.21 |
7.50 |
258.08 |
13.79 |
|
|
|
K |
293.00 |
14.33 |
281.54 |
13.17 |
253.46 |
19.58 |
281.88 |
11.83 |
296.46 |
12.63 |
|
100 Points |
L |
565.67 |
114.38 |
679.04 |
48.54 |
432.88 |
107.88 |
390.08 |
39.00 |
514.29 |
43.58 |
|
M |
180.79 |
78.46 |
155.42 |
120.88 |
183.04 |
151.13 |
194.50 |
131.75 |
196.38 |
105.75 |
|
|
N |
124.08 |
80.79 |
151.58 |
111.79 |
158.25 |
144.54 |
165.58 |
114.58 |
167.63 |
84.29 |
|
|
O |
145.79 |
3.46 |
131.92 |
5.08 |
144.46 |
8.54 |
107.00 |
18.71 |
152.67 |
16.42 |
|
|
|
P |
108.79 |
108.42 |
149.00 |
133.04 |
191.08 |
181.79 |
110.54 |
149.33 |
52.25 |
109.17 |
|
70 Points |
Q |
146.42 |
87.00 |
123.79 |
22.75 |
124.67 |
35.29 |
143.63 |
2.54 |
134.08 |
7.29 |
|
R |
50.50 |
23.38 |
75.54 |
56.54 |
65.63 |
46.92 |
104.54 |
69.08 |
130.21 |
63.50 |
|
|
S |
72.25 |
98.54 |
82.25 |
95.96 |
87.25 |
62.58 |
105.88 |
81.42 |
76.67 |
51.29 |
|
|
T |
171.67 |
21.88 |
186.00 |
17.71 |
145.04 |
20.83 |
147.63 |
21.04 |
129.67 |
30.46 |
|
|
|
U |
275.67 |
428.38 |
208.71 |
249.42 |
138.92 |
219.38 |
193.83 |
298.92 |
149.04 |
360.46 |
|
40 Points |
V |
107.75 |
61.92 |
84.83 |
119.42 |
91.33 |
99.25 |
148.42 |
95.58 |
165.75 |
75.63 |
|
W |
310.00 |
79.83 |
345.79 |
123.25 |
236.58 |
78.58 |
245.29 |
64.50 |
208.71 |
85.33 |
|
|
X |
244.83 |
49.96 |
135.13 |
32.67 |
191.67 |
19.13 |
379.83 |
20.96 |
172.96 |
30.13 |
|
|
Y |
166.88 |
127.92 |
160.08 |
189.33 |
127.42 |
133.58 |
159.88 |
108.29 |
222.92 |
91.04 |
|
|
|
Z |
114.83 |
108.46 |
78.38 |
111.71 |
119.83 |
118.42 |
89.13 |
76.04 |
72.00 |
55.13 |
|
20 Points |
AB |
60.67 |
9.88 |
63.21 |
11.50 |
105.88 |
36.33 |
97.67 |
59.79 |
108.33 |
15.63 |
|
AC |
151.83 |
105.04 |
200.25 |
72.71 |
171.00 |
165.96 |
218.42 |
125.67 |
156.04 |
189.04 |
|
|
AD |
198.38 |
12.50 |
221.67 |
56.38 |
240.75 |
60.54 |
280.33 |
108.67 |
272.38 |
94.13 |
|
|
AE |
50.08 |
26.21 |
79.29 |
12.96 |
118.17 |
16.63 |
81.25 |
20.96 |
120.38 |
19.79 |
|
|
SA |
Date of submission to
date of acceptance |
||||||||||
|
SP |
Date of acceptance to
the date of publication |
||||||||||
In achieving the second objective, the Multivariate Analysis of Variance (MANOVA) was used to show the relationship between the points, SA, SP, SNIP, Scopus IF, and WoS IF. The assumptions that precede the use of MANOVA were tested. There are 5 dependent variables and 1 independent variable with 6 categories. The presence of outliers was tested using linear regression; the Mahalanobis distance shows the presence of 1 outlier in the dataset. The scatterplot matrix was used to test the linearity of the dependent variables. An elliptical pattern was observed, as shown in Figure 3, depicting that the linearity test was passed.
Figure 3

|
Figure 3 Scatter Matrix Dot Plot for the Dependent Variables |
In Table 3, the multivariance normality test was done, the Shapiro-Wilk test has p<0.05 for Scopus IF, WoS IF, SA, SP showing that these dependent variables were not normally distributed while SNIP has p=0.066 which shows that the SNIP was normally distributed. The multi-collinearity test was carried out by examining the correlation between the dependent variables. The Pearson’s (r) is less than 0.99, which shows that there is no multi-collinearity between the variables though there seems to be some kind of relationship between the variables. Citescores and SJR were excluded from the analysis due to multi-collinearity.
Table 3
|
Table 3 Test of Normality |
||||||
|
Variables |
Kolmogorov-Smirnova |
Shapiro-Wilk |
||||
|
Statistic |
df |
Sig. |
Statistic |
df |
Sig. |
|
|
Scopus IF (2017-2021) |
0.179 |
30 |
0.015 |
0.919 |
30 |
0.025 |
|
Web of Sci IF (2017-2021) |
0.207 |
30 |
0.002 |
0.803 |
30 |
0.000 |
|
SNIP 2021 |
0.105 |
30 |
.200* |
0.935 |
30 |
0.066 |
|
SA 2021 |
0.137 |
30 |
0.159 |
0.867 |
30 |
0.001 |
|
SP 2021 |
0.190 |
30 |
0.007 |
0.774 |
30 |
0.000 |
|
*.
This is a lower bound of the true significance. |
||||||
|
a.
Lilliefors Significance Correction |
||||||
The assumptions for using MANOVA were not wholly met because of the Shapiro-Wilk result. Therefore, the authors selected Pillia’s Trace in the row for the MEiN for the analysis. The F (25, 120) =2.39, p=0.001; partial eta (Ƞ2 =0.333); for Pillia’s Trace as shown in Table 4, demonstrating that the one-way MANOVA was statistically significant. This shows a statistically significant difference across the levels of the independent variables (points) on a linear combination of the dependent variables (Scopus IF, WoS IF, SNIP, SA, and SP). Based on this result, the authors can reject the null hypothesis and conclude that the point allocation was significantly dependent on these variables. The effect size of 33.3% was large and the observed power was 0.998, showing that there was a 99.8% chance that the results could have been significant. Further evaluation was carried out to determine the categories in which the significance occurred using the post-hoc test.
Table 4
|
Table 4 Result of Multivariate Test |
|
||||||||
|
Effect |
Value |
F |
Hypothesis df |
Error df |
Sig. |
Partial Eta Squared |
Noncent. Parameter |
Observed Powerd |
|
|
Intercept |
Pillai's Trace |
0.963 |
102.827b |
5.000 |
20.000 |
0.000 |
0.963 |
514.136 |
1.000 |
|
Wilks' Lambda |
0.037 |
102.827b |
5.000 |
20.000 |
0.000 |
0.963 |
514.136 |
1.000 |
|
|
Hotelling's Trace |
25.707 |
102.827b |
5.000 |
20.000 |
0.000 |
0.963 |
514.136 |
1.000 |
|
|
Roy's Largest Root |
25.707 |
102.827b |
5.000 |
20.000 |
0.000 |
0.963 |
514.136 |
1.000 |
|
|
MEiN |
Pillai's Trace |
1.665 |
2.397 |
25.000 |
120.000 |
0.001 |
0.333 |
59.926 |
0.998 |
|
Wilks' Lambda |
0.061 |
3.411 |
25.000 |
75.799 |
0.000 |
0.429 |
56.908 |
0.993 |
|
|
Hotelling's Trace |
6.228 |
4.584 |
25.000 |
92.000 |
0.000 |
0.555 |
114.588 |
1.000 |
|
|
Roy's Largest Root |
4.966 |
23.836c |
5.000 |
24.000 |
0.000 |
0.832 |
119.181 |
1.000 |
|
|
a.
Design: Intercept + MEiN |
|||||||||
|
b.
Exact statistic |
|||||||||
|
c.
The statistic is an upper bound on F that yields a lower bound on the
significance level. |
|||||||||
|
d.
Computed using alpha = 0.05 |
|||||||||
The between-subject-effect test in Table 5 shows how the dependent variables (Scopus IF, WoS IF, and SNIP) differ from the MEiN allocated points. The authors observed from this table that the points allocated have a statistically significant effect on the Scopus IF (F (5, 24) =16.332; p<0.001; partial eta Ƞ2 =0.773), WoS IF (F (5, 24) =13.414; p<0.001; partial eta Ƞ2 =0.736) and SNIP (F (5, 24) =13.025; p<0.001; partial eta Ƞ2 =0.731). The authors noticed that the SA and SP are not statistically significant to the allocated points since p>0.05.
Table 5
|
Table 5 Test of Between-Subject-Effects |
||||||||
|
Source |
Type II Sum of
Squares |
df |
Mean Square |
F |
Sig. |
Partial Eta Squared |
Observed Powerf |
|
|
MEiN |
Scopus IF (2017-2021) |
242.369 |
5 |
48.474 |
16.332 |
0.000 |
0.773 |
1.000 |
|
WoS IF (2017-2021) |
552.729 |
5 |
110.546 |
13.414 |
0.000 |
0.736 |
1.000 |
|
|
SNIP 2021 |
27.610 |
5 |
5.522 |
13.025 |
0.000 |
0.731 |
1.000 |
|
|
SA 2021 |
93780.110 |
5 |
18756.022 |
2.008 |
0.114 |
0.295 |
0.567 |
|
|
SP 2021 |
31742.424 |
5 |
6348.485 |
1.394 |
0.262 |
0.225 |
0.405 |
|
|
Error |
Scopus IF (2017-2021) |
71.231 |
24 |
2.968 |
||||
|
WoS IF (2017-2021) |
197.788 |
24 |
8.241 |
|||||
|
SNIP 2021 |
10.175 |
24 |
0.424 |
|||||
|
SA 2021 |
224212.071 |
24 |
9342.170 |
|||||
|
SP 2021 |
109261.483 |
24 |
4552.562 |
|||||
|
Total |
Scopus IF (2017-2021) |
803.312 |
30 |
|||||
|
WoS IF (2017-2021) |
1268.986 |
30 |
||||||
|
SNIP 2021 |
139.817 |
30 |
||||||
|
SA 2021 |
1512358.808 |
30 |
||||||
|
SP 2021 |
289983.359 |
30 |
||||||
|
Corrected Total |
Scopus IF (2017-2021) |
313.600 |
29 |
|||||
|
WoS IF (2017-2021) |
750.516 |
29 |
||||||
|
SNIP 2021 |
37.785 |
29 |
||||||
|
SA 2021 |
317992.181 |
29 |
||||||
|
SP 2021 |
141003.907 |
29 |
||||||
|
f.
Computed using alpha = .05 |
||||||||
4. RESULTS AND DISCUSSIONS
4.1. Speed of journal publication
process and the MEiN points
The advantages of publishing in top journals are huge; high citescore, IF and in the case of Poland Ministry of Science
and Higher Education, allocation of points ranging from 200 to 20 points. The result
of this research shows a 5-year pattern in the duration of article publications
from SA. The average duration in the journals with 200, 140 and 100 points
within the 5-year period are 226.47, 266.52, 253.89 days respectively. While in
the journals with 70, 40 and 20 points, the average duration from SA within the
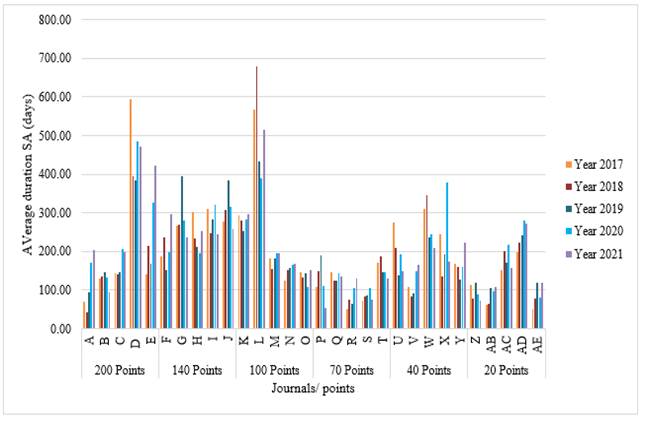
5-year period are 116.59, 194.89, 138.81 days respectively as shown in Figure 4. This shows that
the journals with the higher points have a higher tendency of been accepted
after over 200 days while the lower ranked journals could be accepted after 100
days.
Figure 4
|
Figure 4 Average Duration from Submission to Acceptance (SA) for Journals and the Allocated Points |
It was observed that journals in the branch of
transportation have the highest average duration for SA with 465.98, 289.64,
516.39, 122.33, 167.43, and 179.50 days for 200, 140, 100, 70, 40 and 20 points
respectively.
There is an irregular pattern in the average duration of SA
for the 200 points on a yearly basis ranging from 185.91 days in 2018 and
increases to 277.67 days in 2021. The journals considered within the 140 points
category have a regular pattern in the average
durations with the highest being 285.20 days in 2019 and 257.39 days in 2021.
The journals in the 100 points categories exhibit the same pattern as the 140
points. The average duration ranges from 227.81 days and 279.90 days. The lower
ranked journals show 104.57 days, 183.88 days, and 145.82 days for 70, 40 and
20 points in 2021 respectively.
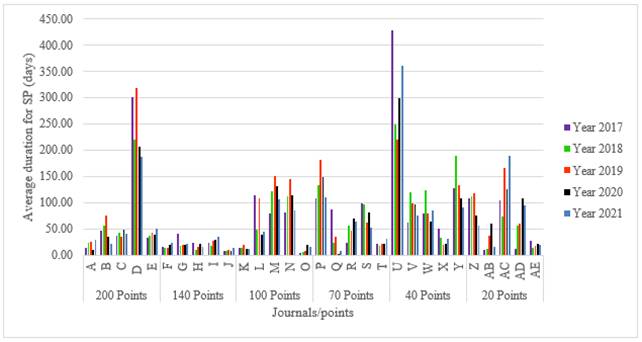
Apart from this, the authors analyzed
the average duration from SP, a yearly increase was observed in the duration
for journals in the 20-point category within the 5-year period with an average
of 74.74 days in the year 2021. A regular pattern was observed in the journals
with 40 points with a range of 109.98 to 149.60 days for the years in study. An
average duration of 63.91 days was observed for the journals with 70 points
within the period in study. There was a drastic reduction in
the average duration of SP in 2021 for journals with 100
points (52.53 days) as shown in Figure 5 Journals
categorized in the 140 points regions have the least SP with a range of 13.25
to 21.98 days within the 5- year period. The authors observed from these
results that journals with higher points (200,140, 100 points) have lower SP
while the SP for journals with lower points (70, 40, 20 points) are higher.
Figure 5
|
Figure 5 Average Duration from Acceptance to Publication (SP) for Journals and the Allocated Points |
4.2. Relationship
between MEiN points and journal metrics
The significant ANOVA was followed with Tukey’s post-hoc tests as shown in Table 6. The result shows that the mean scores for Scopus IF, WoS IF and SNIP were statistically significantly different between 200 points and 100, 70, 40 and 20 points since the p<0.05 but not between 140 points p=0.992 in Scopus IF, p=0.593 in SNIP and p=0.346 in WoS IF. There is a statistical significance difference between 140 points and 70, 40 and 20 points in Scopus IF, WoS IF and SNIP. Regarding SA and SP, the mean scores were not statistically significant between the allocated points because the p-value was greater than 0.05 (p > 0.05) in all cases.
Table 6
|
Table 6 Tukey’s Post-hoc Result Showing Multiple Comparisons of the
Dependent Variables |
|||||||
|
Dependent
Variable |
Mean
Difference (I-J) |
Std.
Error |
Sig. |
95%
Confidence Interval |
|||
|
Factors |
Points |
Lower
Bound |
Upper
Bound |
||||
|
Scopus
IF (2017-2021) |
200 |
140 |
0.620 |
1.090 |
0.992 |
-2.749 |
3.988 |
|
100 |
3.407* |
1.090 |
0.046 |
0.039 |
6.777 |
||
|
70 |
5.319* |
1.090 |
0.001 |
1.950 |
8.688 |
||
|
40 |
6.651* |
1.090 |
0.000 |
3.282 |
10.020 |
||
|
20 |
7.460* |
1.090 |
0.000 |
4.092 |
10.829 |
||
|
140 |
200 |
-0.620 |
1.090 |
0.992 |
-3.988 |
2.749 |
|
|
100 |
2.788 |
1.090 |
0.147 |
-0.581 |
6.157 |
||
|
70 |
4.699* |
1.090 |
0.003 |
1.331 |
8.068 |
||
|
40 |
6.031* |
1.090 |
0.000 |
2.663 |
9.400 |
||
|
20 |
6.841* |
1.090 |
0.000 |
3.472 |
10.210 |
||
|
100 |
200 |
-3.407* |
1.090 |
0.046 |
-6.777 |
-0.039 |
|
|
140 |
-2.788 |
1.090 |
0.147 |
-6.157 |
0.581 |
||
|
70 |
1.911 |
1.090 |
0.512 |
-1.457 |
5.280 |
||
|
40 |
3.243 |
1.090 |
0.064 |
-0.125 |
6.612 |
||
|
20 |
4.052* |
1.090 |
0.012 |
0.684 |
7.422 |
||
|
70 |
200 |
-5.319* |
1.090 |
0.001 |
-8.688 |
-1.950 |
|
|
140 |
-4.699* |
1.090 |
0.003 |
-8.068 |
-1.331 |
||
|
100 |
-1.911 |
1.090 |
0.512 |
-5.280 |
1.457 |
||
|
40 |
1.332 |
1.090 |
0.822 |
-2.037 |
4.701 |
||
|
20 |
2.141 |
1.090 |
0.390 |
-1.227 |
5.510 |
||
|
40 |
200 |
-6.651* |
1.090 |
0.000 |
-10.020 |
-3.282 |
|
|
140 |
-6.031* |
1.090 |
0.000 |
-9.400 |
-2.663 |
||
|
100 |
-3.243 |
1.090 |
0.064 |
-6.612 |
0.125 |
||
|
70 |
-1.332 |
1.090 |
0.822 |
-4.701 |
2.037 |
||
|
20 |
0.809 |
1.090 |
0.974 |
-2.559 |
4.178 |
||
|
20 |
200 |
-7.460* |
1.090 |
0.000 |
-10.829 |
-4.092 |
|
|
140 |
-6.841* |
1.090 |
0.000 |
-10.210 |
-3.472 |
||
|
100 |
-4.052* |
1.090 |
0.012 |
-7.422 |
-0.684 |
||
|
70 |
-2.141 |
1.090 |
0.390 |
-5.510 |
1.227 |
||
|
40 |
-0.809 |
1.090 |
0.974 |
-4.178 |
2.559 |
||
|
WoS IF (2017-2021) |
200 |
140 |
3.718 |
1.816 |
0.346 |
-1.896 |
9.332 |
|
100 |
7.233* |
1.816 |
0.006 |
1.620 |
12.848 |
||
|
70 |
10.994* |
1.816 |
0.000 |
5.381 |
16.609 |
||
|
40 |
10.870* |
1.816 |
0.000 |
5.256 |
16.484 |
||
|
20 |
11.552* |
1.816 |
0.000 |
5.938 |
17.166 |
||
|
140 |
200 |
-3.718 |
1.816 |
0.346 |
-9.332 |
1.896 |
|
|
100 |
3.516 |
1.816 |
0.406 |
-2.098 |
9.129 |
||
|
70 |
7.276* |
1.816 |
0.006 |
1.663 |
12.890 |
||
|
40 |
7.151* |
1.816 |
0.007 |
1.538 |
12.766 |
||
|
20 |
7.833* |
1.816 |
0.003 |
2.220 |
13.448 |
||
|
100 |
200 |
-7.233* |
1.816 |
0.006 |
-12.848 |
-1.620 |
|
|
140 |
-3.516 |
1.816 |
0.406 |
-9.129 |
2.098 |
||
|
70 |
3.761 |
1.816 |
0.335 |
-1.853 |
9.375 |
||
|
40 |
3.636 |
1.816 |
0.370 |
-1.978 |
9.250 |
||
|
20 |
4.318 |
1.816 |
0.203 |
-1.296 |
9.932 |
||
|
70 |
200 |
-10.994* |
1.816 |
0.000 |
-16.609 |
-5.381 |
|
|
140 |
-7.276* |
1.816 |
0.006 |
-12.890 |
-1.663 |
||
|
100 |
-3.761 |
1.816 |
0.335 |
-9.375 |
1.853 |
||
|
40 |
-0.125 |
1.816 |
1.000 |
-5.739 |
5.489 |
||
|
20 |
0.557 |
1.816 |
1.000 |
-5.057 |
6.171 |
||
|
40 |
200 |
-10.870* |
1.816 |
0.000 |
-16.484 |
-5.256 |
|
|
140 |
-7.151* |
1.816 |
0.007 |
-12.766 |
-1.538 |
||
|
100 |
-3.636 |
1.816 |
0.370 |
-9.250 |
1.978 |
||
|
70 |
0.125 |
1.816 |
1.000 |
-5.489 |
5.739 |
||
|
20 |
0.682 |
1.816 |
0.999 |
-4.932 |
6.296 |
||
|
20 |
200 |
-11.552* |
1.816 |
0.000 |
-17.166 |
-5.938 |
|
|
140 |
-7.833* |
1.816 |
0.003 |
-13.448 |
-2.220 |
||
|
100 |
-4.318 |
1.816 |
0.203 |
-9.932 |
1.296 |
||
|
70 |
-0.557 |
1.816 |
1.000 |
-6.171 |
5.057 |
||
|
40 |
-0.682 |
1.816 |
0.999 |
-6.296 |
4.932 |
||
|
SNIP
2021 |
200 |
140 |
0.668 |
0.412 |
0.593 |
-0.605 |
1.941 |
|
100 |
1.858* |
0.412 |
0.002 |
0.585 |
3.131 |
||
|
70 |
2.324* |
0.412 |
0.000 |
1.052 |
3.598 |
||
|
40 |
2.744* |
0.412 |
0.000 |
1.471 |
4.018 |
||
|
20 |
2.037* |
0.412 |
0.001 |
0.764 |
3.310 |
||
|
140 |
200 |
-0.668 |
0.412 |
0.593 |
-1.941 |
0.605 |
|
|
100 |
1.190 |
0.412 |
0.076 |
-0.083 |
2.463 |
||
|
70 |
1.657* |
0.412 |
0.006 |
0.384 |
2.930 |
||
|
40 |
2.076* |
0.412 |
0.000 |
0.804 |
3.350 |
||
|
20 |
1.369* |
0.412 |
0.030 |
0.096 |
2.643 |
||
|
100 |
200 |
-1.858* |
0.412 |
0.002 |
-3.131 |
-0.585 |
|
|
140 |
-1.190 |
0.412 |
0.076 |
-2.463 |
0.083 |
||
|
70 |
0.467 |
0.412 |
0.863 |
-0.806 |
1.740 |
||
|
40 |
0.887 |
0.412 |
0.295 |
-0.387 |
2.160 |
||
|
20 |
0.179 |
0.412 |
0.998 |
-1.094 |
1.452 |
||
|
70 |
200 |
-2.324* |
0.412 |
0.000 |
-3.598 |
-1.052 |
|
|
140 |
-1.657* |
0.412 |
0.006 |
-2.930 |
-0.384 |
||
|
100 |
-0.467 |
0.412 |
0.863 |
-1.740 |
0.806 |
||
|
40 |
0.420 |
0.412 |
0.907 |
-0.853 |
1.693 |
||
|
20 |
-0.288 |
0.412 |
0.980 |
-1.561 |
0.986 |
||
|
40 |
200 |
-2.744* |
0.412 |
0.000 |
-4.018 |
-1.471 |
|
|
140 |
-2.076* |
0.412 |
0.000 |
-3.350 |
-0.804 |
||
|
100 |
-0.887 |
0.412 |
0.295 |
-2.160 |
0.387 |
||
|
70 |
-0.420 |
0.412 |
0.907 |
-1.693 |
0.853 |
||
|
20 |
-0.707 |
0.412 |
0.534 |
-1.981 |
0.566 |
||
|
20 |
200 |
-2.037* |
0.412 |
0.001 |
-3.310 |
-0.764 |
|
|
140 |
-1.369* |
0.412 |
0.030 |
-2.643 |
-0.096 |
||
|
100 |
-0.179 |
0.412 |
0.998 |
-1.452 |
1.094 |
||
|
70 |
0.288 |
0.412 |
0.980 |
-0.986 |
1.561 |
||
|
40 |
0.707 |
0.412 |
0.534 |
-0.566 |
1.981 |
||
|
SA
2021 |
200 |
140 |
-40.050 |
61.130 |
0.985 |
-229.060 |
148.960 |
|
100 |
-27.423 |
61.130 |
0.997 |
-216.433 |
161.586 |
||
|
70 |
109.873 |
61.130 |
0.486 |
-79.136 |
298.883 |
||
|
40 |
31.583 |
61.130 |
0.995 |
-157.426 |
220.593 |
||
|
20 |
87.667 |
61.130 |
0.707 |
-101.343 |
276.676 |
||
|
140 |
200 |
40.050 |
61.130 |
0.985 |
-148.960 |
229.060 |
|
|
100 |
12.627 |
61.130 |
1.000 |
-176.383 |
201.636 |
||
|
70 |
149.923 |
61.130 |
0.178 |
-39.086 |
338.933 |
||
|
40 |
71.633 |
61.130 |
0.846 |
-117.376 |
260.643 |
||
|
20 |
127.717 |
61.130 |
0.326 |
-61.293 |
316.726 |
||
|
100 |
200 |
27.423 |
61.130 |
0.997 |
-161.586 |
216.433 |
|
|
140 |
-12.627 |
61.130 |
1.000 |
-201.636 |
176.383 |
||
|
70 |
137.297 |
61.130 |
0.254 |
-51.713 |
326.306 |
||
|
40 |
59.007 |
61.130 |
0.924 |
-130.003 |
248.016 |
||
|
20 |
115.090 |
61.130 |
0.436 |
-73.920 |
304.100 |
||
|
70 |
200 |
-109.873 |
61.130 |
0.486 |
-298.883 |
79.136 |
|
|
140 |
-149.923 |
61.130 |
0.178 |
-338.933 |
39.086 |
||
|
100 |
-137.297 |
61.130 |
0.254 |
-326.306 |
51.713 |
||
|
40 |
-78.290 |
61.130 |
0.792 |
-267.300 |
110.720 |
||
|
20 |
-22.207 |
61.130 |
0.999 |
-211.216 |
166.803 |
||
|
40 |
200 |
-31.583 |
61.130 |
0.995 |
-220.593 |
157.426 |
|
|
140 |
-71.633 |
61.130 |
0.846 |
-260.643 |
117.376 |
||
|
100 |
-59.007 |
61.130 |
0.924 |
-248.016 |
130.003 |
||
|
70 |
78.290 |
61.130 |
0.792 |
-110.720 |
267.300 |
||
|
20 |
56.083 |
61.130 |
0.938 |
-132.926 |
245.093 |
||
|
20 |
200 |
-87.667 |
61.130 |
0.707 |
-276.676 |
101.343 |
|
|
140 |
-127.717 |
61.130 |
0.326 |
-316.726 |
61.293 |
||
|
100 |
-115.090 |
61.130 |
0.436 |
-304.100 |
73.920 |
||
|
70 |
22.207 |
61.130 |
0.999 |
-166.803 |
211.216 |
||
|
40 |
-56.083 |
61.130 |
0.938 |
-245.093 |
132.926 |
||
|
SP
2021 |
200 |
140 |
60.080 |
42.673 |
0.722 |
-71.863 |
192.023 |
|
100 |
14.772 |
42.673 |
0.999 |
-117.172 |
146.715 |
||
|
70 |
14.905 |
42.673 |
0.999 |
-117.038 |
146.848 |
||
|
40 |
-50.898 |
42.673 |
0.836 |
-182.842 |
81.045 |
||
|
20 |
11.213 |
42.673 |
1.000 |
-120.730 |
143.157 |
||
|
140 |
200 |
-60.080 |
42.673 |
0.722 |
-192.023 |
71.863 |
|
|
100 |
-45.308 |
42.673 |
0.892 |
-177.252 |
86.635 |
||
|
70 |
-45.175 |
42.673 |
0.893 |
-177.118 |
86.768 |
||
|
40 |
-110.978 |
42.673 |
0.136 |
-242.922 |
20.965 |
||
|
20 |
-48.867 |
42.673 |
0.858 |
-180.810 |
83.077 |
||
|
100 |
200 |
-14.772 |
42.673 |
0.999 |
-146.715 |
117.172 |
|
|
140 |
45.308 |
42.673 |
0.892 |
-86.635 |
177.252 |
||
|
70 |
0.133 |
42.673 |
1.000 |
-131.810 |
132.077 |
||
|
40 |
-65.670 |
42.673 |
0.644 |
-197.613 |
66.273 |
||
|
20 |
-3.558 |
42.673 |
1.000 |
-135.502 |
128.385 |
||
|
70 |
200 |
-14.905 |
42.673 |
0.999 |
-146.848 |
117.038 |
|
|
140 |
45.175 |
42.673 |
0.893 |
-86.768 |
177.118 |
||
|
100 |
-0.133 |
42.673 |
1.000 |
-132.077 |
131.81 |
||
|
40 |
-65.803 |
42.673 |
0.642 |
-197.747 |
66.140 |
||
|
20 |
-3.692 |
42.673 |
1.000 |
-135.635 |
128.252 |
||
|
40 |
200 |
50.898 |
42.673 |
0.836 |
-81.045 |
182.842 |
|
|
140 |
110.978 |
42.673 |
0.136 |
-20.965 |
242.922 |
||
|
100 |
65.670 |
42.673 |
0.644 |
-66.273 |
197.613 |
||
|
70 |
65.803 |
42.673 |
0.642 |
-66.140 |
197.747 |
||
|
20 |
62.112 |
42.673 |
0.694 |
-69.832 |
194.055 |
||
|
20 |
200 |
-11.213 |
42.673 |
1.000 |
-143.157 |
120.730 |
|
|
140 |
48.867 |
42.673 |
0.858 |
-83.077 |
180.810 |
||
|
100 |
3.558 |
42.673 |
1.000 |
-128.385 |
135.502 |
||
|
70 |
3.692 |
42.673 |
1.000 |
-128.252 |
135.635 |
||
|
40 |
-62.112 |
42.673 |
0.694 |
-194.055 |
69.832 |
||
|
Based
on observed means. The error term is Mean
Square (Error) = 4552.562. |
|||||||
|
*
The mean difference is significant at the 0.05 level. |
|||||||
5. CONCLUSIONS And RECOMMENDATIONS
Our study aimed to provide overall data on average publishing durations and points allocations in the MEiN across Civil engineering and transport fields. We did not intend to determine how delays have evolved. Some of the earlier studies have done this. However, we consciously chose to concentrate on the differences in the average duration of publication time between various journals in the different point categories from 2017 to 2021. We can conclude that the journals with high points (200, 140 and 100 points) have a high duration from the period of submission of the article to the period of acceptance (average of 249 days) while journals with lower points (70, 40 and 20 points) shows a lower duration with an average of 150 days. Furthermore, the average duration from the date of acceptance to the date of publication within this 5-year period are 53.86 days for journals with higher points (200, 140 and 100 points) and 87.07 days for journals with lower points (70, 40 and 20 points). The journals in the transportation area of specialization shows the highest average duration in SA for the 5-year period with an average of 465.98 and 516.39 for 200 and 100 points while 140, 70, 40 and 20 points have an average SA of 289.64, 122.33, 167.43 and 179.50 days respectively. The average duration for SP in the Transportation branch of journals for 200 points is 246.42 days while 140 and 100points have 23.94 and 70.67 days and the range for average duration of SP for journals of lower points (70, 40 and 20 points) was 130.03 to 136.35 days. This result shows that in the area of transportation journals, the average publication time for 200 points is 1.2 times more than 100 points and 2.2 times more than 140 and 20 points.
Therefore, the authors conclude that the price of waiting for an article to be published in journals of higher point categorization is worth the pain. Moos (2011) argued that the editorial delay in top journals is the price of submitting manuscripts to the journals. This is in line with the results of this study. The higher points journals have the highest publication time with an average combined duration of SA and SP for 200, 140 and 100 points resulting to 305.28, 285.25 and 317.93 days respectively. However, journals within the 40 points category has average total duration of 324.60 days within the 5- year period, this is 70% more than the 70-point journals and 50% more than the 20-point journals. This sharp difference in the 40-points journals results majorly from the branch of transportation. It thus means that pre-college students or researchers, who are willing to get the top points, will have to pay the price of waiting. However, the effects of this waiting period on the research community need to be analyzed and studied.
Further analysis from this study shows that the MEiN journals categorization using the JCR obtained from the WoS IF is in order. Scopus IF and SNIP are also effective factors that can be used for the categorization of the journals since they show similar results as the WoS IF. This is therefore in agreement with previous studies Jubb (2016), Mayden (2012), which explain that several variable factors can be used in ranking of journals for effectiveness, quality, award of grants and scholarship. The MEiN, institutions and organizations providing grants and scholarship can incorporate SNIP and Scopus IF as part of the journal categorization factors. The speed of peer review process are dependent on some factors. Mulligan (2005) in his article, revealed that the quality and timeliness of review is dependent on the limits of papers reviewed by the reviewers as well as their knowledge relevance in the subject area. However, the importance of speedy publication of scientific works cannot be over-emphasized; the duration of publication (SA and SP) does not have any correlation with the categorization of journals based on this study.
Further studies can focus on the use of Eigen value and H-index as variable factors for determining the ranks or categories of journals. There could be several contributing factors which leads to the delays in the publication of articles, an in-depth analysis of these factors should be studied at the journal publishing house level.
CONFLICT OF INTERESTS
None.
ACKNOWLEDGMENT
Thanks to Ajoke Agboola, Sheriff Oguntade and Katarzyna Skotnicka for their tremendous help during the data collection.
APPENDIX
The dataset, and analysis that support the findings of this study are available from the corresponding author upon request.
REFERENCES
Björk, B. C., & Solomon, D. (2013). The Publishing Delay in Scholarly Peer-Reviewed Journals. Journal of Informetrics, 7(4), 914–923. https://doi.org/10.1016/j.joi.2013.09.001.
Chakrabarti, S. K. (2016). Industry Interface in Undergraduate Civil Engineering Education : Indian Context. Procedia Engineering, 161, 1982–1986. https://doi.org/10.1016/j.proeng.2016.08.790.
Chen, H., Chen, C.H., & Vishal, J. (2013). Publication Times, Impact Factors, and Advance Online Publication in Ophthalmology Journals. Ophthalmology., 120(8), 1697-701. https://doi.org/10.1016/j.ophtha.2013.01.044.
De Bronstein, A. A., Lampe, S., & Halberstadt, J. (2023). Fostering Future Engineers as Transformational Agents : Integrating Sustainability and Entrepreneurship in Engineering Education. Procedia Computer Science, 219, 957–962. https://doi.org/10.1016/j.procs.2023.01.372.
Dong, P., Loh, M., & Mondry, A. (2006). Publication Lag in Biomedical Journals Varies Due to the Periodical’S Publishing Model. Scientometrics, 69(2), 271–286. https://doi.org/10.1007/s11192-006-0148-3.
Edward J. Huth. (1999). Writing and Publishing in Medicine. (3rd ed.). Williams & Wilkins.
Elsevier. (2023a). Measuring a Journal’S Impact.
Elsevier. (2023b). What is Peer Review ?
Gamayunova, O. (2015). The Role of Civil Engineering Institute in Increasing the International Competitiveness of the St. Petersburg State Polytechnical University. Procedia Engineering, 117(1), 1065–1072. https://doi.org/10.1016/j.proeng.2015.08.237.
Haustein, S. (2012). Multidimensional Journal Evaluation : Analyzing Scientific Periodicals beyond the Impact Factor. De Gruyter Saur. https://doi.org/https://doi.org/10.1515/9783110255553.
Jubb, M. (2016). Peer Review : The Current Landscape and Future Trends. Learned Publishing, 29(1), 13–21. https://doi.org/10.1002/leap.1008.
Kelly, J., Sadeghieh, T., & Adeli, K. (2014). Peer Review in Scientific Publications : Benefits, Critiques, & A Survival Guide. EJIFCC, 25(3), 227–243.
Marshall, J., & Berland, L. (2012). Developing a Vision of Pre-College Engineering Education. Journal of Pre-College Engineering Education Research, 2(2), 36–50. https://doi.org/10.5703/1288284314869.
Mayden, K. D. (2012). Peer Review: Publication’s Gold Standard. Journal of the Advanced Practitioner in Oncology, 3(2), 117–122.
Miller, K. A., Sonnert, G., & Sadler, P. M. (2020). The Influence of Student Enrollment in Pre-College Engineering Courses on their Interest in Engineering Careers. Journal of Pre-College Engineering Education Research, 10(1), 90–102. https://doi.org/10.7771/2157-9288.1235.
Mohanty, C. R., Bellapukonda, S., Mund, M., Behera, B. K., & Sahoo, S. S. (2021). Analysis of Publication Speed of Anesthesiology Journals: A Cross-Sectional Study. Brazilian Journal of Anesthesiology (English Edition), 71(2), 110–115. https://doi.org/10.1016/j.bjane.2021.02.025.
Moos, D. D. (2011). The Review Process : What Is It ? Journal of Perianesthesia Nursing, 26(1), 49–53. https://doi.org/10.1016/j.jopan.2010.11.006.
Mulligan, A. (2005). Is Peer Review in Crisis ? Oral Oncology, 41(2), 135–141. https://doi.org/10.1016/j.oraloncology.2004.11.001.
Rogers, S.W., & Goktas, R. K. (2010). Exploring Engineering Graduate Student Research Proficiency with Student Surveys. Journal of Engineering Education, 99, 263–278. https://doi.org/https://doi.org/10.1002/j.2168-9830.2010.tb01061.x.
Sampaio, A. Z., Ferreira, M. M., Rosário, D. P., & Martins, O. P. (2010). 3D and VR Models in Civil Engineering Education : Construction, Rehabilitation and Maintenance. Automation in Construction, 19(7), 819–828. https://doi.org/10.1016/j.autcon.2010.05.006.
Sebo, P., Fournier, J. P., Ragot, C., Gorioux, P. H., Herrmann, F. R., & Maisonneuve, H. (2019). Factors Associated with Publication Speed in General Medical Journals : A Retrospective Study of Bibliometric Data. Scientometrics, 119(2), 1037–1058. https://doi.org/10.1007/s11192-019-03061-8.
Sigahi, T. F. A. C., & Sznelwar, L. I. (2023). From Isolated Actions to Systemic Transformations : Exploring Innovative Initiatives on Engineering Education for Sustainable Development in Brazil. Journal of Cleaner Production, 384(December 2022). https://doi.org/10.1016/j.jclepro.2022.135659.
Spier, R. (2002). The History of the Peer-Review Process. Trends in Biotechnology, 20(8), 357–358. https://doi.org/10.1016/S0167-7799(02)01985-6.
Taşkın, Z., Taşkın, A., Doğan, G., & Kulczycki, E. (2022). Factors Affecting Time to Publication in Information Science. Scientometrics, 127(12), 7499–7515. https://doi.org/10.1007/s11192-022-04296-8.
The Guardian, “Peer Review, Preprints and the Speed of u”. (Accessed : 8th January, 2023).
Zhao, S., Zhang, H., & Wang, J. (2018). Cognition and System Construction of Civil Engineering Innovation and Entrepreneurship System in Emerging Engineering Education. Cognitive Systems Research, 52, 1020–1028. https://doi.org/10.1016/j.cogsys.2018.10.020.
|
|
 This work is licensed under a: Creative Commons Attribution 4.0 International License
© IJETMR 2014-2023. All Rights Reserved.