
|
|
|
|
THE EFFECT OF REWARD AND RECOGNITION ON EMPLOYEE ENGAGEMENT (CASE STUDY AT PT. X PART DIRECTORATE H)
Vhifin Sadilla 1![]() , Ratri Wahyuningtyas 2
, Ratri Wahyuningtyas 2![]()
1, 2 Department
of Telecommunication and Informatics Business Management, College of Economics
and Business, University of Telkom, Indonesia
|
|
|
ABSTRACT |
|
|
The progress
and development of business science has found that well-managed human
resource management is one very effective way of creating a good company.
This can also be seen in the company's and its employees' relationships.
Engaged employees usually have high loyalty to the company. This study aims
to determine the influence of reward and recognition on employee engagement.
This study uses a descriptive technique with a quantitative approach. The
population studied is Directorate H at PT. X by
specializing in employees who have worked for one year or more. Sampling with
probability sampling technique to get a sample of 176 people. Data was
collected by distributing questionnaires and then processed through Partial
Least Square - Structural Equation Modeling (PLS-SEM) analysis using the SmartPLS application. Based on the research results,
reward has a positive and significant effect on employee engagement, and
recognition also has a positive and significant effect on employee
engagement. From these results, the company can maintain a sound reward
system and increase recognition by recognizing small things around the
company so that employees feel more valued. |
|||
|
Received 02 July 2023 Accepted 03 August 2023 Published 17 August 2023 Corresponding Author Vhifin Sadilla, vhifinsadilla11@gmail.com DOI 10.29121/ijetmr.v10.i8.2023.1352 Funding: This research
received no specific grant from any funding agency in the public, commercial,
or not-for-profit sectors. Copyright: © 2023 The
Author(s). This work is licensed under a Creative Commons
Attribution 4.0 International License. With the
license CC-BY, authors retain the copyright, allowing anyone to download,
reuse, re-print, modify, distribute, and/or copy their contribution. The work
must be properly attributed to its author.
|
|||
|
Keywords: Reward,
Recognition, Employee Engagement, Smartpls-Ver 3.0 |
|||

1. INTRODUCTION
Human resources are one of the determining factors for a company to achieve its goals. Romadhona and Wahyuningtyas (2019) said organizations must manage resources effectively to achieve toned goals and objectives to compete with other organizations. In companies, human resources are called employees or employees. As said by Sadiq et al. (2022), employees are one of the important aspects that have a role in the company, not only their expertise at work but other important things, namely their willingness to work and their commitment to achieving company goals. Having quality resources is not easy, and it takes a lot of factors that need to be synergized. As stated by Sucahyowati and Hendrawan (2020), to find out whether human resources or employees in a company can be said to be of high quality, this is closely related to the performance appraisal system.
Employee engagement is a unity between company performance and employees because companies can only work with employees. Pamungkas (2018) defines employee engagement as a two-way relationship between employers and workers. Ariawaty (2019) argue that employee engagement is a relationship between a person's physical, cognitive, and emotional involvement with roles in the workplace. The level of employee engagement is fundamental so that it creates the willingness of employees to do work; employees will automatically issue their best abilities in advancing the company Rachmana and Raharso (2019)
Employees have responsibilities, which will always be completed to the maximum extent possible to complete the work properly. At the same time, the company is expected to repay the hard work done by employees by providing appropriate awards and recognition. As a pendant, Baqir et al. (2020) in their research stated that employee engagement is difficult to manage because employees expect to be rewarded and encouraged to continue to be motivated so that the organization can involve employees with the help of this reward and recognition. Sadiq et al. (2022) recognizing and rewarding employees has the same meaning as respecting their work. Employee productivity can increase due to these actions, motivating staff to act more positively at work.
Rai
et al. (2018) stated that rewards
and recognition function as a means for employees to fulfill
normal job requirements and as an incentive to make decisions that go beyond
formal job requirements by involving them in the workplace. Rewards are given
for all income company employees receive, whether in the form of money, durable
goods, or short-lived goods, as a form of appreciation for their contribution Hasibuan (2019). In addition,
recognition is one of the company's considerations to raise employee morale.
According to Chevalier et al. (2022), recognition refers to
the organization's or management's efforts to make employees feel valued and
appreciated as exemplary role models for their actions.
PT. X of Directorate H conducted an engagement survey for
the first time in 2021. The survey was carried out to see the quality of the
human resources it has, with the hope that the survey can become a forum for
accommodating aspirations, feelings and also one of
the inputs for making improvements. The survey results show that rewards and
recognition get the lowest percentage of other drivers. Therefore, this study
wants to see how reward and recognition influence employee engagement.
2. THE OBJECTIVE OF THE STUDY
This study aims to examine how reward influences employee engagement and recognition influences employee engagement. The goal is to increase employee engagement through rewards and recognition.
3. DATA COLLECTIONS
Data was collected for this study using several techniques, including interviews, distributing questionnaires, and collecting data through documentation. Interviews were conducted to discover the phenomena happening in the field to get a situation to be researched. At the same time, for distribution of questionnaires given to employees of PT. X part of Directorate H with a total sample of 176 employees. The data consists of 8 statements (reward variable), 11 statements (recognition variable), and 14 statements (employee engagement variable). The aim of distributing this questionnaire is to obtain a more definite company condition related to the research variables.
4. METHODOLOGY
The primary objective of this study is to investigate the impact of reward and recognition on employee engagement within the H directorate at PT X. Employee engagement will be the central focus of the research. This research uses a quantitative method because this method is believed to be more effective in analyzing the formulation of problems in research related to rewards and recognition of employee engagement. Supported the statement by Sugiyono. (2019) saying that quantitative research is a research method that is based on reality in the field, can be observed with the five senses, usually does not change in a short time, can be measured, measures the relationship of variables in the form of cause and effect and has value. Which is free. According to Sinambela and Sarton. (2021), research variables are elements, values, or the nature of things or activities that differ. Researchers have determined these variables to collect data, analyze them, and finally come to relevant reactions. The study comprises independent and dependent variables. Independent variables can influence changes in the dependent variable Sinambela and Sarton. (2021). Meanwhile, the dependent variable refers to conditions that experience changes when research introduces or changes the independent variable Mustafidah and Suwarsito. (2020). Employee engagement serves as the dependent variable in this study, which also inc two independent variables, namely rewards and recognition, and finally comes to relevant conclusions. The research consists of both independent and dependent variables. Independent variables can potentially be the dependent variable Sinambela and Sarton. (2021). Meanwhile, the dependent variable refers to conditions that experience changes when research introduces or changes the independent variable Mustafidah and Suwarsito. (2020). In this study, employee engagement is considered the dependent variable, while the independent variables are rewards and recognition. The research aims to draw relevant conclusions based on the relationship between these variables. The study involves examining how the independent variables, rewards, and recognition, can potentially cause changes in the dependent variable, which is employee engagement Sinambela and Sarton. (2021). Meanwhile, the dependent variable refers to conditions that experience changes when research introduces or changes the independent variable Mustafidah and Suwarsito. (2020). Employee engagement serves as the dependent variable in this study, including two independent variables: reward,s and recognition.n Meanwhile, the dependent variable refers to conditions that experience changes when research introduces or changes the independent variable Mustafidah and Suwarsito. (2020). Employee engagement serves as the dependent variable in this study, including two independent variables: rewards and recognition.n Meanwhile, the dependent variable refers to conditions that experience changes when research introduces or changes the independent variable Mustafidah and Suwarsito. (2020). Employee engagement serves as the dependent variable in this study, including two independent variables: rewards and recognition.
The data processing methodology utilized in this study involves applying the Structural Equation Modeling - Partial Least Square (SEM-PLS) method. Pering (2020) It is acknowledged that Structural Equation Modeling (SEM) is currently one of the most popular and widely used statistical analysis methods in research. SEM will look for a method to see/explain the relationship between research variables,s including latent variables, and say partial least squares (PLS) is a powerful method; it can eliminate Ordinary Least Square (OLS) regression assumptions. Hardisman's statement (2021) SEM-PLS is a 'Partial SE,’ which will analyze the modeling carried out between linear variables that require an analysis of the model's suitability. To use the PLS-SEM method, you can use a variety of various that support research, such as SmartPLS, WarpPLS, and Adanco. This study will use SmartPLS software version 3.0, based on the statement. Pering (2020) also states that there are several stages when testing using the SmartPLS software, as follows:
1) Outer
Model Test
The Outer Model testing process aims to establish the relationship between latent variables and their corresponding indicators. Several tests are conducted within the outer model, including convergent validity, which examines the factor loading values of latent variables with their respective indicators. Convergent validity is expected to be greater than 0.7. Additionally, discriminant validity is evaluated through the cross-loading factor values to ensure that each construct demonstrates adequate discrimination. This can be assessed using the average variance extracted (AVE), where an expectation of an AVE value greater than 0.5 is desired. Furthermore, the composite reliability test, supported by Cronbach Alpha with a value exceeding 0.6, is conducted. An expected value for composite reliability greater than 0.7 is sought as part of this analysis.
2) Inner
Model Test
The inner model represents the relationship between
exogenous latent variables and endogenous latent variables or the connections
among endogenous variables. Several tests are conducted within the inner model,
starting with the structural model test, where the R-Square value is examined
as an indicator of model goodness-of-fit. Next, significance is assessed by
examining parameter coefficients and the t-statistical values in the algorithm
bootstrapping report - path coefficients. The expected t-statistic value is
anticipated to be higher than the t-table value with a significance level of
5%.
5. RESULTS AND DISCUSSIONS
After data collection, an alternative partial least squares (PLS) method from structural equation modelling (SEM) was used to process the data. The Research Model (Outer Model) and the Structural Model (Inner Model) are evaluated in the PLS method through two stages.
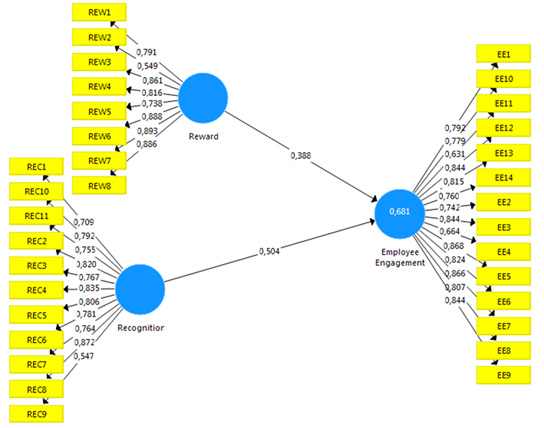
Based on the first-order estimation method from Partial Least Square, a complete model path diagram is obtained with the PLS algorithm estimation and bootstrapping, which can be seen in the image below.
Figure 1
|
Figure 1 Full Structural Model (Researcher Processed, 2023) |
The outcomes of the PLS Algorithm test depicted in the above figure indicate that several indicators, namely REW2, REC9, EE4, and EE11, have values less than 0.7, which renders them invalid. As a result, these indicators are removed from the model. Subsequently, the retesting is conducted with the revised model that excludes these indicators.
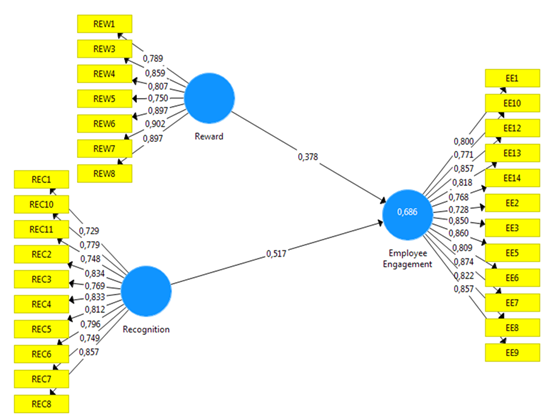
Figure 2
|
Figure 2 Full
Revision Structural Model - PLS Algorithm (Researcher Processed, 2023) |
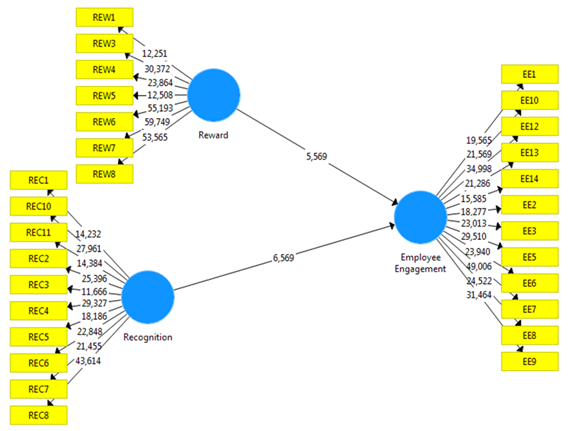
Figure 3
|
Figure 3 Full
Revision Structural Model – Bootstrapping (Author Processed, 2023) |
The validity of each indicator and construct variable reliability tests were carried out by looking at the value of the loading factor, as seen in the output of the PLS Algorithm shown above. When an indicator's expected loading factor value exceeds 0.70, it is considered valid. The measurement model for each variable is presented below, along with each indicator related to these variables.
5.1. OuterModel
The
assessment of the measurement model (outer model) encompasses various aspects,
such as convergent validity, which is determined by the values of outer
loadings. Additionally, the evaluation includes average variance extracted
(AVE), discriminant validity, and composite reliability.
1) Convergent
Validity
The subsequent section presents the outcomes of the convergent validity tests conducted for each variable under investigation in this study:
Table 1
|
Table 1 Convergent Validity |
||||
|
Variable |
Indicator |
Factor Loading |
t-statistic |
Conclusion |
|
Rewards |
REW1 |
0.78879 |
12.2514 |
Valid |
|
REW3 |
0.85908 |
30.3717 |
Valid |
|
|
REW4 |
0.80709 |
23.8641 |
Valid |
|
|
REW5 |
0.75044 |
12.5081 |
Valid |
|
|
REW6 |
0.8969 |
55.1932 |
Valid |
|
|
REW7 |
0.90168 |
59.7489 |
Valid |
|
|
REW8 |
0.89719 |
53.5648 |
Valid |
|
|
Recognition |
REC1 |
0.7291 |
14.2322 |
Valid |
|
REC2 |
0.83428 |
25.3959 |
Valid |
|
|
REC3 |
0.76932 |
11.6658 |
Valid |
|
|
REC4 |
0.83255 |
29.3267 |
Valid |
|
|
REC5 |
0.81237 |
18.1858 |
Valid |
|
|
REC6 |
0.79596 |
22.8485 |
Valid |
|
|
REC7 |
0.74924 |
21.4554 |
Valid |
|
|
REC8 |
0.85653 |
43.6143 |
Valid |
|
|
REC10 |
0.77944 |
27.9615 |
Valid |
|
|
REC11 |
0.74763 |
14.3836 |
Valid |
|
|
Employee Engagement |
EE1 |
0.79957 |
19,565 |
Valid |
|
EE2 |
0.72776 |
18.2772 |
Valid |
|
|
EE3 |
0.84951 |
23.0133 |
Valid |
|
|
EE5 |
0.8599 |
29.5099 |
Valid |
|
|
EE6 |
0.8095 |
23.9397 |
Valid |
|
|
EE7 |
0.87404 |
49.0058 |
Valid |
|
|
EE8 |
0.82212 |
24,522 |
Valid |
|
|
EE9 |
0.85654 |
31.4638 |
Valid |
|
|
EE10 |
0.77095 |
21.5689 |
Valid |
|
|
EE12 |
0.8575 |
34.9976 |
Valid |
|
|
EE13 |
0.81761 |
21.2859 |
Valid |
|
|
EE14 |
0.76752 |
15.5851 |
Valid |
|
According to the summary of processing results shown in the table above, all indicators have a loading factor value of > 0.7, indicating good indicator validity. Therefore, all indicators are considered when measuring the corresponding latent variables.
Evaluating convergent validity involves considering the AVE (Average Variance Extracted) value in addition to factor loading testing. The test results indicate that the AVE value for each latent variable surpasses 0.5, signifying that each construct contributes to more than 50% of the variation in its corresponding indicators.
Based on the following table, it can be summarized that this model has good convergent validity.
Table 2
|
Table 2 AVE (Average Variance
Extracted) |
||
|
Variable |
Average Variance Extracted
(AVE) |
Conclusion |
|
Employee Engagement |
0.671 |
Valid |
|
Recognition |
0.627 |
Valid |
|
Rewards |
0.714 |
Valid |
2) Discriminant
Validity
Below are the findings of the discriminant validity testing for the research variables, performed using the Cross Loading test:
Table 3
|
Table 3 Cross Loading |
|||
|
Indicator |
Employee Engagement |
Recognition |
Rewards |
|
EE1 |
0.800 |
0.610 |
0.670 |
|
EE10 |
0.771 |
0.603 |
0.531 |
|
EE12 |
0.857 |
0.643 |
0.672 |
|
EE13 |
0.818 |
0.578 |
0.647 |
|
EE14 |
0.768 |
0.634 |
0.522 |
|
EE2 |
0.728 |
0.561 |
0.507 |
|
EE3 |
0.850 |
0.638 |
0.650 |
|
EE5 |
0.860 |
0.657 |
0.629 |
|
EE6 |
0.809 |
0.690 |
0.552 |
|
EE7 |
0.874 |
0.716 |
0.617 |
|
EE8 |
0.822 |
0.641 |
0.660 |
|
EE9 |
0.857 |
0.719 |
0.632 |
|
REC1 |
0.637 |
0.729 |
0.684 |
|
REC10 |
0.600 |
0.779 |
0.465 |
|
REC11 |
0.563 |
0.748 |
0.464 |
|
REC2 |
0.695 |
0.834 |
0.664 |
|
REC3 |
0.551 |
0.769 |
0.447 |
|
REC4 |
0.640 |
0.833 |
0.585 |
|
REC5 |
0.649 |
0.812 |
0.644 |
|
REC6 |
0.677 |
0.796 |
0.623 |
|
REC7 |
0.538 |
0.749 |
0.386 |
|
REC8 |
0.625 |
0.857 |
0.578 |
|
REW1 |
0.570 |
0.523 |
0.789 |
|
REW3 |
0.667 |
0.643 |
0.859 |
|
REW4 |
0.591 |
0.587 |
0.807 |
|
REW5 |
0.563 |
0.499 |
0.750 |
|
REW6 |
0.668 |
0.637 |
0.897 |
|
REW7 |
0.676 |
0.642 |
0.902 |
|
REW8 |
0.652 |
0.640 |
0.897 |
Based on the table above, it is evident that all indicators demonstrate the highest correlation with their respective latent variables that need to be measured. Consequently, it can be concluded that the model exhibits good discriminant validity.
In
addition to cross-loading, the Fornell-Larcker criterion test can also be
employed to assess discriminant validity.
Table 4
|
Table 4 Fornell Larcker
Criterion |
|||
|
Variable |
Employee Engagement |
Recognition |
Rewards |
|
Employee Engagement |
0.819 |
||
|
Recognition |
0.784 |
0.792 |
|
|
Rewards |
0.744 |
0.708 |
0.845 |
|
Note: values marked in bold are AVE root values |
|||
The table above reveals that the square root of the AVE (Average Variance Extracted) for each latent variable exceeds the correlation value between that variable and other latent variables. This indicates that the model demonstrates good discriminant validity, as each variable effectively distinguishes itself from others within this study.
3) Reliability
Testing
The
results of the reliability test for each variable using Cronbach alpha and the
composite reliability test are as follows:
Table 5
|
Table 5 Reliability Test |
|||
|
Variable |
Cronbach's Alpha |
Composite Reliability |
Conclusion |
|
Employee Engagement |
0.955 |
0.961 |
reliable |
|
Recognition |
0.934 |
0.944 |
Reliable |
|
Rewards |
0.932 |
0.946 |
Reliable |
The table above shows that each construct exhibits good reliability, as indicated by the composite reliability (CR) value greater than 0.7 and the Cronbach alpha (CA) value exceeding 0.6. This demonstrates that each indicator consistently measures its respective construct. As a result, the variables utilized in this study can be deemed trustworthy and consistently provide accurate results when measuring the relevant constructs.
5.2. Inner Model
From the results of the PLS Algorithm test in the image above, the equation model is obtained as follows:
EE = 0.137 REW + 0.212 REC
Information:
EE = Employee Engagement
REW = Rewards
REC = recognition
1) R-Square
Test
The
R-square value for the employee engagement variable is determined as follows
based on the analysis findings:
Table 6
|
Table 6 R-Square Test |
|
|
Endogenous Variables |
R Square |
|
Employee Engagement |
0.686 |
According to the table above, the R-square value for the Employee Engagement variable is 0.686. This indicates that 68.60% of the variation in Employee Engagement can be explained by the Reward and Recognition variables examined in this study. However, it is important to note that the remaining 31.40% is influenced by other variables not included in the analysis.
2) Prediction
relevance (Stone-Geisser's Q2)
The
values obtained from the predictive relevance test (Q2) using the
blindfolding technique are shown in the following table:
Table 7
|
Table 7 Predictive
Relevance Q2 |
|||
|
Endogenous Variables |
SSO |
SSE |
Q2 (=1-SSE/SSO) |
|
Employee Engagement |
2112,000 |
1152,291 |
0.454 |
The
predictive relevance value of Q2 for endogenous variables is more than 0, so it
can be concluded that the model has predictive relevance.
3) Goodness
of Fit
To
calculate the GoF Index, the square root of the
average communality index and average R squares is used as follows:
GOF = Communality x R2
GOF = 0.670 x 0.686 = 0.678
From
the results above, the Gof value is 0.678 > 0.36,
so it is included in the large category. Apart from calculating the GoF Index, model fit in the PLS sem
can also be seen from the following indices.
Table 8
|
Table 8 Model Fit Test |
|||
|
Fit Model Index |
Estimation |
Criteria |
Conclusion |
|
SRMR |
0.074 |
< 0.80 |
Good fit |
Based
on the SRMR index, it shows that the results of the complete structural model
test are fit.
Hypothesis
Test 1
The
first hypothesis tested in this study is the effect of Reward on Employee
Engagement with the following hypothesis:
H0: Rewards do not have a positive or significant effect on
Employee Engagement.
H1: Rewards have a positive and significant influence on Employee
Engagement.
According
to the statistical test results table above, the effect of the Reward variable
on Employee Engagement is represented by a path coefficient of 0.378. The
corresponding t-value for this effect is 5.569, with a P-value of 0.000. Since
the positive path coefficient is 0.378, the t-statistic value of 5.569 is
greater than the t-table value of 1.65 (at the 5% significance level and one
tail). Additionally, the p-value of 0.000 is less than 0.05. As a result, the
null hypothesis H0 is rejected, and the alternative hypothesis H1 is accepted.
This indicates a positive and significant impact of the Reward variable on
Employee Engagement.
Hypothesis
Test 2
The
second hypothesis tested in this study is the effect of Recognition on Employee
Engagement with the following hypothesis:
H0: Recognition does not have a positive and significant effect on
Employee Engagement.
H1:
Recognition has a positive and significant impact on Employee Engagement.
According
to the statistical test results table provided, the effect of the Recognition
variable on Employee Engagement is represented by a path coefficient value of
0.517. The corresponding t-value for this effect is 6.569, and the P-value is
0.000. Since the path coefficient value of 0.517 is positive, the t-statistic
value of 6.569 is greater than the t-table value of 1.65 (at the 5%
significance level and one tail). The p-value of 0.000 is less than 0.05, the
null hypothesis H0 is rejected, and the alternative hypothesis H2 is accepted.
This indicates the Recognition variable's positive and significant impact on
Employee Engagement.
·
Effect of Reward on Employee Engagement
The
data processing results using SmartPLS 3.0 software
show that the Reward variable positively and significantly influences Employee
Engagement. The evidence supporting the positive and significant impact of the
Reward variable on Employee Engagement is derived from the path coefficient
value of 0.378, with a t-statistic of 5.569 and a P-value of 0.000. These
findings are further strengthened by the t-statistic value of 5.569 being
greater than the t-table value of 1.65 (at a significance level of 5% and one
tail) and the p-value of 0.000 being less than 0.05. The results of this study
align with prior research conducted by Rai et al. (2018) and Baqir et al. (2020), which also demonstrated a
positive and significant influence of the Reward variable on Employee
Engagement.
It
means the level of employee engagement of an employee at Directorate H at PT. The company’s rewards strongly influence X. The
discussion above shows that Rewards have a positive and significant influence
on Employee Engagement which indicates that the higher the Reward, the more
Employee Engagement will increase. Conversely, if the Reward is lower, Employee
Engagement will decrease. This is natural because when reward practices are
implemented properly, employee needs will be met, encouraging employees to
continue providing maximum performance results. With these performance results,
employees will have hope to get rewards again to meet their needs. This is
supported by data on the characteristics of respondents who are dominated by
employees aged 25-30 years and, on average, have worked for more than five
years. Employees usually benefit more from rewards the longer they work for the
company because of their performance results. Therefore, increasing employee
enthusiasm for advancing the company through a good reward system will create a
sense of employee engagement with the company.
·
Effect of Recognition on Employee Engagement
The data processing results using the SmartPLS software reveal a positive and significant impact of the Recognition variable on Employee Engagement. This is evident from the path coefficient value of 0.517, with a t-statistic of 6.569 and a P-value of 0.000. The finding is reinforced by the t-statistic value of 6.569 being greater than the t-table value of 1.65 (at a significance level of 5% and one tail) and the p-value of 0.000 being less than 0.05. These results are consistent with previous research conducted by Lartey (2021) and Baqir (2020), demonstrating a positive and significant influence of the Recognition variable on Employee Engagement.
It means the level of employee engagement of an employee at Directorate H at PT. The recognition provided by the company strongly influences X. The discussion above shows that Recognition has a positive and significant effect on Employee Engagement, indicating that higher Recognition will increase Employee Engagement. Conversely, if Recognition is lower, then Employee Engagement will decrease. As social beings, every employee certainly has a sense of inner satisfaction. Fulfilling the needs of employees outwardly certainly creates a feeling of happiness, but it is undeniable that inner conditions are no less important, which are also considered by employees. This naturally happens because when someone is recognized in an organization, they feel valued and needed. So that they will do the task or work with pleasure and enthusiasm; this will positively impact performance results. Therefore, good recognition practices in companies will also create good employee engagement.
6. CONCLUSION AND RECOMMENDATIONS FOR FUTURE STUDIES
From the previously described research regarding reward and recognition of employee engagement at PT. X, specifically within Directorate H, shows that rewards positively and significantly impact Employee Engagement. This implies that higher rewards lead to an increase in Employee Engagement, whereas lower rewards result in decreased Employee Engagement. Furthermore, recognition also exhibits a positive and significant influence on Employee Engagement, indicating that higher levels of recognition lead to increased Employee Engagement. In comparison, lower levels of recognition result in decreased Employee Engagement. In summary, both reward and recognition play vital roles in fostering and maintaining higher levels of Employee Engagement within the organization.
From the description above, rewards and recognition can be aspects that need to be paid more attention to by companies so they can maintain and continue to improve employee engagement. Setting up a fair and more attractive reward system can attract employees to continue working optimally, hoping to obtain the rewards offered. It retains employees already working at the company and attracts prospective workers' attention to applying there. Thus, companies are better known and can look for more of the best talent according to company needs.
After the fundamental needs of employees have been met through a good reward system, it must be recognized that employees also need recognition to be valued in an environment. Someone will feel more comfortable in an environment that recognizes their existence. So, the company can maintain recognition that it has been done correctly. Then, you can increase recognition by socializing the importance of appreciating every action starting from small things such as praising good things, being able to set up an email delivery system, and also being able to specifically mention the names of employees who play a significant role when there are important meetings. With the awareness that all parties will appreciate something small, it can lead to positive things for something more prominent. With a sense of being valued within the organization, they will instinctively feel recognized as an important part of the company. This certainly has a good impact on various aspects, one of which is better employee engagement.
Future studies can use more complex samples and include variables not explained in this study. Future researchers can also anticipate that more research will be conducted, and data analysis using the latest software will be able to support the development of the software. Therefore, researchers suggest conducting additional research using the latest theories and components to understand how to develop human resources. Based on the limitations of the researchers, this research still needs to be improved and has yet to identify all variables that affect employee engagement fully.
CONFLICT OF INTERESTS
None.
ACKNOWLEDGMENTS
None.
REFERENCES
Ariawaty, R.R.N. (2019). The Effect of Employee Engagement on Employee Work-Life Balance. Bisma, 13(2), 97. https://doi.org/10.19184/bisma.v13i2.9864.
Baqir, M., Husain, S., Waseem, R., and Anwarul Islam, K.M. (2020). Impact of Reward and Recognition, Supervisor Support on Employee Engagement. American International Journal of Business and Management Studies, 8–21. https://doi.org/10.46545/aijbms.v2i3.256.
Chevalier, S., Colombat, P., Lejeune, J., Guglielmin, B., Bouquet, M., Aubouin Bonnaventure, J., Coillot, H., and Fouquereau, E. (2022). Radiography Recognition of Radiographers in the Workplace : Why it Matters. Radiography, 28(3), 648–653. https://doi.org/10.1016/j.radi.2022.05.001.
Hardism. (2021).
Partial Least Square Structural Equation Modeling Analysis.
(Print I). Yogyakarta : Pustaka
Madani.
Hasibuan, S. P. (2019). Human Resource Management.
(Revised Edition). Jakarta : PT Bumi
Aksara.
Mustafidah, H., and Suwarsito. (2020). Fundamentals of Research Methodology (Print 1). Purwokerto : UM Purwokerto Press.
Pamungkas, S. A. (2018). Employee Engagement, Employee Performance, and Bank Performance from the Perspective of Front Office Employees of Islamic Banks in the City of Bandung. Proceedings of Industrial Research Workshop and National Seminar, 9, 642-647. https://doi.org/10.35313/irwns.v9i0.1108.
Pering, A. A. (2020). Path Analysis Study with Structural Equation Modeling (SEM) Smart-PLS 3.0. Satyagraha Journal.03(02), 28-48.
Rachmana, G., and Raharso, S. (2019). The Effect of Job Characteristics on Work Engagement at Indonesian Airlines. Journal of Business and Investment Research, 5(2), 28–38. https://doi.org/10.35313/jrbi.v5i2.1701.
Rai, A., Ghosh, P., Chauhan, R., and Singh, R. (2018). Improving in-Role and Extra-Role Performances with Rewards and Recognition : Does Engagement Mediate the Process ? Management Research Review, 41(8), 902–919. https://doi.org/10.1108/MRR-12-2016-0280.
Romadhona, Adelia F., and Wahyuningtyas, R. (2019). Commitment and Organizational Culture on Employee Performance at Bank BJB Tamansari Branch. Journal of Business and Management Research 12(1), 24. https://doi.org/10.23969/jrbm.v12i1.1523.
Sadiq, A., Rosita, S., and Aurora Lubis, T. (2022). The Effect of Reward and Recognition on Increasing Employee in-Role and Extra-Role Behavior Mediated by Employee Engagement at PetroChina International Jabung Ltd. Journal of Economic Paradigm, 17(2), 403–414. https://doi.org/10.22437/jpe.v17i2.18926.
Sinambela, L. P. and Sarton. (2021). Quantitative Research
Methods : Theoretical and Practice (Edition I,
Printing I). Depok : Rajawali Press.
Sucahyowati, H., and Hendrawan, A. (2020). The Effect of Employee
Engagement on Performance. Journal of Maritime Transportation Technology Science 2(2), 9–15.
Sugiyono. (2019). Educational Research Methods ; Quantitative, Qualitative, Combination, R&D, and Action Research (Edition III, Printing I). Bandung : Alphabet.
|
|
 This work is licensed under a: Creative Commons Attribution 4.0 International License
© IJETMR 2014-2023. All Rights Reserved.