
|
|
|
|
DEVELOPMENT OF A LOW-COST SOLAR PYRANOMETER
T. E. Amakoromo
1![]()
1 Department
of Physics/Electronics Technology, SSLT University of Port Harcourt, Nigeria
|
|
|
ABSTRACT |
|
|
Effective
solar projects require effective solar data collection, however with the high
cost of pyranometers in the market, there arose the need to construct a
low-cost device for the purpose of solar radiation measurements. A device was
thus developed in the University of Port Harcourt, River’s state, Nigeria by
utilizing a photodiode, a thermistor, a lcd among other readily available
components. Using a reference pyranometer for calibration, the device was
able to deliver a mean global solar radiation value of 16.00MJ/m2/day, while
the maximum value obtained during the test period was 20.70MJ/m2/day. The
performance of the locally developed device compares and competes favourably with what is available in the market. |
|||
|
Received 04 February 2023 Accepted 17 March 2023 Published 31 March 2023 Corresponding Author T.E. Amakoromo tarila.amakoromo@uniport.edu.ng DOI 10.29121/ijetmr.v10.i3.2023.1316 Funding: This research
received no specific grant from any funding agency in the public, commercial,
or not-for-profit sectors. Copyright: © 2023 The
Author(s). This work is licensed under a Creative Commons
Attribution 4.0 International License. With the
license CC-BY, authors retain the copyright, allowing anyone to download,
reuse, re-print, modify, distribute, and/or copy their contribution. The work
must be properly attributed to its author.
|
|||
|
Keywords: Solar, Photovoltaic,
Pyranometer, Irradiance, Calibration, Measurement |
|||


1. INTRODUCTION
With continuous degradation and harm caused the climate due to conventional global energy sources which is predominantly from fossils, there is need to deviate to renewable energy sources such as abundantly available solar energy Ayvazoğluyüksel & Filik (2018). Accumulated annual solar energy in the earth is said to be about 516 times greater than reserves of oil and about 157 times higher than reserves of coal deposits globally Nordell (2003). This implies that apart from being a friendly source of energy, solar energy is also heavily abundantly available. Nigeria, though located in the world’s solar belt and having sunshine that averages 6.25hours per day which is almost 5.25kWhm-2 per day of solar irradiance Energy Access and Energy Transition in Nigeria: The Crucial Role of off-Grid Solar—Oolu Solar (2023), still lags behind in proper utilization of this potential. Though several attempts have been made to implement solar powered projects in parts of the country, especially in rural areas for the purpose of water supply, power supply among others through the utilization of photovoltaics (PV) Oseni (2012), these projects almost always fail or do not fulfill their target or purposes. Among several reasons like, maintenance, funding, and lack of skilled personel to manage these projects Abdullahi et al. (2017), lies the fact that proper irradiance data is not collected from the location which will aid planning for capacity and storage considerations before such projects are sited. In this research, a low cost solar pyranometer for the purpose of collection solar irradiance data is being constructed and calibrated for use. Photovoltaic systems rely of solar radiation data at a particular site for the purpose of design and planning. Solar Irradiance is the measure of the power density of sunlight or the total power from a radiant source falling on a unit area Ibrahim et al. (2019)
2. MATERIALS AND METHODS
The materials used for the construction are as listed in Table 1
Table 1
|
Table 1 Materials Used |
|
|
S. No. |
Components |
|
1 |
Photodiode |
|
2 |
Microcontroller |
|
3 |
Liquid Crystal Display (LCD) |
|
4 |
Thermistor |
|
5 |
Operational Amplifier. |
|
7 |
Resistor |
|
8 |
Copper strip (Vero) board |
|
9 |
DIP IC socket |
|
11 |
Plastic Casing |
|
12 |
Teflon Cover |
|
13 |
Plastic Casing |
|
14 |
Digital Multimeter |
|
15 |
Batteries (9V DC) |
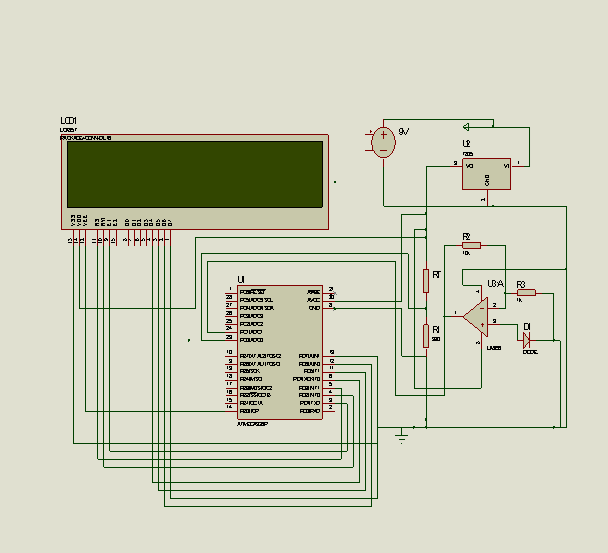
2.1. Schematic Circuit Diagram
The schematic for the pyranometer circuit was developed using Proteus VSM Professional Figure 1
Figure 1
|
Figure
1 Pyranometer Schematic (Drawn with
Proteus 6.0 Workbench) |
2.2. CONSTRUCTION
The main steps taken during the construction of pyranometer are outlined below:
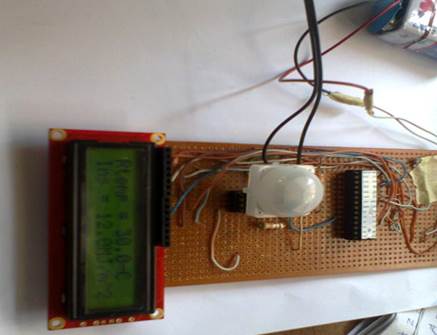
1) With the aid of the schematic circuit diagram, components were inserted onto a copper strip board (veroboard) and soldered, Figure 2. The photodiode and thermistor were soldered in such a way that they are accessible from within a casing.
2) Soldered connections were tested for shorts/open circuit using continuity function of a test digital multimeter.
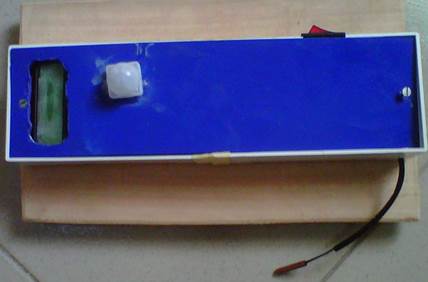
3) A plastic casing providing a suitable circular opening on top for placement of Teflon diffuser over photodiode was fabricated and used which also had opening for the thermal sensor as seen in Figure 3.
Figure 2
|
Figure
2 Internal Circuit with
Components Soldered to Veroboard |
Figure 3
|
Figure
3 Fabricated Plastic Casing for
Pyranometer |
2.3. Test and Calibration Procedures
Calibration was done based on Angstrom type model developed by Chukwuemeka and Nnabuchi (2009). This model is suitable for estimating the monthly average daily insolation in any given location in Nigeria such as Port Harcourt. The steps taken for calibration are outlined below:
1) Place Pyranometer on level horizontal surface
2) Take 4 set of hourly readings of the temperatures on LCD and test Digital multimeter. Also read off insolation ADC value of pyranometer at the measured temperatures.
3) Take the average insolation ADC values for temperatures greater than 27oC.
4) Repeat these readings for selected days for each week of the month and take the grand average. This value should be equivalent to the expected total daily mean.
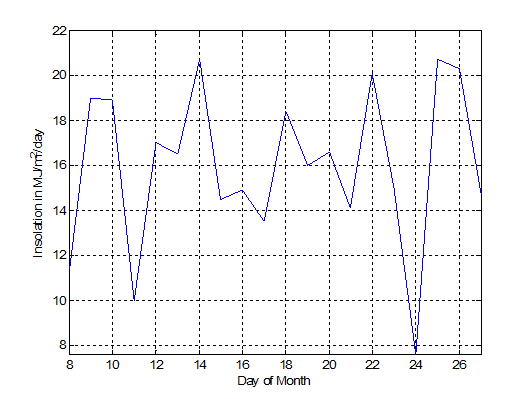
3. RESULTS AND DISCUSSIONS
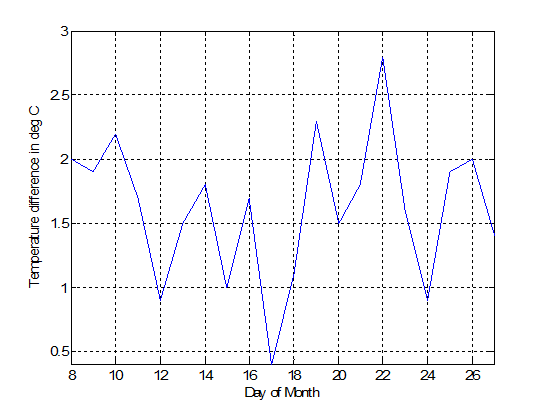
Using the model derived from Chukwuemeka and Nnabuchi (2009), the values of the daily global solar radiation (INS) on a horizontal surface calculated for the month of October, 2022, for Port Harcourt (late 4.85° N, long 7.02°E, and altitude 19.55m), Nigeria is as shown in Table 2 and plotted in Figure 4 using Matlab software program. The highest global solar radiation value of 20.70 MJ/m2/day was obtained on the 14th and 25th day, while the lowest value of 7.60 MJ/m2/day was obtained on the 24th day. The graph showed that the global solar radiation was on the decrease between the 10th and 12th day, and the 14th and 17th days. This may be attributed to the reduction of solar radiation due to cloud cover. The mean global solar radiation obtained for the month of October 2022 at Port Harcourt is 16.00MJ/m2/day. The temperature difference (Figure 5) is also highest on the 22nd day and lowest on the 17th day.
Table 2
|
Table 2 Temperature
Measurement and Solar Radiation at Port Harcourt |
||||
|
DAY OCT
2022 |
INS
(MJ/M2/DAY) |
TMAX(°C) |
TMIN(°C) |
Td(°C) |
|
8 |
11.40 |
27.10 |
25.10 |
2.00 |
|
9 |
19.00 |
26.80 |
24.90 |
1.90 |
|
|
18.90 |
27.50 |
25.30 |
2.20 |
|
11 |
10.00 |
26.70 |
25.00 |
1.70 |
|
12 |
17.00 |
25.80 |
24.90 |
0.90 |
|
13 |
16.50 |
26.60 |
25.10 |
1.50 |
|
14 |
20.70 |
26.80 |
25.00 |
1.80 |
|
15 |
14.50 |
27.20 |
26.20 |
1.00 |
|
16 |
14.90 |
27.00 |
25.30 |
1.70 |
|
17 |
13.50 |
26.80 |
26.40 |
0.40 |
|
18 |
18.40 |
27.20 |
26.10 |
1.10 |
|
19 |
16.00 |
27.40 |
25.10 |
2.30 |
|
20 |
16.60 |
26.80 |
25.30 |
1.50 |
|
21 |
14.10 |
27.20 |
25.40 |
1.80 |
|
22 |
20.10 |
28.10 |
25.30 |
2.80 |
|
23 |
15.00 |
26.90 |
25.30 |
1.60 |
|
24 |
7.60 |
26.20 |
25.30 |
0.90 |
|
25 |
20.70 |
27.30 |
25.40 |
1.90 |
|
26 |
20.30 |
27.30 |
25.30 |
2.00 |
|
27 |
14.70 |
26.60 |
25.20 |
1.40 |
Mean Global Solar Radiation (in Port Harcourt for the month of October 2012) =
(11.40+19.00+18.90+10.00+17.00+16.50+20.70+14.50+14.90+13.50+18.40+16.00+16.60+14.10+20.10+15.00+7.60+20.70+20.30+14.70)/20=
15.995=16.00 MJ/M2/DAY
Figure 4
|
Figure 4 Line Plots of Global Solar Radiation from October 8th to 27th, at Port Harcourt (as Plotted by Mathlab) |
Figure 5
|
Figure
5 Line Plots of Temperature
difference from October 8th to 27th 2022 at Port Harcourt (as Plotted by Mathlab) |
4. CONCLUSIONS And RECOMMENDATIONS
Utilizing locally available components and materials has made the construction process of developing a pyranometer affordable and straightforward. This does not however take away the fact that a proper understanding of the principles are of great importance. The Pyranometer was constructed and further calibrated against the Chukwuemeka and Nnabuchi (2009) model which is of a reputable quality with a calibration constant of 5230 ± 0.024mJm-2. The developed Pyranometer was studied and tested under live environmental conditions in the Port Harcourt, Rivers state environs of Nigeria. The yielded results were found to have competed favourably with the referenced standard.
It is recommended that longer periods of up to a year be
used to take measurements to ascertain more accuracy for such devices.
CONFLICT OF INTERESTS
None.
ACKNOWLEDGMENTS
The contributions of Professor O.E. Abumera, Professor T.C. Chineke, Professor C.N. Ehirim and Engr. Osegi to the success of this work is highly appreciated.
REFERENCES
Abdullahi, D., Suresh, S., Renukappa, S., & Oloke, D. (2017). Key Barriers to the Implementation of Solar Energy in Nigeria : A Critical Analysis. IOP Conference Series : Earth and Environmental Science, 83(1). https://doi.org/10.1088/1755-1315/83/1/012015
Ayvazoğluyüksel, Ö., & Filik, Ü. B. (2018). Estimation Methods of Global Solar Radiation, Cell Temperature and Solar Power Forecasting : A Review and Case Study in Eskişehir. Renewable and Sustainable Energy Reviews, 91(May) 2017, 639–653. https://doi.org/10.1016/j.rser.2018.03.084
Energy Access and Energy Transition in Nigeria : The Crucial Role of off-Grid Solar—Oolu Solar (2023).
Ibrahim, K. A., Gyuk, P. M., & Aliyu, S. (2019). The Effect of Solar Irradiation n Solar Cells. Sci. World J., 14(1).
Nordell, B. (2003). Thermal Pollution Causes Global Warming. Global and Planetary Change, 38(3–4), 305–312. https://doi.org/10.1016/S0921-8181(03)00113-9
Oseni, M. O. (2012). Improving Households’ Access to Electricity and Energy Consumption Pattern in Nigeria : Renewable Energy Alternative. Renewable and Sustainable Energy Reviews, 16(6), 3967–3974. https://doi.org/10.1016/j.rser.2012.03.010
|
|
 This work is licensed under a: Creative Commons Attribution 4.0 International License
© IJETMR 2014-2023. All Rights Reserved.