
|
|
|
|
IMPACT OF GLOBAL WARMING ON AQUACULTURE IN NORWAY
M. Cüneyt Bağdatli 1![]()
![]() ,
İlknur Uçak 2, Wadah Elsheikh 2
,
İlknur Uçak 2, Wadah Elsheikh 2
1 Nigde Omer Halisdemir University, Faculty of
Architecture, Department of City and Regional Planning, Nigde,
Turkey
2 Nigde Omer Halisdemir University, Faculty of
Agricultural Sciences and Technologies, Nigde, Turkey
|
|
|
ABSTRACT |
|
|
While aquaculture is predicted to play a significant role in addressing future global food demands, climate change is having a complex impact on aquaculture output. Climate change will have an effect on output levels, growth, feeding efficiency, and consequently farm productivity and profitability. The most significant challenges facing aquaculture are current and future climate change, which affects the viability of fish farming in Norway and around the world. Global warming and climate change have resulted in a decline in lake waters, an increase in sea level, changes in streams, and changes in precipitation models, all of which have begun to have a negative influence on all aquatic animals. According to the findings of this study, the yearly maximum temperature was 21.1 °C in July and the lowest was -2.8 °C in January, with the minimum temperature ranging from 13.5 °C in July to -7.5 °C in January. The highest average temperature was 17.4 °C in July, and the lowest was -5.1 °C in January. In terms of precipitation, the greatest was 118 mm in August, while the lowest was 56 mm in March. In terms of rainy days, the highest total was 11 mm in August, while the lowest total was 6 mm in March. In November, the humidity reached 90%, whereas in June, it was 66%. On bright days, the highest daylight hours were recorded in June at 12.1 hours, and the lowest hours were recorded in December at 2.5 hours. In this research, we explicitly investigated how these climate components may affect aquaculture in Norway. As a result, because it affects the stability of fish farming, this significant environmental issue must be addressed. It is critical to shed light on and thoroughly analyse the elements related to climate change in order to avoid the damages that result from them, as well as to identify strategies to adapt to these conditions and limit their effects on production and productivity. Corrective efforts should be implemented to reduce climate change and its consequences on fish output. |
|||
|
Received 28 February 2023 Accepted 01 March 2023 Published 17 March 2023 Corresponding Author M. Cüneyt Bağdatli, cuneytbagdatli@gmail.com DOI 10.29121/ijetmr.v10.i3.2023.1307
Funding: This research
received no specific grant from any funding agency in the public, commercial,
or not-for-profit sectors. Copyright: © 2023 The
Author(s). This work is licensed under a Creative Commons
Attribution 4.0 International License. With the
license CC-BY, authors retain the copyright, allowing anyone to download,
reuse, re-print, modify, distribute, and/or copy their contribution. The work
must be properly attributed to its author.
|
|||
|
Keywords: Global
Warming, Climate Change, Aquaculture, Norway |
|||


1. INTRODUCTION
Climate change is affecting marine environments all around the world IPCC. (2014). with a rise in global mean surface air temperature ranging from 1°C to 4°C by 2100, depending on the greenhouse gas emission scenario adopted. Finfish aquaculture is becoming an increasingly important source of protein production for human consumption, adds to food security, and accounts for more than half of worldwide seafood output as the world's population increases food demand. Aquaculture is projected to become even more important in the future due to overexploitation of wild fish supplies Food and Agriculture Organization. (2018). Food production is a critical component of the climate challenge, and aquaculture is critical for global food security. According to the OECD/FAO, aquaculture production will surpass wild catch fisheries in volume for the first time in 2022 (Organization for Economic Co-Operation and Development, and F. A. O. (2019)). Norway is the world's leading producer of Atlantic salmon, and aquaculture is Norway's second most important export industry. The majority of the world's aquaculture production is carried out by small-scale growers in the global south Galappaththi et al. (2020).
Climate change has put the world in jeopardy
as a result of increased carbon emissions and greenhouse gas emissions. Carbon
is one of the most basic elements of life and exhibits search without being
fixed. The level of CO2 diminishes the protective effect of the bard
layer. This has the effect of causing irregular precipitation and severe
temperature increases Bağdatlı and Arıkan
(2020). Population expansion, combined with the climate
change phenomenon, will generate multiple problems for the global food supply,
and we will confront numerous nutritional issues in the near future. By
gradually attaining the world's 8 billion population, humanity faces a serious
difficulty in meeting the expanding population's food needs Bağdatlı et al. (2015). Depending on population
growth, it is very important to determine different food sources beforehand and
to know the total production Oztekin (2021), Oztekin and Dingil
(2022).
Today, there are many studies conducted to
improve traditional agriculture Oztekin (2012), Oztekin (2021). However, climate change and increasing needs create
the need for production in different areas. Aquaculture production has
increased dramatically in recent decades, with global output increasing from
2.6 million metric tons (mt) in 1970 to 87.5 million mt in 2020 FAO (2022). This has been accomplished through
widespread margin growth, as production has risen in new nations and for new
species, as well as intense margin growth, as new knowledge and technology have
led to more intensive production practices, typically on a bigger scale Asche et al. (2022). In fact,
compared to wild fisheries landings, aquaculture output is concentrated on a
few species, with carp, oysters, salmon, shrimp, and tilapia becoming genuinely
global species farmed across many continents Garlock et al. (2020). The key drivers of this process are innovations,
including information transfer and agricultural adoptions that contribute to
increased productivity and cheaper production costs Kumar and Engle (2016).
Salmon is one of the most successful
aquaculture species in terms of production growth, with a growth rate that is
faster than overall aquaculture production growth, and it is the world's second
largest species by value after shrimp Asche et al. (2022). Furthermore, it is technologically advanced in a
variety of aspects, from inputs to the manufacturing process and the supply
chain Kumar and Engle (2016). Norway is the largest producer, accounting for more
than half of all production in most years Iversen et al. (2020).
Norwegian salmon has a
similar role not only in salmon aquaculture, but also in aquaculture
internationally, as knowledge and technology from salmon are transferred to
other species Kumar
and Engle (2016).
Norwegian salmon aquaculture consists of two
species, Atlantic salmon (Salmo salar) and rainbow trout (Onchorynchus mykiss),
and began in the 1950s as a "backyard business" by fisherman with a
variety of alternative production concepts mostly inspired by the European
trout industry Asche and Bjorndal (2011). Because Norway is a tiny country with a population
of roughly 5 million people, the domestic market quickly became saturated, and
the sector shifted to worldwide markets, exporting more than 95% of its
production to over 100 countries Straume et al. (2020). Many obstacles confronting aquaculture both raise
production costs, providing private incentives to fix the issue, and have
environmental externalities that have necessitated actions or resulted in the
use of alternative structures or sites to avoid the issues Asche et al. (2022). This incentivizes innovation. For illustrate, early
tiny farms frequently operated in areas with poor water quality and
oxygenation, which were aggravated by the farms and offered incentives to
relocate farms to more exposed regions. Moving farms to progressively more
exposed offshore locations has recently been encouraged in part by decreased
salmon lice numbers Afewerki
et al. (2023).
Climate change can stymie
long-term progress in the aquaculture business by magnifying and compounding
other environmental issues. Climate change may cause significant structural
changes in aquaculture, including changes in fish species, optimal production
range, and siting patterns. Temperature is critical in the aquaculture sector
because it affects growth rate, algal blooms, and disease and parasite
infestation rates. A warmer thermal regime may cause changes in species
abundance, distribution, and composition. This includes jellyfish, poisonous
algae, parasites, viruses, and illnesses, all of which have the potential to
affect aquaculture, and the link between climate change and disease risks is
becoming increasingly clear Callaway et al. (2012). Furthermore, atmospheric elements that include the
climate variables such as air temperature, precipitation, relative humidity,
atmospheric pressure, wind speed, etc., and the air pollutants affect each
other in the atmospheric periphery Zateroglu (2021a), Zateroglu (2021d). Additionally, an increment in the emissions of air
pollutants originated from anthropogenic and natural sources i.e., power
plants, motor vehicles, fossil fuel combustion for domestic heating and
industrial usage, population growth, has an impact on the urban climate system,
degrade the urban air quality, and contribute the climate change Zateroglu (2021a), Zateroglu (2021d), Zateroglu (2021e), Zateroglu (2022).
Weather and climate have a significant impact
on all sorts of agriculture, including aquaculture. The main issues influencing
aquaculture include high temperatures, varying evaporation degrees, decreased
rainfall, and high water consumption needs. Water temperature has a significant
impact on aquaculture production Elsheikh et al. (2022a). Therefore, the purpose of this study is to
investigate the effects of climate change on aquaculture productivity in
Norway.
2.
MATERIAL AND METHOD
The Norwegian coast is
21,000 kilometers long, with enormous potential for developing the country's
fisheries and marine aquaculture. Norway has 90,000 km2 of sea under its
authority, which is almost one-third of the entire land area.
The fishing industry has been a key industry in Norway throughout its history. Because of the country's geographical characteristics, vast coastline, and climatic variables, it is well suited for this business. According to the most recent FAO statistics, Norway was the ninth largest capture fishery and the seventh largest aquaculture producer in 2018 Organization for Economic Co-Operation and Development, and F. A. O. (2019). This study was conducted in Norway to study the effects of climate change on aquaculture Figure 1.
Figure 1

|
Figure 1 The Location of Research Area |
In this study, the linear regression approach was used to
analyze climate data, and the standard deviation was also obtained. The Linear
Regression Model is the most often used type of regression in applications, and
it is one of statistics' oldest and most investigated areas. Regression
analysis is a statistical technique for explaining quantitative relationships
between one or more explanatory variables and a response variable Salihi and Üçler
(2021), Zateroglu (2021b), Zateroglu (2021c), Zateroglu (2021f), Zateroglu (2022).
3. RESEARCH FINDINGS
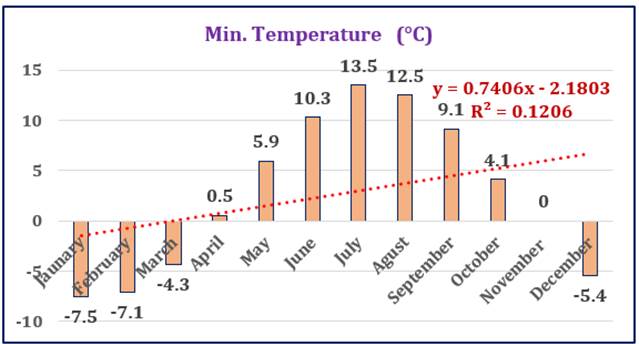
The long-term minimum, maximum, and average temperatures (°C), precipitation (mm), humidity (%), rainy days, and sunny hours data from the study region were studied in this study. Figure 2 depicts a fluctuation graph of the minimum temperature data.
Figure 2
|
Figure 2 The Distributions of Min. Temperature |
The minimum temperature ranged from 15.4 °C in January to
-7.5 °C in June. R2 for
Minimum temperature is 0.1206 which mean actual values are not closer to
predicted values. The variation graph of
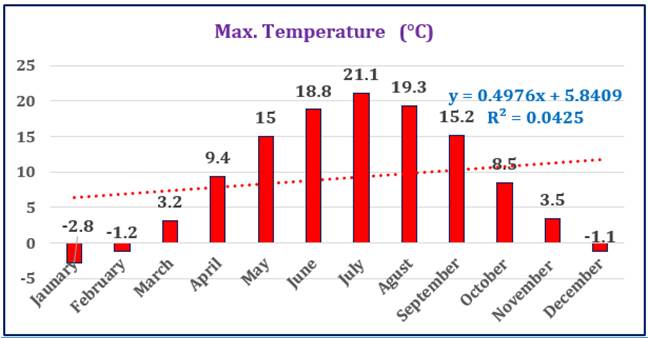
the max temperature data is shown in Figure 3.
Figure 3
|
Figure 3 The Distributions of Max. Temperature |
The annual maximum temperature was 21.1 °C in June, while the
lowest maximum temperature was -2.8 °C in January. The R2 for the
highest temperature is 0.0425, indicating that actual measurements and
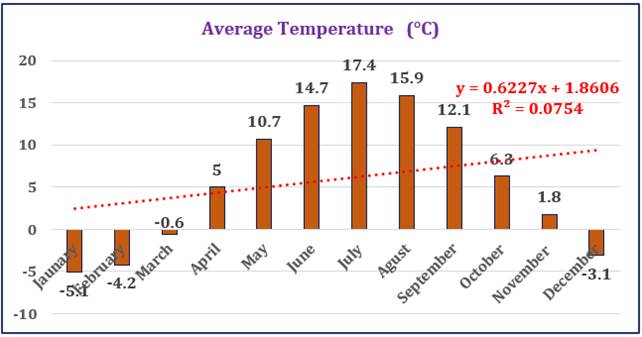
projections are not very closely related. Figure 4 depicts a fluctuation graph
of average temperature data.
Figure
4
|
Figure 4 The Distributions of Average Temperature |
The
highest average temperature was 17.4 °C in July and the lowest was -5.1 °C in
January. R2 is 0.0754, indicating that real values are not much
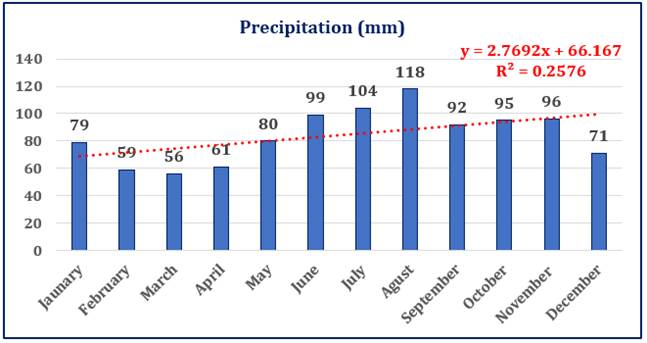
closer to projected values. Figure 5 depicts the Change graph of
Precipitation data.
Figure
5
|
Figure 5 The distributions of Precipitation |
In
terms of precipitation, the highest total was 118 mm in August, while the lowest
total was 56 mm in March. R2 is 0.2576, indicating that actual
values are not considerably closer to expected values. Figure 6 depicts the Rainy Days Change
Graph.
Figure
6
|
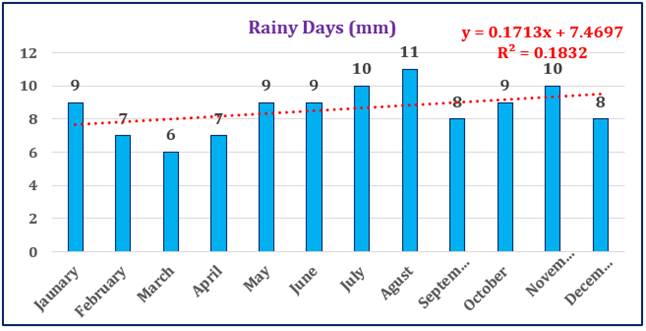
Figure 6 The distributions of Rainy Days |
The rainy days in the study area had the highest value of 11 mm
in August and the lowest value of 6 mm in March, with an R2 of
0.1832, indicating that actual values are not substantially closer to
expectations. The change graph of humudity is shown in Figure 7.
Figure
7

|
Figure 7 The distributions of Humidity |
The
maximum humidity was 90% in November and the lowest was 66% in June. R2 was
0.0693, indicating that actual values are not significantly closer to
expectations. The variation graph of the sunny days are shown in Figure 8.
Figure
8
|
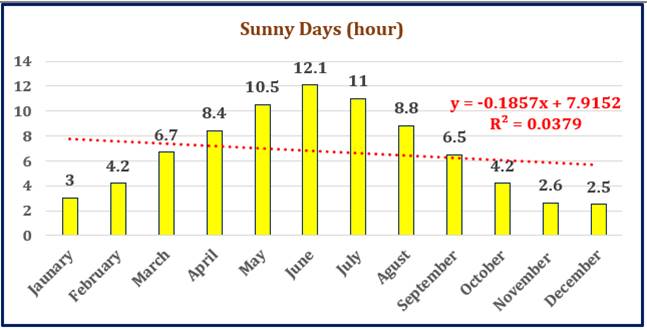
Figure 8 The distributions of Sunny Days |
The maximum daylight hours were observed in June, when it was
12.1 hours, while the lowest hours were reported in February, when it was 3
hours. or sunny days, R2 is 0.0379, indicating that actual values
are not much closer to predictions. Table 1 summarizes the annual average
and total values of some climate data, as well as the corresponding R2
and standard deviations.
Table 1
|
Table 1 The average or total values and standard deviation of some climate data for Norway |
||
|
Climate Parameters |
Average |
Standard deviation |
|
Min. Temperature (°C) |
2.63 |
7.6892 |
|
Max. Temperature (°C) |
9.08 |
8.6995 |
|
Average Temperature (°C) |
5.91 |
8.1754 |
|
Precipitation (mm) (Total) |
1010.00 |
19.6739 |
|
Humidity (%) |
79.58 |
8.2842 |
|
Rainy Days (Total) |
103 |
1.4434 |
|
Sunny Hours (hour) |
6.71 |
3.4387 |
Table 1 shows the climatic change data, including average
temperatures (°C), minimum temperatures (°C), maximum temperatures (°C),
precipitation (mm), humidity (%), rainy days, and sunny hours for the whole
year. When we look at the standard deviation, average temperature, lowest
temperature, maximum temperature, and humidity all have almost the same value
but a lower value than precipitation. Rainy days and sunny hours have lower
values than all other variables, indicating that these variables have
relatively little variability across all months of the year; however,
precipitation fluctuates so much since it has the largest standard deviation
value.
Norwegian aquaculture has
grown rapidly, particularly in the new millennium. The industry has improved in
terms of biological elements and engineering, and new potential aquaculture
species other than salmonids are emerging. This advancement, however, has
brought forth some severe issues that must be recognized Bergheim (2012). Norway produced 4 million tonnes of fish (including
mollusks and crustaceans) in 2018, worth USD 10814.6 million. Aquaculture
contributed 77% of this value, while fisheries contributed 23%. The quantity
generated climbed by 17% between 2008 and 2018, but the value increased by 104%
Organization for Economic
Co-Operation and Development. (2021).
Due to the thermal
dependence of metabolic activity, predicted temperature changes are expected to
have a major influence on ectothermic creatures such as fish. The last three
decades have been noticeably warmer, with a rise in global surface temperature
of +0.2 °C every decade. Climate forecasts for the next century show an
increase in sea surface temperature of 1 to 3 degrees Celsius (DeLong et
al., 2017; Morley et al., 2018).
Furthermore, global circulation models forecast a rise in ocean heat content
due to ice sheet and glacier mass loss, as well as an increase in the
frequency, severity, and duration of extreme events. Warming trends have been
more pronounced in the Northern Hemisphere than in the Southern Hemisphere, and
warming rates are generally larger at higher latitudes than in tropical regions
IPCC. (2019), Tokarska and Gillett (2018).
Climate change is
predicted to endanger marine ecosystems and, as a result, aquaculture.
Increasing sea temperatures may eventually cause significant changes in
aquaculture species, optimal production ranges, and localization patterns.
Increasing sea temperatures will cause a shift in the distribution of creatures
in the water, including seaweeds, as well as a general northward shift of
farmed organisms. Rising summer sea surface temperatures could be a concern for
farmed animals acclimated to survive in cold water. As a result, aquaculture
species productivity may suffer, and Southern Norway may become less
appropriate for species such as salmon, with socioeconomic consequences Hermansen and Heen (2012), Stévant et al. (2017). Such climate changes
may eventually result in northern areas being more suitable for mariculture
than southern parts Bergh et al. (2007). A study conducted by Callaway et al. (2012) on the effects of
climate change on aquaculture species in the United Kingdom and Ireland
concluded that increased sea temperatures and changes in hydrodynamic regimes
will have an impact on macroalgal cultivation; however, the effects will likely
vary depending on species and geographic location Stévant et al. (2017). The aquaculture value
chain is a growing sector of the Norwegian fish industry, with an estimated
33,700 employees in 2017 Johansen et al. (2019).
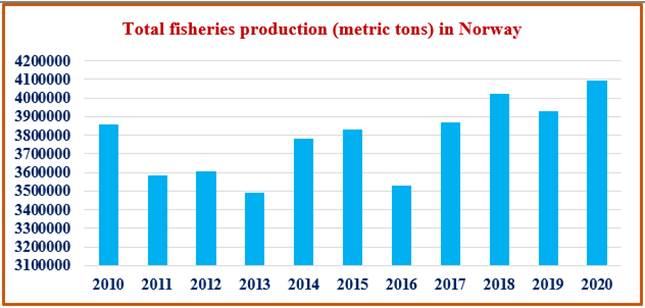
The aquaculture industry is reliant on the water quality
and meteorological conditions along the Norwegian coast. The largest influence
of climate change is thought to be on ocean temperatures and the frequency of
extreme weather. Ocean acidification and salinity changes caused by increased
freshwater intrusion into the straits may have an influence on this area in the
long run. Which affects the contribution of fish farming to
the annual fish production in Norway, as shown in Figure
9 World, B. (2020).
Figure 9
|
Figure 9 Total Fisheries Production In Norway (World Bank, 2020) |
4. CONCLUSION
and RECOMMENDATIONS
Climate change has put the world at risk as a
result of increased carbon emissions and greenhouse gas emissions. The level of
CO2 reduces the protective use of the bard layer. As a result of this action,
it produces unpredictable precipitation and severe temperature increases Bağdatlı and Arıkan
(2020). Temperature extremes have a harmful impact on the lives of
living creatures Bağdatlı and Can (2020), Afreen et al. (2022). Climate change and global warming are diminishing accessible
water resources practically everywhere on the planet Uçak and Bağdatlı
(2017), Elsheikh et al. (2022b).
Aquaculture and fisheries
provide a safe refuge for millions of people who rely on them to sustain a
decent standard of living. On the other hand, climate change is a huge threat
to global fisheries and fish farming. As a result, this significant
environmental issue must be addressed as it affects the stability of fish
farming, which provides a source of income for millions of families in addition
to being an essential food supply.
As a result, it is critical to shine a light on and thoroughly analyze the elements related to climate change in order to avoid the damages that come from them, as well as to identify strategies to adapt to these conditions and limit their effects on production and productivity. Future studies should be directly tied to adaptation to climate change. Rising sea temperatures are projected to threaten marine ecosystems by causing dramatic changes in aquaculture species, optimal production ranges, and settlement patterns, and southern Norway may become less suited for species such as salmon. All of these may have an impact on the production of aquaculture species.
CONFLICT OF INTERESTS
None.
ACKNOWLEDGMENTS
None.
REFERENCES
Afewerki, S., Asche, F., Misund, B., Thorvaldsen, T., and Tveteras, R. (2023). Innovation In The Norwegian Aquaculture Industry. Reviews In Aquaculture, 15(2), 759-771. https://doi.org/10.1111/raq.12755.
Afreen, M., Uçak, İ., and Bağdatlı, M. C. (2022). The Analysis of Climate Variability on Aquaculture Production in Karachi of Pakistan. International Journal of Engineering Technologies and Management Research, 9(8), 16-23. https://doi.org/10.29121/ijetmr.v9.i8.2022.1210.
Asche,
F., Eggert, H., Oglend, A., Roheim, C. A., and Smith, M. D. (2022).
Aquaculture : Externalities and Policy Options. Review of Environmental
Economics and Policy, 16(2), 282-305. https://doi.org/10.1086/721055.
Asche,
F., and Bjorndal, T. (2011). The Economics of Salmon Aquaculture. John
Wiley and Sons.
https://doi.org/10.1002/9781119993384.
Bağdatlı, M. C., Bellitürk, K., and Jabbari, A. (2015). Possible Effects on Soil and Water Resources Observed In Nevşehir Province In Long Annual Temperature and Rain Changing. Eurasian Journal of Forest Science, 3(2), 19-27. https://doi.org/10.31195/ejejfs.333091.
Bağdatlı, M. C., and Arıkan, E. N. (2020). Evaluation of Monthly Maximum, Minimum and Average Temperature Changes Observed for Many Years in Nevsehir Province of Turkey, World Research Journal of Agricultural Science (WRJAS), 7(2), 209-220.
Bağdatlı, M. C., and Can, E. (2020). Temperature Changes of Niğde Province in Turkey: Trend Analysis of 50 Years Data. International Journal of Ecology And Development Research (IJEDR), 6(2), 62-71. https://doi.org/10.5281/zenodo.3903763.
Bergh, Ø., Asplin, L., Boxaspen, K., Lorentzen, T., Nylund, A., Ottem, K., and Sundby, S. (2007). Climate Change-Its Consequences for Norwegian Aquaculture. Institute of Marine Research. 12.
Bergheim, A. (2012). Recent Growth Trends and Challenges in the Norwegian Aquaculture Industry. Latin American Journal of Aquatic Research, 40(3), 800-807.
Callaway, R., Shinn, A. P., Grenfell, S. E., Bron, J. E., Burnell, G., Cook, E. J., Crumlish, M., Culloty, S., Davidson, K., Ellis, R. P., Flynn, K. J., Fox, C., Green, D. M., Hays, G. C., Hughes, A. D., Johnston, E., Lowe, C. D., Lupatsch, I., Malham, S., And Shields, R. J. (2012). Review of Climate Change Impacts on Marine Aquaculture in the UK and Ireland. Aquatic Conservation : Marine and Freshwater Ecosystems, 22(3), 389-421. https://doi.org/10.1002/aqc.2247.
Delong,
J. P., Gibert, J. P., Luhring, T. M., Bachman, G., Reed, B., Neyer, A., and
Montooth, K. L. (2017). The Combined Effects of Reactant Kinetics and
Enzyme Stability Explain The Temperature Dependence of Metabolic Rates. Ecology
and Evolution, 7(11), 3940-3950. https://doi.org/10.1002/ece3.2955.
Elsheikh,
W., Uçak, İ., Bağdatlı, M. C., and Mofid, A. (2022b).
Effect of Climate Change on Agricultural Production : A Case Study Khartoum
State, Sudan, Open Access Journal of Agricultural Research (OAJAR), 7(3), 1-10. https://doi.org/10.23880/oajar-16000299.
Elsheikh, W., Uçak, İ., and Bağdatlı, M. C. (2022a). The Assessment of Global Warming on Fish Production in Red Sea Region of Sudan. Eurasian Journal of Agricultural Research, 6(2), 110-119.
Food and Agriculture Organization. (2018). The State of World Fisheries and Aquaculture, 2018 - Meeting The Sustainable Development Goals. Rome, 227.
Galappaththi,
E. K., Ichien, S. T., Hyman, A. A., Aubrac, C. J., and Ford, J. D. (2020).
Climate Change Adaptation in Aquaculture. Reviews in Aquaculture, 12(4), 2160-2176. https://doi.org/10.1111/raq.12427.
Garlock, T., Asche, F., Anderson, J., Bjørndal, T., Kumar, G.,
Lorenzen, K., Ropicki, A., Smith, M. D., and Tveterås, R. (2020). A
Global Blue Revolution : Aquaculture Growth Across Regions, Species, and
Countries. Reviews In Fisheries Science and Aquaculture, 28(1), 107-116. https://doi.org/10.1080/23308249.2019.1678111.
Hermansen, Ø., and Heen, K. (2012). Norwegian Salmonid Farming and Global Warming: Socioeconomic Impacts. Aquaculture Economics and Management, 16(3), 202-221. https://doi.org/10.1080/13657305.2012.704617.
IPCC. (2014). Synthesis Report. Climate Change. Intergovernmental Panel on Climate Change.
IPCC. (2019). Summary For Policymakers. Ipcc Special Report on the Ocean and Cryosphere in a Changing Climate H. O. Pörtner Et Al. (Eds.).
Iversen, A., Asche, F., Hermansen, Ø., and
Nystøyl, R. (2020). Production Cost and Competitiveness in Major Salmon
Farming Countries 2003-2018. Aquaculture, 522, 735089. https://doi.org/10.1016/j.aquaculture.2020.735089.
Johansen, U., Bull-Berg, H., Vik, L. H., Stokka, A. M.,
Richardsen, R., And Winther, U. (2019). The Norwegian Seafood
Industry-Importance For The National Economy. Marine Policy, 110, 103561. https://doi.org/10.1016/j.marpol.2019.103561.
Kumar, G., and Engle, C. R. (2016). Technological Advances that
Led to Growth of Shrimp, Salmon and Tilapia Farming. Reviews In Fisheries
Science and Aquaculture, 24(2), 136-152. https://doi.org/10.1080/23308249.2015.1112357.
Morley, J. W., Selden, R. L., Latour, R. J., Frölicher, T. L., Seagraves, R. J., and Pinsky, M. L. (2018). Projecting Shifts in Thermal Habitat For 686 Species on the North American Continental Shelf. PLOS ONE, 13(5), E0196127. https://doi.org/10.1371/journal.pone.0196127.
Organization for Economic Co-Operation And Development, and F. A. O. (2019). OECD-FAO Agricultural Outlook 2019-2028. OECD Publishing/Food and Agriculture Organization of The United Nations. https://doi.org/10.1787/agr_outlook-2019-en.
Organization for Economic Co-Operation and Development. (2021). Fisheries and Aquaculture in Norway January 2021. OECD Review of Fisheries Country Note.
Oztekin, M. E. (2012). Monitoring and Determination of Land Use Types in Large Scale Irrigation Project Areas In Mediterranean Region of Turkey. Journal of Food, Agriculture and Environment, 10(2), 1065-1068.
Oztekin, M. E. (2021). Mera Alanlarının Worldview Uydu Görüntüsü Kullanılarak Tespiti. 6th International Mediterranean Science and Engineering Congress (IMSEC 2021) Alanya, Antalya/Turkey, Paper ID 245, 1-4.
Oztekin, M. E., Antmen, Z. F., and Onat, B. (2021). Monitoring and Yield Estimation Of Soybean Using Satellite Data in North Yüreğir Region, Adana Turkey. Fresenius Environmental Bulletin, 30(06A), 6602-6608.
Oztekin, M. E., and Dingil, M. (2022). Determination of Corn Planting Areas and Yield Forecasting Using Landsat Images. Fresenius Environmental Bulletin, 31(04), 4420-4426.
Salihi, P. B. A., and Üçler, N. (2021). The Effect of the Data Type on Anfis Results, Case Study Temperature and Relative Humidity. Journal of Scientific Reports-A, 046, 14-33.
Straume, H., Landazuri-Tveteraas, U., and Oglend, A. (2020).
Insights from Transaction Data : Norwegian Aquaculture Exports. Aquaculture
Economics And Management, 24(3), 255-272. https://doi.org/10.1080/13657305.2019.1683914.
Stévant, P., Rebours, C., and Chapman, A. (2017). Seaweed
Aquaculture in Norway: Recent Industrial Developments and Future Perspectives.
Aquaculture International, 25(4), 1373-1390. https://doi.org/10.1007/s10499-017-0120-7.
Tokarska, K. B., and Gillett, N. P. (2018). Cumulative
Carbon Emissions Budgets Consistent With 1.5 C Global Warming. Nature Climate
Change, 8(4), 296-299.
https://doi.org/10.1038/s41558-018-0118-9.
Uçak, A. B., and Bağdatlı, M. C. (2017). Effects of Deficit Irrigation Treatments on Seed Yield, Oil Ratio and Water Use Efficiency of Sunflower (Helianthus Annuus L.). Fresenius Environmental Bulletin, 26(4), 2983-2991.
World, B. (2020). Total Fisheries Production (Metric Tons) - Norway.
Zateroglu, M. T. (2021a). Evaluating the Sunshine Duration Characteristics in Association with Other Climate Variables. European Journal of Science and Technology, 29, 200-207. https://doi.org/10.31590/ejosat.1022639.
Zateroglu, M. T. (2021b). Statistical Models for Sunshine Duration Related to Precipitation and Relative Humidity. European Journal of Science and Technology, 29, 208-213. https://doi.org/10.31590/ejosat.1022962.
Zateroglu, M. T. (2021c). Assessment of the Effects of Air Pollution Parameters on Sunshine Duration in Six Cities in Turkey. Fresenius Environmental Bulletin, 30(02A), 2251-2269.
Zateroglu, M. T. (2021d). The Role of Climate Factors on Air Pollutants (PM10 and SO2). Fresenius Environmental Bulletin, 30(11), 12029-12036.
Zateroglu, M. T. (2021e). A Statistical Analysis of Sunshine Duration in Diyarbakir, Turkey. International Journal of Research in Engineering and Science (IJRES), 9(8), 59-63.
Zateroglu, M. T. (2021f). The Effect of Cloud Amount and Changes in Sunshine Duration. International Journal of Engineering Science and Computing (Ijesc), 11(8), 28598- 28601.
Zateroglu, M. T. (2022). Modelling the Air Quality Index for Bolu, Turkey. Carpathian Journal of Earth and Environmental Sciences, 17(1), 119-130. https://doi.org/10.26471/cjees/2022/017/206.
|
|
 This work is licensed under a: Creative Commons Attribution 4.0 International License
© IJETMR 2014-2023. All Rights Reserved.