
|
|
|
|
Compliance of Thermal Comfort Parameters within the Students’ Dormitory, Residential, and Pusat Islam Engineering Campus, USM based on Industry Code of Practice on Indoor Air Quality (ICOP) 2010
Ummi Zulaikha Ahmad Halili 1![]() , Nor Azam Ramli 1
, Nor Azam Ramli 1![]() , Nur Baitul Izati Rasli
1
, Nur Baitul Izati Rasli
1![]()
![]()
1 School
of Civil Engineering, Universiti Sains Malaysia,
14300 Nibong Tebal, Penang,
Malaysia
|
|
|
ABSTRACT |
|
|
This study
assessed occupants’ satisfaction with their surrounding temperature
conditions. The study was carried out
at the student’s dormitory, residential and prayer hall of Pusat Islam
Engineering Campus, USM. It entailed
determining the compliance of thermal comfort parameters; temperature (T),
relative humidity (RH) and air movement (AM).
The parameters are then used as input in the Center for the Built
Environment (CBE) Thermal Comfort Tool to obtain Predicted Mean Value (PMV)
and Predicted Percentage Dissatisfied (PPD) for ASHRAE Standard-55. The monitoring for this study was conducted
for three hours in a three-time period; 6 A.M. - 9 A.M., 11 A.M. - 2 P.M.,
and 5 P.M. - 8 P.M. for students’ dormitory and residential. For monitoring at Pusat Islam, it was
conducted in two slots; 11 A.M. - 2 P.M. and 6 P.M. - 10 P.M., and it was
assessed during Ramadan when the Muslims perform the Teraweh
prayer. Overall, the finding indicates
that most of the time, the thermal comfort parameters at the three monitoring
places did not comply with the (Industry Code of Practice on Indoor Air
Quality) ICOP limit. Hence, it also
influenced the PMV and PPD values which did not adhere to the ASHRAE
Standard-55. This could be due to the
poor design of the building where the plan itself does not promote
cross-ventilation, the high outdoor temperature, and insufficient indoor air
movement, thus causing discomfort to the occupants. |
|||
|
Received 23 July 2022 Accepted 24 August 2022 Published 12 September 2022 Corresponding Author Nur
Baitul Izati Rasli, nurbaitulizati@gmail.com DOI10.29121/ijetmr.v9.i9.2022.1222 Funding: This study was
funded by EACAR, USM. Copyright: © 2022 The
Author(s). This work is licensed under a Creative Commons
Attribution 4.0 International License. With the
license CC-BY, authors retain the copyright, allowing anyone to download,
reuse, re-print, modify, distribute, and/or copy their contribution. The work
must be properly attributed to its author.
|
|||
|
Keywords: Indoor, PMV,
PPD, Prayer Hall, Thermal Comfort, Ventilation |
|||


1. INTRODUCTION
Thermal comfort
is a state of mind in which a person is satisfied with their thermal
surroundings. A person’s sense of thermal comfort is primarily due to the
body’s heat exchange with the environment. Four parameters influence this
condition; air temperature, radiant temperature, humidity, and airspeed, which
constitute the thermal environment. Meanwhile, two personal parameters; are
clothing and activity level or metabolic rate Olesen and Brager
(2004).
According to Wafi and Ismail (2010), thermal comfort which is highly associated
with climatic and human factors, is crucial for hostel occupants regarding
students’ physical and psychological wellbeing. The factors like solar
radiation, surface reflection from walls and the orientation of buildings are
highly associated. One of the ways that contribute to better comfort is by
improving ventilation. The sound ventilation system provides thermal comfort by
controlling temperature and humidity, distributing sufficient air to occupants,
and eliminating contaminants.
Adequate ventilation is crucial as people spend
more than 90% of their time indoors Lee and Chang (2000). The same goes for the students, who also
spend most of their time indoors.
Therefore, excellent indoor air quality is necessary for their
well-being.
The thermal comfort in the dormitory, residential
and prayer hall is crucial as it is closely related to comfort and functional
performance. Hence, knowing the
compliance of thermal comfort parameters in students’ dormitory, residential
and prayer halls can ensure their comfort and working performance.
2. Materials and methods
2.1. Sampling Location
University Science Malaysia, (USM) Engineering Campus Nibong Tebal is located south of Seberang Perai and strategically situated amid three small towns of three neighbouring states: Nibong Tebal, Pulau Pinang, Bandar Baharu, Kedah and Parit Buntar, Perak. It was the only higher learning institution in the vicinity. The modern concept of the landscape and the layouts of the building add to its uniqueness and distinctive. This campus is the only higher learning institution in the suburb.
This campus can be accessed via North-South Highway (E1) route and the exit tollway at Jawi Toll (from the North) and Bandar Baharu Toll (from the South). There were three sampling locations, which are at SH3 Lembaran, the student’s dormitory, residential and prayer hall at Pusat Islam USM, Engineering Campus.
Each student’s dormitory consists of three students and three single beds at each corner of the room. Natural ventilation through the windows is the common ventilation form in the dormitory. Figure 1 and Figure 2 show the students’ dormitory location and the furniture arrangement. The overview of residential and Pusat Islam are shown in Figure 3 and Figure 4, respectively
2.2. Selection of Monitoring Instruments
There were two types of instrumentation to measure the parameters. The T-RH Data Logger and air Flow Meter were used to measure T, RH, and AM. The T-RH Data Logger is placed 1.2 m above the ground at one sampling point and at least 0.5m from any walls, corners, or vertical surfaces ICOP-IAQ. (2010).
2.3. Sampling Method
The
monitoring events in the dormitory and residential were conducted based on
three hours in a three-time period; 6 A.M. to 9 A.M., 11 A.M. to 2 P.M. and 5
P.M. to 8 P.M. for three days. In
comparison, monitoring for the prayer hall was conducted based on two slots: 11
A.M.-2 P.M. and 6 P.M.-10 P.M. Also, the
outdoor data collected provide some hints associated with the indoor
environmental parameters. This includes air temperature, relative humidity, and
air movement, measured simultaneously outdoors and indoors Wafi and Ismail (2010). The dormitory and prayer hall rely
on active ventilation such as fan and passive ventilation, windows, and
doors. For the site at Pusat Islam, both
windows and doors are kept open during the monitoring period, and fans only
switch on during prayers time, while for monitoring at the students’ dormitory,
only windows are kept open, and fans switch on during the monitoring. For Pusat Islam, all the windows are kept open
at 45°. The orientation of the window can influence the solar penetration
through the window and the indoor temperature Givoni (1981).
The T-Rh
Data Logger was mounted 1.2 m above the ground, and the output parameters were
downloaded via T-RH instrument Software. There were 30 minutes to one hour to
stabilise the instruments before reading for all parameters. The location is then set according to the
current time and date of monitoring. The
devices were placed at least 0.5 m from corners, windows, walls, partitions,
and other vertical surfaces. The
selected sampling location is also not directly in front of floor fans ICOP-IAQ.
(2010).
Figure 1

|
Figure
1 The location of students’ dormitory SH3 Lembaran |
Figure 2

|
Figure
2 The overview of student dormitory |
Figure 3

|
Figure
3 The overview of the bedroom where monitoring was done at
residential |
Figure 4

|
Figure
4 The overview of prayer hall of
Pusat Islam, USM Engineering Campus |
2.4. Analysis Method
For Predicted Mean Vote (PMV) and Predicted Percentage
Dissatisfied (PPD) calculation, a free online tool for thermal comfort calculations and visualisations; Center for the Built Environment (CBE) Thermal Comfort Tool
that follows the ASHRAE 55–2017, ISO 7730:2005, and EN 16798–1:2019 standards
were used. The CBE Thermal Comfort Tool for ASHRAE-55.
2.5. Thermal Comfort Analysis
The calculation of the PPD and PMV was carried out using the CBE Thermal Comfort Tool. For PMV and PPD method, five parameters were included as inputs in this tool: operative temperature, airspeed, relative humidity, metabolic rate, and clothing level. The average 5 minutes interval of physical parameters obtained at the site could significantly impact the estimation of PPD. There are seven thermal sensation scales of PMV ranging from -3 (cold) to +3 (hot). Table 1 shows the definition of the ASHRAE thermal sensation scale, which presents people's thermal perception of the building.
Table 1
|
Table 1 PMV and its relation to the thermal comfort scale |
|
|
Value |
Sensation |
|
+3 |
Hot |
|
+2 |
Warm |
|
+1 |
Slightly warm |
|
0 |
Neutral |
|
-1 |
Slightly cool |
|
-2 |
Cool |
|
-3 |
Cold |
The correlation
between PMV and PPD is shown in Figure 5. By
referring to the figure, PPD rises as PMV shifts away from zero, either in the
positive or negative direction. According to the ASHRAE standard, the
acceptable limit for PMV value ranges from -0.5 to +0.5 and PPD value less than
10%, as shown in Table 2.
Figure 5

|
Figure
5 PPD as a
function of PMV |
Table 2
|
Table 2 Acceptable Thermal Environment for General Comfort |
|
|
PPD |
PMV Range |
|
<10 |
-0.5<PMV<+0.5 |
2.6. Operative Temperature, Air Speed and Relative Humidity
The input for
operative temperature, airspeed and relative humidity is obtained from the data
collected during the monitoring. All the
data was recorded in minutes and then averaged to 5 minutes intervals. The
acceptable limits for air temperature, airspeed and relative humidity are
compared with the Industry Code of Practice on Indoor Air Quality ICOP-IAQ. (2010). The permissible limit of these three
parameters is shown in Table 3.
Table
3
|
Table 3 Acceptable range for specific physical parameters
based on ICOP 2010 |
|
|
Parameter |
Acceptable Range |
|
Air temperature |
23-26 °C |
|
Relative humidity |
40-70% |
|
Air movement |
/s |
2.7. Metabolica Rate and Clothing Insulation
According to ASHRAE (2004) the insulation levels of 0.5 clo and 1.0 clo are typical for
warm and cool outdoor clothing. Since
the weather in Malaysia is more likely to be warm, the clothing insulation used
in CBE Thermal Comfort Tool is 0.5 clo. Worshippers
practise worshipping in the mosque during prayer time, and the movements, such
as standing, bowing, prostrating, and sitting, are pretty
relaxed. The estimated value of metabolic rate and clothing insulation
in this study are shown in Table 4 based on ASHRAE (2004) and previous research.
Table 4
|
Table 4 Estimated value of metabolic rate and clothing
insulation |
|
|
Metabolic rate (met) |
Clothing insulation value (Clo) |
|
1.3 |
0.5 |
3. Results and
Discussions
3.1.
Results of Operative Temperature, Air
Speed and Relative Humidity
Table 5 depicts the minimum, maximum and average value of air temperature (T), relative humidity (RH) and air movement (AM) within the students’ dormitory in compliance with Malaysia ICOP’s acceptable limit. Based on the results, the average temperature is the lowest during 6 A.M. - 9 A.M. compared to other times (11 A.M. – 2 P.M. and 5 P.M. – 8 P.M.). Nevertheless, all-temperature from 6 A.M. - 9 A.M., 11 A.M. - 2 P.M. and 5 P.M. - 8 P.M. exceed the limit based on ICOP of 23-26 °C. The same goes for relative humidity, where none of the results complies with the ICOP limit (40-70 %). This condition happens as a result of the bad design of the dormitory. The cross ventilation could not occur as there was no opening on the opposite side of the window. The door, located on the opposite side of the window, must always be open to allow cross ventilation. Cross ventilation happens when there is a wind pressure difference. However, this situation is dangerous for the occupants’ safety. In addition, the outdoor temperature also affects the higher indoor temperature as the outdoor temperature increase.
Table 5
|
Table 5 Results
of monitoring at the dormitory from 6 A.M. - 9 A.M., 11 A.M. - 2 P.M. and 5
P.M. - 8 P.M. on Day 1, Day 2, and Day 3 based on ICOP limit |
|||||||||
|
Parameter |
T |
RH |
AM |
||||||
|
ICOP limit |
23-26 °C |
40-70% |
0.15-0.50 m/s |
||||||
|
Time |
6 A.M. - 9 A.M. |
||||||||
|
|
Min. |
Max. |
Avg. |
Min. |
Max. |
Avg. |
Min. |
Max. |
Avg. |
|
Day 1 |
27.4 |
28.6 |
27.72 |
73.1 |
79.5 |
77.48 |
0.02 |
0.15 |
0.08 |
|
Day 2 |
26.2 |
30.1 |
27.98 |
74.1 |
79.9 |
76.94 |
0.03 |
0.32 |
0.13 |
|
Day 3 |
28.8 |
30 |
29.25 |
73.3 |
78.5 |
77.07 |
0.02 |
0.49 |
0.17 |
|
Time |
11 A.M. – 2 P.M. |
||||||||
|
|
Min. |
Max. |
Avg. |
Min. |
Max. |
Avg. |
Min. |
Max. |
Avg. |
|
Day 1 |
29.8 |
30.9 |
30.39 |
70.0 |
75.4 |
73.10 |
0.15 |
0.54 |
0.26 |
|
Day 2 |
30.1 |
31.7 |
31.06 |
70.1 |
75.9 |
72.41 |
0.06 |
0.31 |
0.17 |
|
Day 3 |
30.1 |
31.7 |
31.03 |
69.4 |
76.8 |
72.83 |
0.07 |
0.51 |
0.22 |
|
Time |
5 P.M. - 8 P.M. |
||||||||
|
|
Min. |
Max. |
Avg. |
Min. |
Max. |
Avg. |
Min. |
Max. |
Avg. |
|
Day 1 |
29.9 |
30.5 |
30.21 |
74.0 |
78.4 |
75.43 |
0.05 |
0.28 |
0.38 |
|
Day 2 |
30.6 |
31.3 |
31.12 |
70.9 |
73.7 |
72.70 |
0.08 |
1.02 |
0.58 |
|
Day 3 |
29.1 |
30.3 |
29.43 |
76.4 |
78.3 |
77.13 |
0.07 |
0.54 |
0.22 |
For monitoring at residential, the minimum, maximum and average values of T,
RH and AM are tabulated in Table 6. Based on the results, the average
temperature is the lowest during 6 A.M. - 9 A.M. compared to other times (11
A.M. – 2 P.M. and 5 P.M. – 8 P.M.). However, all-temperature for all
monitoring sessions exceeded the limit based on ICOP of 23-26 °C. Monitoring during 5 P.M. - 8 P.M. shows that
RH complies with the ICOP limit where the value is 40%-70%.
Table 6
|
Table 6 Results
of monitoring at residential for 6 A.M. - 9 A.M., 11 A.M. - 2 P.M. and 5 P.M.
- 8 P.M. on Day 1, Day 2, and Day 3 based on ICOP limit |
|||||||||
|
Parameter |
T |
RH |
AM |
||||||
|
ICOP limit |
23-26 °C |
40-70% |
0.15-0.50 m/s |
||||||
|
Time |
6 A.M. - 9 A.M. |
||||||||
|
|
Min. |
Max. |
Avg. |
Min. |
Max. |
Avg. |
Min. |
Max. |
Avg. |
|
Day 1 |
27.4 |
28.8 |
28.45 |
52.6 |
76 |
74.21 |
0.40 |
3.77 |
1.32 |
|
Day 2 |
27.4 |
29.2 |
28.02 |
44.6 |
79.4 |
74.93 |
0.87 |
3.29 |
2.73 |
|
Day 3 |
28.1 |
28.7 |
28.28 |
56.7 |
79.4 |
76.36 |
0.27 |
1.22 |
0.85 |
|
Time |
11 A.M. – 2 P.M. |
||||||||
|
|
Min. |
Max. |
Avg. |
Min. |
Max. |
Avg. |
Min. |
Max. |
Avg. |
|
Day 1 |
30.3 |
31.9 |
30.83 |
66.1 |
72.1 |
69.64 |
0.71 |
3.11 |
2.17 |
|
Day 2 |
30 |
32 |
30.86 |
67.5 |
73.8 |
70.85 |
0.18 |
1.12 |
0.73 |
|
Day 3 |
29.9 |
31.6 |
30.53 |
67.7 |
75 |
71.55 |
0.23 |
1.15 |
0.61 |
|
Time |
5 P.M. - 8 P.M. |
||||||||
|
|
Min. |
Max. |
Avg. |
Min. |
Max. |
Avg. |
Min. |
Max. |
Avg. |
|
Day 1 |
31.6 |
32.8 |
32.35 |
60.5 |
70.5 |
66.92 |
1.87 |
3.26 |
2.52 |
|
Day 2 |
32.1 |
34.3 |
32.92 |
59.4 |
68.9 |
64.14 |
0.28 |
1.54 |
0.79 |
|
Day 3 |
31.7 |
33.1 |
32.24 |
62.4 |
68.5 |
65.53 |
0.28 |
1.54 |
0.79 |
The
physical parameters of thermal comfort for the prayer hall are illustrated in Table 7.
Based on Table 7, Day 1 recorded the lowest
temperature compared to Day 2 and Day 3. Besides, after the Zohor
prayer (between 11. A.M. – 2 P.M.), all occupants left the prayer hall since no
activity was conducted after the Zohor prayer. Even though it recorded the lowest
temperature (30.98 °C), the T still exceeded the ICOP
limit of 23-26 °C. The T and RH on Day 3 were highest because,
during the Zohor prayer, there were 77 occupants, and
there was Tazkirah right after the congregational of Zohor prayers. The
increased metabolic rate of many occupants during that time could also contribute
to high indoor T.
Besides,
the highest RH and AM were recorded on Day 3 from 6 P.M. - 10 P.M in the prayer hall due to heavy
rain. The relative humidity will
increase when it rains due to evaporation.
|
Table 7 Results
of monitoring at prayer hall for 11 A.M. - 2 P.M. and 6 P.M. - 10 P.M. on Day
1, Day 2, and Day 3 based on ICOP limit |
|||||||||
|
Parameter |
T |
RH |
AM |
||||||
|
ICOP limit |
23-26 °C |
40-70% |
0.15-0.50 m/s |
||||||
|
|
11 A.M. - 2 P.M. |
||||||||
|
|
Min. |
Max. |
Avg. |
Min. |
Max. |
Avg. |
Min. |
Max. |
Avg. |
|
Day 1 |
29.2 |
32.2 |
30.98 |
58 |
67.1 |
61.76 |
0.01 |
1.12 |
0.21 |
|
Day 2 |
29.7 |
32 |
31.15 |
58.5 |
71 |
63.79 |
0.01 |
0.99 |
0.28 |
|
Day 3 |
30.2 |
32.1 |
31.39 |
60.1 |
70.6 |
65.85 |
0.01 |
3.10 |
0.89 |
|
|
6 P.M. - 10 P.M |
||||||||
|
|
Min. |
Max. |
Avg. |
Min. |
Max. |
Avg. |
Min. |
Max. |
Avg. |
|
Day 1 |
29.2 |
31.7 |
30.38 |
63.3 |
79.5 |
79.5 |
0.01 |
2.37 |
1.19 |
|
Day 2 |
28.5 |
29.6 |
29.02 |
70.9 |
82.4 |
78.51 |
0.01 |
3.38 |
1.31 |
|
Day 3 |
26.7 |
28 |
27.13 |
75.7 |
85.1 |
82.94 |
0.02 |
0.42 |
1.47 |
Table 7
3.2.
PMV and PPD
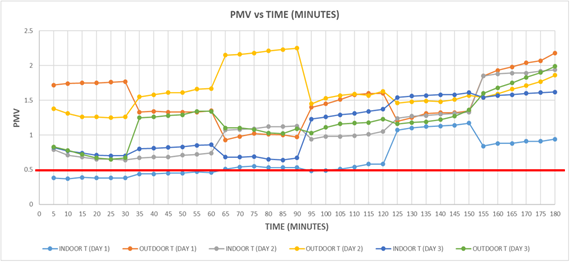
Table 8 depicts the PMV
plotted against time and PPD vs time during 6 A.M. - 9 A.M., 11 A.M - 2 P.M.
and 5 P.M. - 8 P.M. at one of the students’ dormitories, respectively. Based on the ASHRAE seven-point scale, it can be seen that none of the conditions was within the
acceptable limit of PMV value ranging from -0.5 to +0.5. Most of the time, the ASHRAE seven-point
scale ranges from ‘slightly warm’ to ‘hot’.
Meanwhile, the
percentage of occupant’s satisfaction (PPD) with their indoor environment's
thermal comfort correlates with PMV values.
Based on the results, none of the results is within the acceptable
limit, and even worse, most PPD values are more than 20%. This shows the dissatisfaction of the
occupant with the environment in the dormitory.
This is due to the high outdoor temperature that affects the indoor temperature. Besides, the occupants occupied the room throughout the monitoring, contributing to higher indoor temperature.
Table 8
|
Table 8 PMV is
plotted against time and PPD vs time during 6 A.M. - 9 A.M., 11 A.M - 2 P.M.
and 5 P.M. - 8 P.M. at one of the students’ dormitories |
|
|
Time |
Graph |
|
6 - 9 A.M. |
|
|
|
|
|
11 - 2 P.M. |
|
|
|
|
|
5 - 8 P.M. |
|
|
|
|


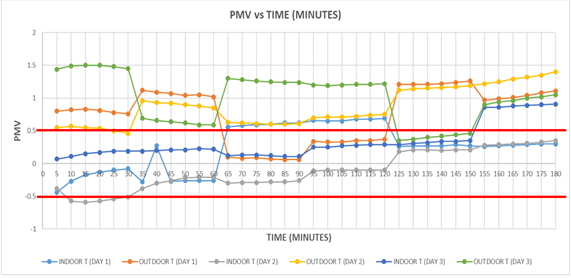
For domestic monitoring. The monitoring is done in one of the
house's bedrooms, where sunlight penetrates the room. There was active and
passive ventilation during the monitoring, where the ceiling fan was switched
on, and all the windows were kept open throughout the monitoring session.
Occupants did not occupy the bedroom during the monitoring and only got into
the room for prayer. By means, they do
not stay too long in the room. Table 9 depicts the PMV plotted against
time during 6 A.M. – 9 A.M., 11 A.M.- 2 P.M. and 5 P.M. – 8 P.M. at
residential. Based on Table 9, the indoor T for Day 1 and Day 2
is within the ASHRAE limit value. This
is due to the surrounding condition where it was raining and windy on both
days. Residential building thermal
comfort highly depends on the weather, particularly the outdoor temperatures Peeters et al.
(2009).
None of the results is within the limit during evening monitoring.
The
results also showed that the PPD values correlate with the PMV values. The value of PPD in residential is below the
limit, which is less than 10% on Day 1 and Day 2 during 6 A.M. - 9 A.M.
monitoring. This means the occupant is satisfied with the indoor environment
within that time as it is within the allowable limit. Compared to results
during 11 A.M. - 2 P.M. and 5 P.M. - 8 P.M., the PPD value exceeded the limit.
This indicates that there is discomfort towards the occupants.
Table 9
|
Table 9 PMV is plotted against time and PPD vs time during
6 A.M. - 9 A.M., 11 A.M - 2 P.M. and 5 P.M. - 8 P.M. at residential |
|
|
Time |
Graph |
|
6 – 9 A.M. |
|
|
|
|
|
11- 2 P.M. |
|
|
|
|
|
5 – 8 P.M. |
|
|
|
|

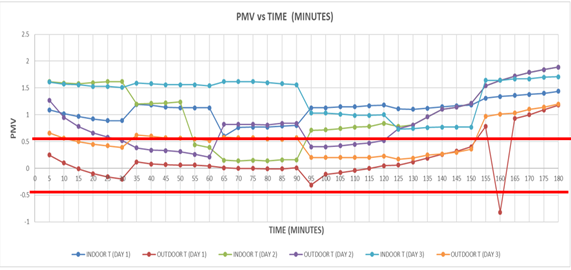
Besides,
monitoring for Pusat Islam is conducted for two slots: 11 A.M. - 2 P.M. and 6
P.M. - 10 P.M. The monitoring for 11 A.M. - 2 P.M. was conducted for 3 hours,
and the monitoring period from 6 P.M. - 10 P.M 4 hours according to the prayer
period. The results for 11 A.M. – 2 P.M. monitoring of the current study is
compared with the existing data to determine whether the physical parameters of
indoor thermal comfort at the prayer hall of Pusat Islam comply with the ICOP
limit. The results for PMV against time
and PPD vs time for this study are presented in Table 10.
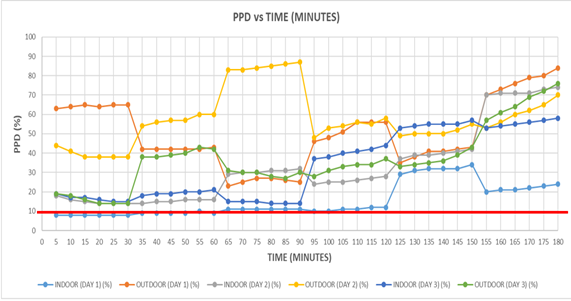
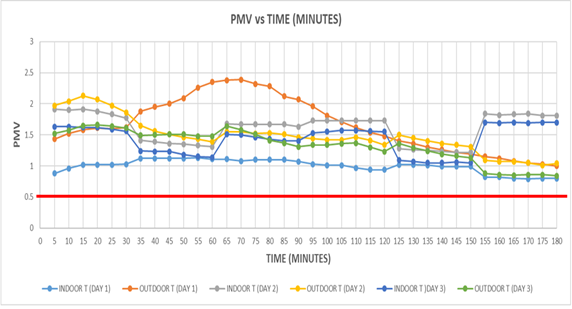
Table 10 shows that the PMV value exceeds
the limit most of the time. This happens due to no active ventilation used
during that time. Only a few fans are switched on during Zohor
prayer, which does not significantly differ in the PMV value during prayer and
non-prayer times. The PMV values on Day 2 and Day 3 are near the acceptable
limit, which is the thermal comfort scale sensation, ranging from ‘neutral’ to
‘slightly warm’, while the PMV value for Day 1 recorded the highest. This can relate to the outdoor PMV, where Day
1 recorded the highest PMV value compared to other days.
During
prayer time at night (6. P.M. – 10 P.M.), the PMV value drops within the
acceptable limit, ranging from -0.5 to +0.5. This is due to active ventilation
in operation, and natural ventilation such as doors and windows are always kept
open. During Maghrib prayer on Day 2, the PMV value is higher than on other
days and is not within the limit. This happens as there were many occupants
during Maghrib prayer on Day 2, around 122 occupants. Meanwhile, the number of occupants during Magrib prayer on other days is much lesser.
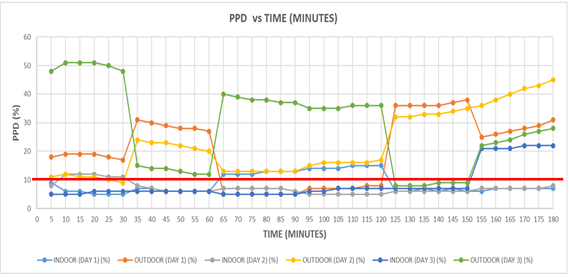
Meanwhile, PPD
values representing the percentage satisfaction of occupants with their indoor
thermal comfort in the prayer hall also correspond to the PMV value. Based on the results of this study, the PPD
values are still above the ASHRAE limit. Table 10 shows that occupants are discomfort
as the PPD value is more than 10%. This
is because, during Zohor prayer, only a few fans were
switched on. On top of that, during the non-prayer time, all fans are switched
off, and only natural ventilation such as windows and doors are kept open. However, during prayer times, Maghrib, Isya’ and Teraweh prayer, the PPD
values drop below the acceptable limit. All fans are switched on during the
prayers, resulting in the occupants' comfort.
The PPD value on Day 2 during Maghrib prayer does not fall within the
acceptable limit even though all fans are switched on as there is a higher
number of occupants on that day compared to other days. This shows the
occupants’ discomfort as the number of people occupying the space increases.
Table 10
|
Table 10 PMV is plotted against
time and PPD vs time during 11 A.M - 2 P.M. and 6 P.M. - 10 P.M. at the
prayer hall |
|
|
Time |
Graph |
|
11 - 2 P.M. |
|
|
|
|
|
6 - 10 P.M |
|
|
|
|


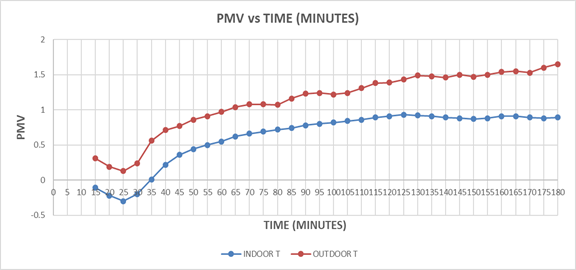
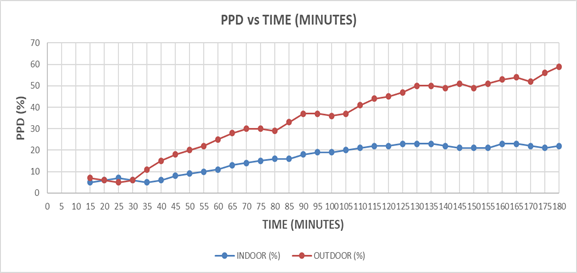
Table 11 shows the results of the existing
data. It indicates that the PMV value
most often exceeds the ASHRAE limit, even during Zohor
prayer. This can be correlated with the increase in outdoor temperature towards
the end of the monitoring session. According to the current study results, the
PMV value is still not within the acceptable limit based on ASHRAE
Standard. This condition is mainly
because the active ventilation, such as fans, only operated during prayer
time. During non-prayer time, all fans
are switched off and only depend on natural ventilation.
Meanwhile,
the PPD value exceeds the limit of 10% starting from minutes 60. This indicates occupants’ discomfort as all
fans are switched off, and only natural ventilation such as windows and doors
are kept open during the non-prayer time. Only a few of the fans were switched
on during the Zohor prayer. The same reason applies to the current study.
Therefore, the PPD value is still above the limit.
Table 11
|
Table 11 PMV is plotted against time and PPD vs time during
11 A.M - 2 P.M. monitoring at the prayer hall for the existing data |
|
|
Time |
Graph |
|
11 - 2 P.M. |
|
|
|
|
4. Conclusions
This
study was conducted to determine the compliance of thermal comfort in the
dormitory, residential and prayer halls based on ICOP 2010. The physical parameters: T, RH, and AM are compared with the ICOP limit,
while the PMV and PPD were calculated using CBE Thermal Comfort Tools for
ASHRAE-55.
The
experimental results show that most of the time, the thermal comfort parameters
are not within limits for students’ dormitory, residential and prayer
halls. The poor design of the students’
dormitory does not support cross ventilation, and there are no openings on the
opposite side of the window. Hence,
cross ventilation cannot occur effectively unless the door is open, as the door
is on the opposite side of the window.
Meanwhile,
for monitoring at residential, PMV and PPD are within the acceptable limit
ranging from -0.5 to +0.5 and 10%, respectively, during 6 A.M.-9 A.M.
monitoring. This is due to the surrounding condition where it was raining and
windy on both days. Thus, resulting in
comfort for the occupants at that time.
However, the PMV and PPD values still exceed the limit during other
monitoring times.
The
results from 11 A.M.-2 P.M. monitoring at the prayer hall of Pusat Islam shows
that none of the products is within the acceptable limit. This is because no
active ventilation operates during the non-prayer time and only depends on
natural ventilation such as doors and windows.
Only a few fans are switched on during Zohor
prayer, which does not significantly differ between PMV value during prayer and
non-prayer times. Thus, resulting in
discomfort for the occupants. During the
monitoring 6 P.M. - 10 P.M, the results illustrate that during prayer time, the
PMV value drops within the acceptable limit, which ranges from -0.5 to
+0.5. This happens due to low outdoor T
besides the active ventilation and natural ventilation such as doors and
windows being kept open at all times. However, a higher number of occupants during
Maghrib prayer also causes discomfort for the occupants.
This study indicates that better thermal comfort happens when both active and cross ventilation is incorporated; despite the physical, thermal comfort parameters are not within the limit.
CONFLICT OF INTERESTS
None.
ACKNOWLEDGMENTS
None.
REFERENCES
ASHRAE Standard. (2004). Thermal Environmental Conditions for Human Occupancy 55-2004. American Society of Heating, Refrigerating and Air-Conditioning Engineers, Inc., 2004(ANSI/ASHRAE Standard 55-2004), 1–34.
Givoni, B. (1981). Conservation and the use of Integrated-Passive Energy Systems in Architecture. Energy and Buildings, 3(3), 213–227. https://doi.org/10.1016/0378-7788(81)90007-4.
ICOP-IAQ. (2010). Industry Code of Practice on Indoor Air Quality. Ministry of Human Resources Department of Occupational Safety and Health.
Lee, S. C. and Chang, M. (2000). Indoor and Outdoor Air Quality Investigation at Schools in Hong Kong. Chemosphere, 41(1–2), 109–113. https://doi.org/10.1016/S0045-6535(99)00396-3.
Olesen, B. W. and Brager, G. S. (2004). Predict Comfort. August.
Peeters, L., Dear, R. de, Hensen, J. and D’haeseleer, W. (2009). Thermal Comfort in Residential Buildings : Comfort Values and Scales for Building Energy Simulation. Applied Energy, 86(5), 772–780. https://doi.org/10.1016/j.apenergy.2008.07.011.
Wafi, S. R. S. and Ismail, M. R. (2010). Occupant’s Thermal Satisfaction a Case Study in Universiti Sains Malaysia (USM) Hostels Penang, Malaysia. European Journal of Scientific Research, 46(3), 309–319.
|
|
 This work is licensed under a: Creative Commons Attribution 4.0 International License
© IJETMR 2014-2022. All Rights Reserved.