
|
|
|
|
DESIGN IMPLEMENTATION ANDON FOR PRODUCTION MONITORING SYSTEM BASED ON INTERNET OF THINGSGun Gun Maulana 1 1, 2, 3 Department of Automation and Mechatron Engineering, Pollitechnic of Manufactur Bandung, Bandung, Indonesia. |
|
||
|
|
|||
|
Received 01 November 2021 Accepted 15 November 2021 Published 31 December 2021 Corresponding Author Gun
Gun Maulana, gungun@polman-bandung.ac.id DOI 10.29121/ijetmr.v8.i12.2021.1083 Funding:
This
research received no specific grant from any funding agency in the public,
commercial, or not-for-profit sectors. Copyright:
© 2021
The Author(s). This is an open access article distributed under the terms of
the Creative Commons Attribution License, which permits unrestricted use, distribution,
and reproduction in any medium, provided the original author and source are
credited.
|
ABSTRACT |
|
|
|
Each
production requires a system monitoring, so efficiency that the desired and
productivity can be achieved and monitored in real time. This system is
needed in the type of press machine production which is mainly influenced by
based production lead time. The monitoring process is one of the factors that
influences the time of production and manufacturing. Conventionally, the
system is monitoring carried out manually by the operator on a piece of
paper. This method tends to create errors and quite a long time. This paper
aims to overcome the problems that occur by creating a system that is able to
record and monitor the machine automatically. The solution is made by
utilizing a sensor limit switch, infrared, pressure transmitter and Wi-Fi
network based on Web Interface that is connected to the Firebase real time
database. Equipped with PID control using the Ziegler Nichols 1 method to
stabilize wind pressure on the system. Monitoring devices can be accessed on
PCs, laptops, smartphones, connected to the internet, equipped with
user-level operators, management, or engineers so that they can be used
easily. All production data for each press is collected in a database. The
data will be processed by the system to produce a value OEE machine. All data
will be displayed on the Web Interface in real-time. The system output is the
actual production, value OEE and wind pressure control. The test results show
the system is running well, with 2s delay time and data accuracy of ± 0.2%. |
|
||
|
Keywords: Production Monitoring System, Web Interface, OEE, Database, Real Time
Database Firebase 1. INTRODUCTION In the modern era like
today, competition in the business world almost occurs in all fields, not
least in the manufacturing sector where they have to adapt to technology so
that production can survive, one of which is technology in press machines. A
press machine is a pneumatic, hydraulic or mechanical powered machine that is
used to press an object and produce a new object with a denser volume Golechha and Kulkarni.
(2017) . In the industrial world
a company needs a reliable production monitoring system. Currently, the
average process industrial monitoring in Indonesia is still done manually
where information is obtained from operators who check and update the latest
conditions on the machine Wang et al. (2005). |
|
||


Information obtained manually is certainly not reliable because errors often occur to the operator, which certainly can have an impact on the production system and can harm the company, other than that the manual monitoring system is ineffective and inefficient because it requires a long time to update the information Wang et al. (2005) Production data collected at this time is still a lot of errors due to human intervention or improper production monitoring systems. Human factors are more common in this case. As when un-scheduling blackouts occur, time is spent to solve these problems, so this can disrupt the production process in the company Tang et al. (2004). This makes the production monitoring system very important function to realize industrial automation with a level of high efficiency Cowling and Johansson (2002) so that maintenance and monitoring activities do not require expensive and complicated costs to obtain reliable data every time Saenz et al. (2009). Generally, the information that needs to be monitored in the industry is the type of part that is made, the number of parts that have been produced, and machine life time Snatkin et al. (2012) from the information obtained can be calculated to determine Availability, Performance, Quality, and Overall Equipment Effectiveness Subramaniam et al. (2014) . At present the existing production monitoring system Subramaniam et al. (2014) has succeeded in creating a system monitoring with the use of raspberry pi and web interfaces as automatic inputs on the actual calculation of production on a lathe in Estonia. In addition to the PMS system that has been made in Indonesia Meyer et al. (2009) is a PMS system that is installed on a lathe using a Raspberry Pi and HMI engine as an interface for the PMS system, this system functions only to calculate the production time of the machine. In the production monitoring system this can control the use of motors on a lathe by using the hall effect sensor.
Both systems still have weaknesses in user friendly, database usage, unreliable / mobile systems and optimizing PMS system interfaces. In addition, in both systems there is no automatic OEE value calculation process consisting of machine availability, performance, quality and OEE.An Internet-based Production Monitoring System designed for press machines enables the acquisition of data from pneumatic power press machines. This system is related to the number and type of parts made, air pressure control, lifetime parts, cycle time, and the number of actual production machines connected to the internet Hoedi et al. (2018) using cloud real time databases on firebase as data storage Sukaridhoto (2016) and processed to generate machine OEE values automatically and periodic reports Mattern and Floerkemerier (2010) on the web as a user interface Meyer et al. (2009) from data received so that it can be accessed on LED TVs, smartphones, personal computers, laptops connected to the internet. Make the user can access anywhere and anytime so that the machine's problems and conditions can be monitored in real time and the data received will be stored on the web as a result of press machine production Kumar et al. (2007). With this system an error can, be detected as early as possible so that it will reduce wasted time and improve performance overall engine and reduce the risk critical of the engine Nicolas and Lucie. (2017-2018). So, with the Production Monitoring System based Internet- on this pneumatic press machine, it is expected that the production system and engine wind pressure control will be more effective, efficient, and mobile
2. MATERIALS AND METHODS
Stages used in this study follows VDI 2206 which has been described in general terms. The details of the flow of the research stages are explained in Figure 1.
|
|
|
Figure 1 Stages of Research |
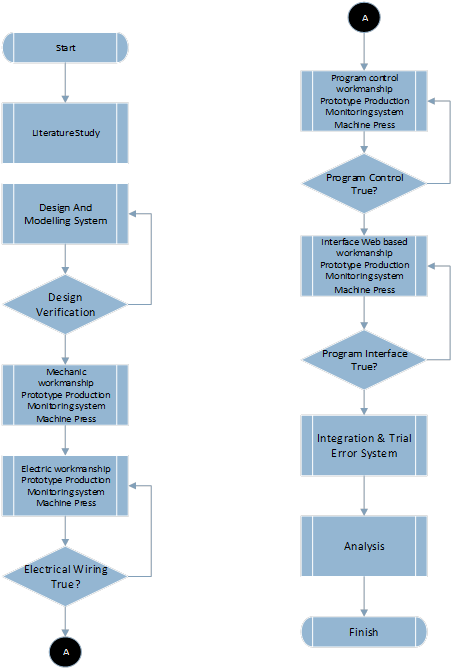
2.1. Literature Study
At this stage the material is collected from various sources related to the system to be made. These materials are studied and used as a basis for making a system.
2.2. Design and Modeling System
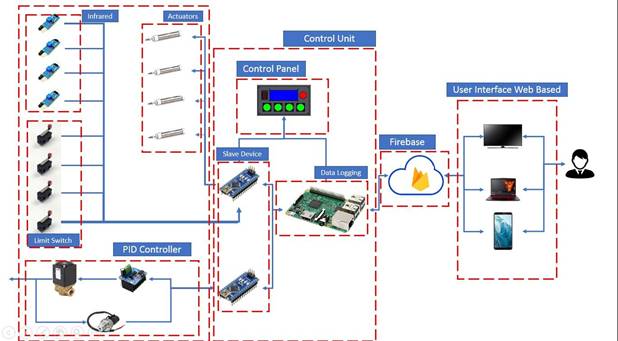
Design includes several important aspects including the informatics / control domain, the electric domain and the mechanical domain are part of the system that is made. Broadly speaking, the application steps are in accordance with VDI 2206 design standards Magdy (2014). The design of a prototype production monitoring system based on the press machine IoT includes mechanical design, electrical design, as well as computer design and programming algorithm modeling. This stage is intended to facilitate the implementation of research, and also reduce the error rate when carrying out research. Figure 2 shows an overview of the production monitoring system that will be made including control, mechanical and informatics systems.
|
|
|
Figure 2 General description of the system |
2.3. Mechanic Processing
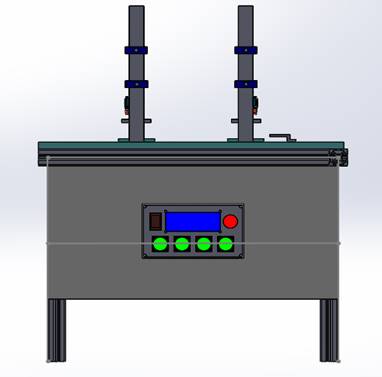
After the design is complete then the manufacture of mechanics for the prototype press machine. This stage includes the supply of materials and components that will be used in research. Then, the materials and components are built into a mechanical prototype production monitoring system press machine. After completing mechanical work for the prototype of the machine. Figure 3 shows the mechanical design of a front view prototype press machine. Consists of 3 main parts namely control panel, prototype press machine, and electric circuit table at the bottom side.
|
|
|
Figure 3 Front view mechanical design |
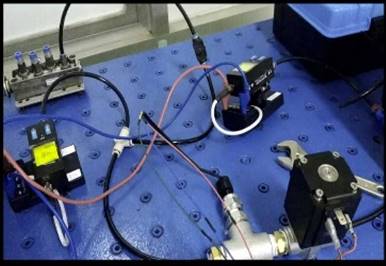
2.4. Making PMS Electric Circuit
After making a mechanical system production monitoring system, then the electrical circuit from the system in accordance with the electrical circuit drawings that have been made at the system design stage in the general picture of the system shown in Figure 2. The electric circuit itself will be installed under the prototype press machine, shown by Figure 4 the yellow table is an electric circuit table in the PMS system. The electrical circuit consists of a limit switch sensor, an IR infrared sensor, pressure transmitter sensor, while the output consists of 8 relays, 5 push button controls, proportional valves, and 4 double acting 5/2 solenoid valves used to control cylinders. Each input and output on the system is controlled by 2 Arduino nano that function as slave devices and 1 Raspberry Pi 3 which is used as a master device for data logging on the IoT process on the system that will be connected in real time to the firebase database.
2.5. Making PMS Control Program
At this stage PMS prototype controller programming is performed. Programming is carried out in accordance with the algorithm that was designed at the design stage of the PMS prototype system. After the program is finished, a trial program is carried out while analyzing it. The Program control created in this system includes control units PID, cylinder and pneumatic channel controls, and data logging for limit switch sensors for actual production and infrared as workpiece sensors.
PID is used to stabilize the incoming wind pressure in the PMS system shows the control PID on the production monitoring system. If successful then proceed to the stage of making the interface program for monitoring the weir prototype system, if not then return to the control program creation stage.
3. RESULTS AND DISCUSSIONS
The design of the drip irrigation control system in Figure 3 has been implemented by making a prototype of the system as shown in Figure 4.
|
|
|
Figure 4 Prototype of Andon System |
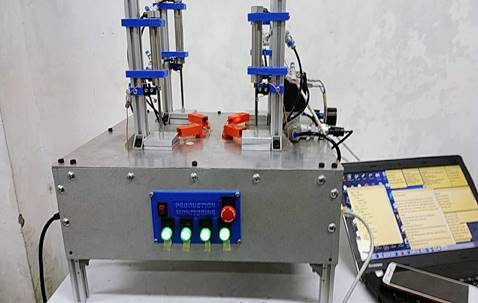
Implementation consists of three parts, namely the plant system accompanied by a processing unit that gets internet sources from wireless router, Realtime database using firebase, and firebase hosting on the Web interface. The processing unit is divided into 2 namely a table-shaped control unit consisting of 4 cylinders which are prototypes of 4 press machines. Installed using a profile aluminum and 3D printer filament as a joint, connected to the limit switch sensor, pressure transmitter, infrared proportional valve and solenoid valve. And an electrical unit consisting of a control panel and an electrical circuit system. To connect the system to the internet a wireless router is used. The second part is the Realtime database using firebase to store sensor reading data. This database can be accessed using WEB interface that has been created. WEB interface itself can be accessed via a smartphone, laptop or computer connected to the internet. System through the internet network so that users can access data acquisition from anywhere as long as the WEB application and internet connected processing unit.
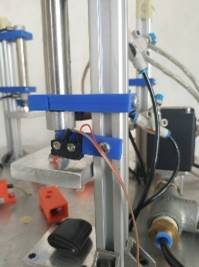
After the system has been successfully implemented, it is then tested the sensor pressure transmitter and the limit switch. The test aims to determine the sensor characteristics and parameters measured. Sensor testing is Pressure transmitter done by comparing the results of system measurements and readings on pressure digital while the sensor limit switch is tested on the response time sensor until the data is received by the WEB interface. Figure 5 shows how to test sensors pressure transmitter and limit switches.
|
|
|
Figure 5 (a) Testing the pressure
transmitter sensor, (b) testing the limit switch |
The pressure transmitter sensor testing the sensor readings of the incoming wind pressure and read by the sensor. This test is at the same time calibrating the accuracy of the sensor pressure transmitter to the incoming wind pressure by comparing the incoming wind pressure read by pressure a digital bar and the wind pressure read by the sensor. The given wind pressure is limited to 5 bars. As shown in Table 1, the comparison between the accuracy of the sensor pressure transmitter and the digital pressure mounted in parallel with the sensor.
|
Table 1 . Readings of pressure transmitters |
|||
|
No |
Pressure
Transmitter |
Pressure
Digital |
Error (%) |
|
1 |
4.99 |
5 |
0.2 |
|
2 |
4.99 |
5 |
0.2 |
|
3 |
5.01 |
5 |
0.199 |
|
4 |
5 |
5 |
0 |
|
5 |
5.01 |
5 |
0.199 |
|
6 |
5.01 |
5 |
0.199 |
|
7 |
5 |
5 |
0 |
|
8 |
5 |
5 |
0 |
|
9 |
5 |
5 |
0 |
|
10 |
4.99 |
5 |
0.2 |
|
11 |
4.99 |
5 |
0.2 |
|
12 |
5 |
5 |
0 |
|
13 |
5 |
5 |
0 |
|
14 |
5.01 |
5 |
0.9 |
|
15 |
5 |
5 |
0 |
In Table 1 values between the measurement and the reading of the pressure transmitter sensor. With the initial value of the pressure entering 5 bar, the sensor reads the pressure at 4.99 bar, 5 bar or 5.01 bar. Pressure transmitter shows the value of the reading of the wind pressure sensor. While digital pressure shows the value of the measurement of wind pressure. As in Table 1, which explains the sensor reading value. In Figure 10 we can see the accuracy of the sensor value ± 0.2% in 15 trials.
Tests conducted on this sensor include the speed of the sensor response, because it relates to the use of this sensor as a counter the amount of real time production on a press machine. The sensor works when the press machine completed the process of press and dice back to position 0, then the limit switch will be depressed and provide input on the slave device transmitted master device data logging which will be sent directly to the database firebase. The test carried out relates to the process of reading the limit switch to the response time of the delivery as in Table 2 which explains the speed of the delivery time in accordance with the limit switch that was pressed first.
|
Table 2 Response time Limit
Switch |
|||||
|
No |
i Limit Switch |
Respon tIME (s) Limit Switch 1 |
Limit Switch 2 |
Limit Switch 3 |
Limit Switch 4 |
|
1 |
1 |
0.89 |
0.88 |
0.88 |
0.89 |
|
2 |
1 |
0.88 |
0.86 |
0.86 |
0.88 |
|
3 |
1 |
0.88 |
0.88 |
0.88 |
0.88 |
|
4 |
1 |
0.87 |
0.89 |
0.89 |
0.87 |
|
5 |
1 |
0.88 |
0.87 |
0.87 |
0.88 |
|
6 |
1 |
0.88 |
0.86 |
0.86 |
0.88 |
|
7 |
1 |
0.89 |
0.86 |
0.86 |
0.89 |
|
8 |
1 |
0.89 |
0.86 |
0.86 |
0.89 |
|
9 |
1 |
0.89 |
0.86 |
0.86 |
0.89 |
|
10 |
1 |
0.88 |
0.87 |
0.87 |
0.88 |
|
Rata-Rata |
0.88 |
0.87 |
0.87 |
0.87 |
|
|
|
|
Figure 6 Response Time Limit Switch |
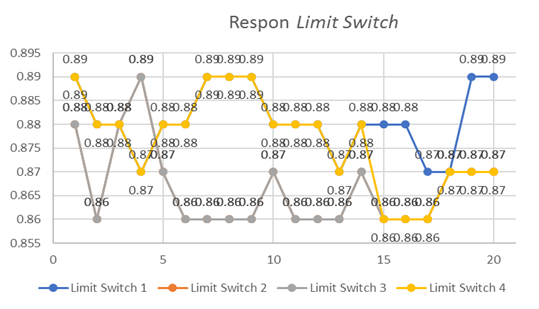
In Figure 6 shows the response time obtained from the sensor limit switch reading in seconds. This time is obtained by calculating the response of the off-limit switch to be on the WEB interface that has been made. From the test above, it is obtained that the response time limit switch is on average 0.87s. The PID system that is carried out in the production monitoring system is related to maintaining a stable wind pressure at the pressure in accordance with a predetermined setpoint on the web interface. So, the user can change the value set point according to the machine's needs. In accordance with the design of the PID that has been done on this PID system using the Ziegler Nichols tuning method with an overview of the system closed loop using proportional valve as a valve tool that controls the pressure of wind in and out of the system.
Testing the speed of sending data is done by comparing the use of LTE networks. The and HSDPA following results compare the speed of sending data using the internet with a High-Speed Downlink Packet Access (HSDPA) connection and by using a connection Long Term Evolution. these results may vary due to the signal reception strength of the modem being used. Testing the machine production monitoring system aims to test the accuracy of the data received by the system against the calculation of production values automatically. This test compares the value of manual with calculations automatic system. Conducted as many as 5 times with a quantity of testing above 50 times.
|
Table 3 compares the value of manual with
calculations automatic system |
||||
|
No. |
Time |
Manual
calculation |
Sistem
calculation |
Error |
|
1 |
17.00-18.00 |
20 |
20 |
0% |
|
2 |
18.00-19.00 |
120 |
120 |
0% |
|
3 |
19.00-20.00 |
310 |
320 |
3.12% |
|
4 |
20.00-21.00 |
120 |
122 |
1.64% |
|
Total |
|
570 |
582 |
2.06% |
Testing process on machine A done by comparing the
calculation of production manually and calculation of production automatically
by the system based on the reading of the limit
switch. Tests on machine A were carried out 4 times with different amounts
of production per hour. The Terror biggest produced by the system in the
reading process of machine A production occurred in the trial at 19.00-20.00
around 3.12% with a total production at that time around 310 products were
read. For the total amount produced by machine A for 4 hours, totaling 570
units, there was a reading error of around 2.06%. Testing the efficiency
engine. In this test, testing is done by comparing the results of manually
calculating the engine OEE values including Availability, Performance, Quality, and OEE with the results of
calculations on the IoT-based PMS system that has been made. Testing is carried
out on August 19, 2019 in Figure 4.18 shows the engine OEE value generated from
calculations on the system automatically. Testing is performed
on each machine, namely machine A, machine B, machine C, machine D with
constant machine movement based on cycle time. In testing the value of
efficiency engine, machine D that only produces is seen from the results of the
production graph which is successfully calculated by the system and processed
in the web interface.
The values efficiency machine in Table 3 are obtained from calculating the formula efficiency manually engine in accordance with the following formula:
![]() (1)
(1)
![]() (2)
(2)
![]()
![]() (3)
(3)
![]()
![]() = 0.48 (4)
= 0.48 (4)
Calculation of Performance Machine D is the calculation of the cycle time engine multiplied by the actual production divided by the length of production planned for all parameters obtained from Figure 4.18 for the time production planning and parameters actual production obtained in the image corresponds to the graph engine 4:19 D.Calculation of Quality of products on each machine A, machine B, C engine is the quality of production prior to reject or NG Product. In the machine rated Quality is reduced to 92% because there are 8 pieces of NG products as shown in figure 15 machine status D. For the calculation of the OEE value is a multiplication of Availability x Performance x Quality obtained by the machine. In the tests performed on the D engine, the OEE value was 0.48%.
4. CONCLUSION
Based on tests that have been carried out on the robot control system, several conclusions can be drawn as follows:
1) The process of monitoring the production of the system works accurately on the actual calculation of machine production with ± 2s data response with an accuracy of 0.2%.
2) The calculated values of efficiency engine including Availability, Performance, Quality, and OEE works accurately and reliably with an accuracy of 0.2% in an error precision of 1%.
3) The wind pressure control system with the PID constant respectively at Kp = 5.11, Ki = 6.14, Kd = 1.07 and given value of setpoint 3 bar is able to reach it for 0.2s with an error of ± 0.2%.
4) The PMS system is able to work reliably and is user friendly according to the results of the questionnaire conducted.
5) The average response time needed to execute manual commands given on HSDPA connections is 2.51 seconds, while on LTE connections is 2.04 seconds.
6) Speed for the calculation and reading of all machine values that exist on systems with connectivity LTE around ± 2s.
7) The monitoring system that has been made successfully answers and overcomes problems in previous studies regarding the calculation of the value of efficiency engine, faster response time, user friendly interface, reliable data accuracy, and a PMS system mobile and reliable.
ACKNOWLEDGEMENTS
We would like to express our deepest gratitude to Polman Bandung who has provided support in the form of research facilities and funds as well as research colleagues who have contributed their thoughts and energy so that this research can be completed immediately.
REFERENCES
Abdelhameed, Magdy. (2014). VDI 2206. Cairo : Ain Shams University
Baudoux Nicolas and Bauwin Lucie. (2017-2018) Real-Time database : Firebase INFO-H-415 : Advanced database. Université Libre de Bruxelles. Academic year.
Bhushan.Golechha, Prashant S. Kulkarni. (2017) Design, Analysis And Optimization Of 10 Ton Pneumatic Press Machines : A Review. IJARIIE-ISSN (O) -2395-4396. Vol-3 Issue-1 pages 414-419
Cowling, P. Johansson, M. (2002) Using real time information for effective dynamic scheduling. European Journal of Operational Research., 139, 230-244. Retrieved from https://doi.org/10.1016/S0377-2217(01)00355-1
F. Mattern, C. Floerkemerier, (2010) From the Internet of Computers to the Internet of Things, Informatik-Spectrum, Vol. 33, No. 2, pp.107-121. Retrieved from https://doi.org/10.1007/s00287-010-0417-7
Guo-dong Zhu, Chang-sheng Ai Li-jun Qian. (2014) "On-line Monitoring and Control System of Steel Ball Production Based on WiFi Internet of Things". International Conference on Wireless Communication and Sensor Network. Page (s) : 127-131. Retrieved from https://ieeexplore.ieee.org/abstract/document/7061709
H. Kagermann, W. Wahlster, J. Helbig, (2012) Recommendations for implementing the strategic initiative Industrie 4.0 - Final report of the Industrie 4.0 Working Group. Berlin, Communication Promoters Group of the Industry-Science Research Alliance,
Lei Wu, Jie Hu. (2010) Design and Implementation of Production Environment Monitoring System Based on GPRS-Internet. Fourth International Conference on Genetic and Evolutionary Computing. Pages 818-821. Retrieved from https://doi.org/10.1109/ICGEC.2010.207
Meyer, H. Fuchs, F. Thiel, K. (2009) Manufacturing execution systems : optimal design, planning, and deployment. McGraw Hill, New York, Retrieved from https://www.accessengineeringlibrary.com/content/book/9780071623834
Meyer, H. Fuchs, F. Thiel, K. (2009) Manufacturing execution systems: optimal design, planning, and deployment. McGraw Hill, New York, Retrieved from https://www.accessengineeringlibrary.com/content/book/9780071623834
Prasetyo Hoedi, Sugiarto Y and Cucuk Nur Rosyidi. (2018) Design of An Automatic Production Monitoring System on Job Shop Manufacturing., doi: 10.1063 / 1.5024080 Retrieved from https://doi.org/10.1063/1.5024080
S. Sukaridhoto, (2016) Playing with the Internet of Things and Big Data, Surabaya : Surabaya State Electronics Polytechnic,
SK Subramaniam 1, SH Husin 2, Y. Yusop 3, AH Hamidon 4. (2014) Machine and man power utilization efficiency on production lines. Proceedings of the 8th WSEAS Int. Conf. On ELECTRONICS, HARDWARE, WIRELESS and OPTICAL COMMUNICATIONS. 29 May, Pages 70-75.
Saenz de Ugarte, B. Ariba, A. and Pellerin, R. (2009) Manufacturing execution system - a literature review. Production Planning & Control., 20, 6, 525-539. Retrieved from https://doi.org/10.1080/09537280902938613
Siva Kumar a / l Subramaniam, Siti Huzaimah bint Husin, Yusmarnita bint Yusop and Abdul Hamid bin Hamidon, (2007) "Real Time Production Performance Monitoring System a Production Aid for all Industries". The 6th WSEAS International Conference on Circuits, Systems, Electronics, Control & Signal Processing (CSECS 07) World Scientific and Engineering Academy and Society, 29-31 December, Page (s) : 181-184. Retrieved from https://citeseerx.ist.psu.edu/viewdoc/download?doi=10.1.1.559.550&rep=rep1&type=pdf
Snatkin, A. ; Karjust, K. ; Eiskop, T. (2012) Real Time Production Monitoring system in SME. 8th International DAAAM Baltic Conference "INDUSTRIAL ENGINEERING" 19 to 21 April, Tallinn, Estonia Retrieved from https://doi.org/10.3176/eng.2013.1.06
Tang, B, Zeng, N, & Zheng, X. etc. (2004) Web-based Embedded System Design and Implementation of remote monitoring and control [J]., 43 (5) : 632-635.
Wang, Y, Yin, Y, & Jiang, Y. etc. (2005) Chinese real-time dynamic monitoring of system development and implementation of the Strategy [J]., 29 (11) : 44-48.IS
|
|
 This work is licensed under a: Creative Commons Attribution 4.0 International License
© IJETMR 2014-2021. All Rights Reserved.