ShodhKosh: Journal of Visual and Performing ArtsISSN (Online): 2582-7472
|
|
Trust on Health Insurance Providers: Scale Validation and Determining Factors in Indian Context
P. Shobanapriya
1![]()
![]() , Dr. P. Easwaran 2
, Dr. P. Easwaran 2![]()
![]()
1 Research
Scholar, Karpagam Academy of Higher Education, Coimbatore, Tamil Nadu,
India
2 Associate
Professor, Department of Commerce, Karpagam Academy of Higher Education,
Coimbatore, Tamil Nadu, India
|
|
|
ABSTRACT |
|
|
The insurance
is the risk-transfer mechanism. Health insurance is high significant as it
enables policyholders to manage medical emergencies, funding and safety of
life through covers. The trust and transparency have become pivotal from
sustainability perspective. As a result, a method to assess trust in health
insurers is paramount both in management and as a research tool inorder to enhance the institutes’ efficiency and maximise benefits for the policy holders. This survey
aimed at validating the Scale to Measure Patients' Trust in Health
Insurers by Beiyao Zheng et al., 2002, in the
Indian context. The 11-item five-dimensional scale was validated among 180
policy holders in the city of Coimbatore, Tamil Nadu. The Likert format
allows five responses per item and holds a reliability score of Cronbach’s
alpha 0.92/0.89. The scale was slightly modified, and rigorous statistical
validation procedures were applied in the form Bartlett’s test of sphericity,
Kaiser-Meyer-Olkin, Confirmatory Factor Analysis and Fitness indices
estimates. The finalised scale holds 9-items across
three-dimensions with a Cronbach’s alpha of 0.964 and allows the users to
measure trust on health insurance providers in Indian context. The
demographic variables that influence the trust are also detailed. |
|||
|
Received 21 January 2026 Accepted 25 March
2026 Published 20 April 2026 Corresponding Author P. Shobanapriya, shobanapriyav@gmail.com DOI 10.29121/shodhkosh.v7.i5s.2026.7699 Funding: This research
received no specific grant from any funding agency in the public, commercial,
or not-for-profit sectors. Copyright: © 2026 The
Author(s). This work is licensed under a Creative Commons
Attribution 4.0 International License. With the
license CC-BY, authors retain the copyright, allowing anyone to download,
reuse, re-print, modify, distribute, and/or copy their contribution. The work
must be properly attributed to its author.
|
|||
|
Keywords: Trust, Health Insurance, Scale validation,
Determining Factors, India |
|||


1. INTRODUCTION
The Indian government's efforts to reform the health system and combat poverty have recently been cited as a significant component Planning Commission and United Nations (2011), La Forgia and Nagpal (2012). The expansion of the "Universal Health Care for All by 2020" campaign Reddy et al. (2014) to 2030 represents a significant step in the Indian Health Care Reform Devadasan et al. (2014). Universal health insurance is a necessity in order to accomplish this objective Bennett et al. (2010), Reddy et al. (2011) and it has been suggested as a potential way to reduce health inequalities and out-of-pocket( OOP(out of pocket) expenses. In a country with such a diverse population as India, there are several interlinked government, commercial, and community health insurance systems. The 2017 update to the (NHP) report continues the importance of having fully accessible and free access to the right Sharma (2015).
What factors have influenced Indian policymakers 'decisions regarding health insurance? The effects of 1) the burden of illness, (2) low government health spending, (3) private health spending, particularly OOP (Out-Of-Pocket) spending, and (4) existing gaps in all types of insurance coverage Ahlin et al. (2016). The country is in the transition period in terms of healthcare because the population's level of illness from dietary deficiencies and infections is unprecedented, just like the elites 'pretentious revolution, which includes a lack of physical activity, a high intake of carbohydrates and fat, and an abundance of tobacco Horton (2005). On the other hand, poor and marginalized populations are attracted to the least amount of health care Maria (2021), Subramanian et al., (2021). Whose aspirations in the era of scientific advancement are nothing more than hopeful favours according to a little more than a false healthcare system?
2. SIGNIFICANCE OF STUDY
Healthcare spending is rising, especially in terms of OOP payments made by the sick Dror et al. (2008), Kao et al. (1998), Shahrawat and Rao (2012), because there is still a deficiency in the funds allocated for these services. Additionally, it has resulted in a decline in the standard of care at public hospitals Rao and Choudhury (2012). In response to this, even the least educated and poor sections of society choose to use public transportation Bhatia and Cleland (2001), Madhukumar et al. (2012). Private facilities have grown to 80% of outpatient and 60% of inpatient services Sharma (2015). When is the most urgent time to purchase health insurance?
For people in the low to middle income bracket, health insurance, such as indemnity or managed care, can serve as a safety net to reduce the risk of financial ruin as a result of unanticipated health care costs (Karajan, 2012, Reshmi et al. (2007). However, just a small percentage of the population is covered by this type of health insurance.
3. RATIONALE OF STUDY
Trust appears to be a major factor in the use, requirements, and enrolment of health insurance. It can be simply defined as the recognition of a vulnerable state in the belief that the trustee would safeguard the trustor's best interests Akafu et al. (2023). Goold, Hardin, and others have it between organizations and between people. It places trust in institutions 'standards, fundamental values, and procedures rather than people. The underlying tenets Pirson (2009) are the absence of any information about upcoming health conditions and the possibility that the risk may be anticipated will be passed on to others in advance. In exchange for the insurer agreeing to pay the insurer's waiting losses, a premium will be paid to transfer this risk. The enrolment criteria are determined by initial trust, which serves as the foundation for enrollment in an insurance plan (Eseta, Sinkie, Ozawa and Walker (2009), and Eseta). A large portion of people may never trust health insurance as an asset, as suggested by Ahlin and others. Trust yet travels when the insurer shares medical information with the patient, when treatment is accessed while being hospitalized, and when dependence is demonstrated during the reimbursement waiting period. We recognize the value of fostering trust in both the protection of the insured's services and the insurance company's survival Pirson (2009). It makes the enrolment process as well as the policy-holder process simpler. Despite being pertinent in all circumstances, LMICs have received surprisingly little attention regarding the impact of trust in the provision of healthcare Gilson (2006). There aren't many, if any, of the available ways to assess the level of trust between policyholders of health insurance in the British setting. Some measures fall short, in the opinion of development issues and lack of prior theory. In the few studies that examined institutional trust in medicine Blendon et al. (1998), only single-dimensional measures of trust were used. The factors that might affect trust are also undermined in the united context.
4. OBJECTIVES OF STUDY
1) To validate Patients’ Trust in Health Insurers scale in the Indian context
2) To compare the factors that influence the trust on the health insurer
5. REVIEW OF LITERATURE
The rising demand for health insurance in India is a result of bad lifestyle choices, air pollution, inhaling poisonous gases, and financial difficulties due to paying for medical treatment and hospitalization, according to Sethi and Bhatia (2023). Additionally, most workplaces today offer their employees access to health insurance, which raises the requirement for the latter. As a result of recent research, it has become apparent that trust can be used to determine a health insurance provider's performance Asmamawu, Besley, Dror, and Schneider, Schneider, 2014). According to a study conducted in West Africa, providers 'poor treatment quality had a negative effect on participation in the community insurance plan as a result of a loss of trust Criel and Waelkens (2003). Additionally, household surveys from various nations frequently reveal that insured members are concerned about whether the companies 'premiums will be used wisely Besley (1995).
Trust as a variable has been thoroughly investigated, whether it is enrolling or staying in the same job for a while for some years as an insured individual. Students who studied distrust was a barrier and trust in the provider was a facilitator De Allegri et al. (2006), Ozawa& Walker, Schneider) were also able to identify this. Further, studies have highlighted the importance of distrust: low community involvement Basaza et al. (2008), complaints from customers that the plan failed to fulfil its promises Criel and Waelkens (2003), and low community involvement as a barrier to the scheme's viability Kyomugisha et al. (2009). Participants in both the study claimed they enrolled because other nearby residents had joined or renewed, creating a trust for the insurance plan.
Nair compared the ratings of both personal and public insurance claimants. In the public sector, than in the counterparts, satisfaction with resolving disputes was more favorable. In India, Kumar examined the role of insurance in the provision of funding for health care and cited it as a necessary means of coordinating resources, ensuring risk protection, and providing insurance services. Dror and others examined the willingness of poor and economic citizens in India to enrol in a health insurance program. It revealed that those who were covered were more willing to pay off their insurance than those who were not. Yadav and Sudhakar (2017) conducted an investigation into private factors that influence Indian consumers 'purchasing decisions for health insurance policies. Knowledge, tax benefits, macroeconomic stability, risk coverage, and other factors were major factors in a policyholder's choice to purchase health insurance, according to Yadav and Sudhakar (2017). Only a small number of variables had a positive and negative correlation when a study examined the relationship between the household head's age and the purchase of health insurance Chankova et al. (2008), De Allegri et al. (2006), Gnawali et al. (2009), Gumber (2001), Mathiyazaghan (1998), Panda et al. (2014). According to Subramanian et al. (2013), the ability to purchase health insurance is positively influenced by income, indicating that higher income levels improve access to health insurance. Individual and family characteristics are the main factors in purchasing health insurance, according to another study on industrialized nations Karan et al. (2014)
6. RESEARCH METHODOLOGY
6.1. Study Area, Period and Population
In the Coimbatore, Tamil Nadu district, the survey was conducted in June 2023. The district's northern region serves as the state's hub for various textile industries. There are 69 towns and six sub districts in the area. The location was chosen in accordance with convenience. The study's population, according to the 2011 Census, was 1,050 and 721 people.
6.2. Study Design, Sampling Technique and Sample Size
The methodology was founded on a cross-sectional, community-based study design that used health insurance policyholders. The list of members who had insurance through a public or private company was made people. Because there isn't enough evidence to show how many insurance holders are in the chosen area, the population size was left unknown. Three of the six were arbitrarily selected using a lottery technique based on a multistage sampling technique. Following this, two towns were selected to serve as clusters, serving as representatives of each sub district. Eventually, the members were chosen from the six towns using a computer-generated, straightforward strange sampling technique. Respondents were contacted over the phone and given requested for their consent to participate. Each sub district had 60 members, and if a member was unavailable after two phone calls, the next member would be added. The sample size was 180 overall.
6.3. Instrument and Data Collection Procedure
A questionnaire was created to evaluate the validity of the Patients 'Trust in Health Insurers scale, which was created and validated by Beiyao Zheng, Mark A. In relation to India, Hall, Elizabeth Dugan, Kristin E. Kidd, and Douglas Levine, 2002. Section A contained the demographic variables as well as the gender, age, and academic qualification, while section B contained the original scale intended to be validated here because it is believed to be one of the most effective medical research tools to meet the survey study's objectives. The researcher has adopted the standard scale found in the study paper, Beyigo et al., "Developing a Scale to Measure Patients 'Trust in Health Insurers." 11 items spread across 5 dimensions make up as. With reverse scoring for items with poorly worded answers, the response categories are strongly agreed (SA- 5), agree (A-4), neutral (N-3), Disagree ( DA-2), and strongly disagree( SDA-1).
A conceptual framework was used to create the scale based on broad philosophical and empirical literature reviews. Fidelity, competence, honesty, and confidentiality are the four intersecting criteria for health insurance institutes. Prior to this, there were 19 items in total, which included Global Trust, which was included as the five dimension. The authors approved 11 items across the five dimensions with Cronbach's alpha of 0/ 0/ 0. 9 following the validation process. The investigators used the data as a major source and were well-versed in the technique and spoken local language fluently. The ultimate sample size was 180 and each data collection took 20 minutes on average.
6.4. Ethical considerations
All research participants were informed about the investigation's objectives in advance of the interview, and they obtained informed dental consent. No personal information was used in the data collection questionnaire; instead, a unique code for each individual was used to signify the study and preserve participants 'confidentiality. Data was kept in both hard copies and gentle copies in safe locations. The collected data was accessible only to the research team, and all data sharing procedures were carried out in compliance with established social and legal standards.
7. DATA ANALYSIS
Table 1
|
Table 1 Demographics: Gender |
||
|
Options |
Frequency |
Percentage |
|
Male |
90 |
60 |
|
Female |
60 |
40 |
|
Total |
150 |
100 |
Figure 1

Figure 1Gender Distribution
Gender plays a significant role in a respondent's statistical profile. Some governments, economies, corporations, and other organizations place a high value on gender equality in policy making. A sample of 150 people is included in the statistical data on gender. The majority of respondents are male, with 60% (90 people), and 40% (60 people) are female. This indicates that male participants are more likely to have a fairly skewed gender distribution. The presence of females, however, also has a major impact, which suggests a pretty equal distribution of the two. Nevertheless, the gender profile exhibits good inclusivity, with male participation exhibiting a significantly higher level.
Table 2
|
Table 2 Demographics: Age |
||
|
Options |
Frequency |
Percentage |
|
Below
25 Years |
50 |
33.33 |
|
25
to 40 Years |
70 |
46.67 |
|
Above
40 Years |
30 |
20.00 |
|
Total |
150 |
100 |
Figure 2
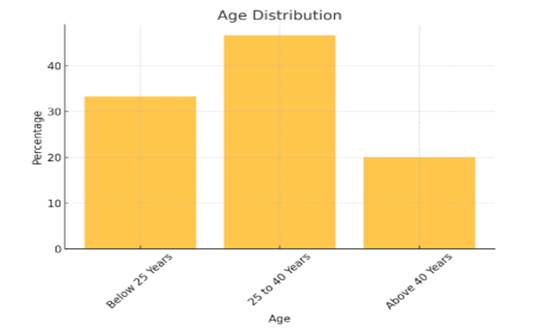
Figure 2
Age Distribution
The respondents 'age distribution, which totals 150 people, is indicated in the statistical data table. Respondents between 25 and 40 years make up the sample's 46.67% ( 70 respondents), making up the largest sample. This suggests that the majority of people are middle-career or younger adults. Respondents under 25 years old make up 33.33% of the second-largest sample, which represents younger, probably first-career participants. Respondents over the age of 40 make up 20% of the sample, which indicates a relatively smaller proportion of older adults. Nevertheless, the demographics of participants aged between middle and old seem to be biased according to the data.
Table 3
|
Table 3 Demographics: Education |
||
|
Options |
Frequency |
Percentage |
|
SSC |
20 |
13.33 |
|
HSC |
30 |
20.00 |
|
Graduate |
60 |
40.00 |
|
Post-Graduate |
40 |
26.66 |
|
Total |
150 |
100 |
Figure 3
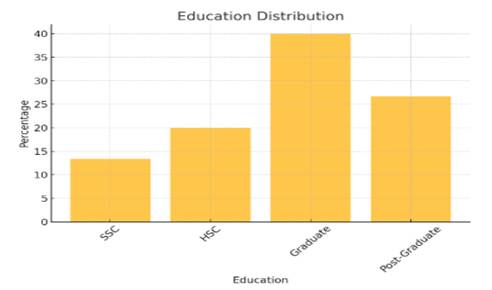
Figure 3
Demographics-
Education
The education credentials of 150 respondents are revealed in the demographic data on education. 40% of the sample, or 40% of the respondents, are graduates, which indicates that a sizable portion of the sample has completed their academic studies. The second-largest group of respondents, with 40 respondents, representing a significant proportion of people with graduate degrees, suggests a high level of education. Respondents with Secondary School Certification( SSLC) account for 20% of respondents, compared to only 13.33% of those with Higher Secondary Certification( HSC)( 30 respondents). Nevertheless, the sample size suggests a predominately grad and postgraduate-educated sample.
Table 4
|
Table 4 Work Experience |
||
|
Options |
Frequency |
Percentage |
|
Below
5 Years |
40 |
26.67 |
|
5
to 10 Years |
50 |
33.33 |
|
11
to 15 Years |
30 |
20.00 |
|
16
to 20 Years |
20 |
13.33 |
|
Above
20 Years |
10 |
6.67 |
|
Total |
150 |
100 |
Figure 4
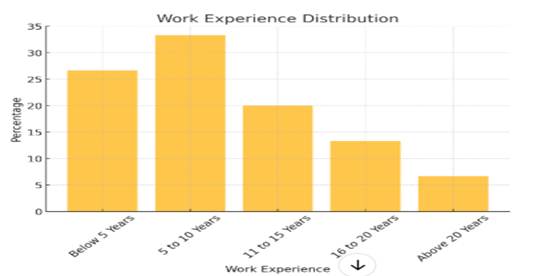
Figure 4 Work Experience
The demographics of the 150 respondents 'work experience indicate how long they have been employed. The majority of respondents (50) are mid-level professionals with between five and ten years of experience. With 40 respondents, the second-largest sample is comprised of people with less than five years of experience, which suggests some notable participation from relatively fresh professionals. Respondents aged 16 to 20 years, or 13.33%, make up 20% of respondents, followed by those aged 16 to 20. The smallest category, which is made up of only 6.7% of respondents over 20 years old, has a chance of getting to know them, which is surprising because only those with the most experience gathering have a chance. The survey results, in general, suggest that the majority of respondents are quick-to-mid-career professionals.
According to statistical standards, the data was incorporated into AMOS v27 and SPSS v23 (Black, et al., 2001). 2010). In terms of respondents 'ages, 91 (51% males and 89 (49% females) were older than 40, 108 (60%) were graduates, and 72 (40%) were non-renews in terms of their educational status. In light of this, the sample sizes were used to evaluate the suitability of the previous requirement for CFA. After that, CFA and reliability were discovered. To compare the demographic data they used to assess the effect of their trust in health insurance providers, independent samples were used.
8. RESULTS AND DISCUSSION
Based on descriptive statistics, the test of normality, CFA, and the test's reliability score, the test results are elaborated. The samples 'descriptive statistics, which describe and summarise the data's general characteristics as well as distribution, were examined. Respondents had a median of 43 on the scale of 42.02, a standard deviation of 7.859, and a skewness of -.185 and a 0. 181 regular error for skewness and kurtosis of- were present. The common error of kurtosis is .360 and is 924. So, the obtained skewness and kurtosis values are lower than 1.96 (95% confidence interval) and 2.58 (99% confidence interval).
As a result of the comparison between the sample data input into the system and the probability distribution of a hypothetical data and the assumption of normality, the Kolmogorov-Smirnov Goodness of Fit test was conducted Aslam (2020). The distribution is regular, as evidenced by the p value of 0.05. In order to test whether the study's normality assumptions were true Aslam (2020), a Shapiro-Wilk test was also conducted. The result is that the p= 0.00001, or 0.05, is normal.
Objective 1: The requirement for using KMO Test and BTS as a prerequisite for CFA was carried out as a subsequent test. The KMO value is 0. 964-6, which is regarded as being extremely adequate, and is therefore higher than 0. 0 and also much closer. The significance of BTS for homogeneity of variance (22= 272.550, p 0.00001), which serves as a precondition for CFA analysis Hair et al. (2010), Tabachnick and Fidell (2007), is established Hair et al. (2010).
Table 5
|
Table 5 KMO and Bartlett’s test |
||
|
KMO Value |
0.964 |
|
|
BTS |
Approx. Chi-Square Df Sig. |
2702.55 55 0.000 |
A factor structure of the set of studied variables is verified using CFA statistical analysis. It will be simpler for the investigators to test the hypothesis if there is a connection between the discovered variables and the underlying hidden constructs, according to Suhr (2006), which suggests. It enables factor, variance, and relationship analysis of latent constructs Hill and Hughes (2007). When constructs are measured using multiple items, when the scale items have a linear relationship to the scale total or its average, and when the investigator is aware which item measures which domain Hunter (1982), CFA is a useful statistical tool for determining the validity of evidence.
Kline (2023), both stated that the goal of CFA is to verify the factor structure of a group of well-established variables, which is the five-factor organized Likert type scale in this case. CFA is satisfactory because it was created using priority theory and a framework and does not require an EFA. CFA is also the apt analysis to be done in this relatively new scale developed in 2002 to assess its validity and reliability in the Indian context because the fitness indices estimates of the model are taken into account here Hurley et al. (1997).
Because the classic scale has a second item under two dimensions, including Fidelity and Confidentiality, the dimensions were removed before being analyzed for CFA because the uni-item dimensions are incompatible with the CFA process. Figure 1 summarizes the model's fitness estimates based on the responses of 180 respondents to the remaining 9 three-dimensional aspects. The loading factors for the nine items exceeded the industry standard of 0. 5. According to Dai and Ng, 2008, the model is adequate because it provides good overall estimates and their values in accordance with the desired benchmarks.
Figure 5
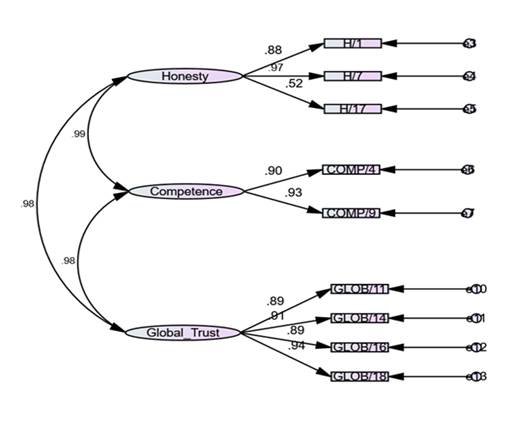
Figure 5
The Fitness Estimates
of the Model
Table 6 displays the model's indices. CMIN/DF=2.124, i .e., 3 benchmark values and a CFI of. GFI =.96, i .e., >0,95 benchmark value. 944, i .e., >0, benchmark value, and AGFI=. 894, i .e., 0-1 benchmark value, and RMSEA=. P value .000(0.05.0), and 0(0,1 benchmark value). The ultimate CFA model created includes three domains and nine items, and we can see that the values are consistent with the appropriate benchmark values for each. Honesty: 1, 7, 17, Competence: 4, 9, and Global Trust: 11, 14, 16, and 18 Table 3 are the final nine items.
The finalized scale Table 6 contains nine items and three factors, and has a reliability score of 0.964 as Cronbach's alpha. It has a higher degree of reliability and validity, and it can be used to assess the trust of policyholders in Indian settings.
Table 6
|
Table 6 List of Items Retained in Validated Scale |
||
|
Item No. |
Factor |
Item |
|
1 |
Honesty |
You think the people at XXX
are completely honest |
|
2 |
Honesty |
If someone at XXX made a
serious mistake, you think they would try to hide it |
|
3 |
Honesty |
If you have a question, you
think XXX will give a straight answer |
|
4 |
Competence |
As far as you know, the
people at XXX are very good at what they do |
|
5 |
Competence |
You feel like you have to
double check everything XXX does |
|
6 |
Global trust |
You worry there are a lot of
loopholes in what XXX covers that you don't know about |
|
7 |
Global trust |
You believe XXX will pay for
everything it is supposed to, even really expensive treatments |
|
8 |
Global trust |
If you got really sick, you
are afraid XXX might try to stop covering you altogether |
|
9 |
Global trust |
All in all, you have
complete trust in XXX |
Objective 2: To compare the factors that influence the trust on the health insurer.
Ho1 Trust perceived by health insurance policy holder on the insurance
provider have difference towards Gender
Ho2 Trust perceived by health insurance
policy holder on the insurance provider have difference towards Age
Ho3 Trust perceived by health insurance policy holder on the
insurance provider have difference Educational
qualification
Table 7
|
Table 7 Summary Findings of Descriptive Statistics of Policy Holder’s Trust to Gender, Age and Educational Qualification |
|||||||||
|
Measures |
P
value |
CMIN/
DF |
RMR |
RMSEA |
GFI |
AGFI |
PCFI |
IFI |
CFI |
|
Result |
0.000 |
2.124 |
0.038 |
.079 |
0.944 |
0.894 |
0.503 |
0.923 |
0.986 |
|
Benchmark |
<0.05 |
<3 |
<0.08 |
<0.1 |
>0.90 |
0 -1 |
>0.8 |
>0.90 |
>0.95 |
Educational
qualification
|
Variables |
N |
Mean |
SD |
SED |
|
Gender |
||||
|
Male |
91 |
43.41 |
7.81 |
0.819 |
|
Female |
89 |
40.6 |
7.69 |
0.815 |
|
Age |
||||
|
Age
above 40 years |
84 |
44.23 |
6.73 |
0.734 |
|
Age
below 40 years |
96 |
40.08 |
8.28 |
0.846 |
|
Educational
qualification |
||||
|
Graduates |
108 |
43.58 |
7.58 |
0.730 |
|
Non-graduates |
72 |
39.67 |
7.72 |
0.910 |
With
respect to trust by the policy holder’s, the demographic variable gender has
N=91, Mean=43.41, SD=7.81 and SED=0.819 for Males and N= 89, Mean= 40.60, SD=
7.69 and SED= 0.815 for females. This goes on to show that male respondents had
more trust than their counterparts in this sample. With regards to age, above
40 years has N=84, Mean=44.23, SD=6.73 and SED= 0.734, and N= 96, Mean= 40.08,
SD= 8.28 and SED= 0.846 for below 40 years. Here, we notice respondents with
more than 40 years of age held more trust than the below 40 years respondents.
Similarly, with regards to educational qualification N=108, Mean= 43.58, SD=
7.58 and SED= 0.730 was for graduates and above, and N=72, Mean= 39.67, SD=7.72
and SED= 0.910 for non-graduates. The respondents who were graduates showcased
more trust than the non-graduates.
Table 8
|
Table 8 Gender, Age and Educational Status of Respondents |
|||||
|
Levene's Test for |
t-test for Equality of Averages |
||||
|
Equality of Variances |
|||||
|
F |
Sig. |
t |
df |
Sig. (2-tailed) |
|
|
Variance |
Gender |
||||
|
Equal variances assumed |
0.099 |
0.753 |
2.432 |
178 |
2.811 |
|
Age |
|||||
|
Equal variances not assumed |
7.127 |
0.008 |
3.698 |
177.05 |
0 |
|
Educational qualification |
|||||
|
Equal variances assumed |
0.337 |
0.562 |
3.369 |
178 |
0.001 |
Table 5 displays the results of Lopez's test, which indicate that the data is not statistically significant at the required level of confidence, i .e., that it was found to be gender specific. Related variance was so used as a t-test for interpretation by the investigator in this circumstance. Also, if t calc> t tab is selected, the void hypothesis cannot be rejected. The gender T-value is 2. 432, which is higher than the accepted 1. 96. So, Ho1 there is no obvious difference between the policyholder's perception of trust in terms of gender at the insurance company. This eliminates the gender gap between policyholders and a large portion of the trust in health insurance providers.
Similar to the Levene's test signature, policyholders 'age, etc. value is 0.008, or less than 0.008. Therefore, the data are thought to be significant. The age group's t-value is 3. 698, which is higher than the accepted 1. 96( t calc> t tab), making the variable as significant as the sig value falls below 0. 0.05. The zero hypothesis is therefore rejected because equal variance is always assumed below. Ho2 There is no discernible difference between the policyholders 'perceptions of the insurance company and the policyholders' ages. In other words, we know how crucial it is for policyholders to have faith in health insurance companies.
The Levene's test signature demonstrates the educational credentials of policyholders in relation to the credibility of health insurance providers. Because the value is 0. 562, and the value is greater than 0.000, the data is assumed to be non-significant and have a comparable variance. The graduate group's t-value, which is higher than the accepted value of 1.96, indicates that the variable is significant( 0.006) and that it is more prevalent than those in the above- and below-graduate groups. Due to the rejection of the zero hypothesis, a comparable level of variance is assumed. Based on the rejected educational credentials, there is no obvious difference between the level of trust a policyholder has in the insurance company. Due to this, a policy holder's level of education significantly influences the trust they place in insurance companies.
9. CONCLUSION
Trust is essential to any kind of communication between people and businesses because it has the power to influence significant outcomes. In terms of health policy, interactions between patients and policyholders and increased transparency in the insurance sector have grown tremendously. Health insurers work to build trust among the common public to avoid the strict regulations that come with losing confidence. In the end, a method to evaluate the effectiveness of health insurers can be used as both a management tool and a research study's tool to measure and improve efficiency. The researchers have validated the Scale to Measure Patients 'Trust in Health Insurers in an Indian setting, according to Beiyao Zheng and al., from 2002. When used in standard populations, the multi-factorial scale used in this study has sufficient clinical characteristics to be used with all types of health insurance. Because the samples were collected from both private and public insurance holders as well as managed care and indemnity, the validated scale can be used in non-homogenous areas without restrictions. Because the three socioeconomic factors have proven to be important, consideration should be given where necessary to increase the number of insurers and improve the company's performance.
CONFLICT OF INTERESTS
None.
ACKNOWLEDGMENTS
None.
REFERENCES
Ahlin, T., Nichter, M., and Pillai, G. (2016). Health Insurance in India: What Do We Know and Why Is Ethnographic Research Needed. Anthropology and Medicine, 23(1), 102–124. https://doi.org/10.1080/13648470.2015.1135787
Akafu, W., Daba, T., Tesfaye, E., Teshome, F., and Akafu, T. (2023). Determinants of Trust in Healthcare Facilities Among Community-Based Health Insurance Members in the Manna District of Ethiopia. BMC Public Health, 23(1), 171. https://doi.org/10.1186/s12889-023-15124-w
Aslam, M. (2020). Introducing Kolmogorov-Smirnov Tests Under Uncertainty: An Application to Radioactive Data. ACS Omega, 5(1), 914–917. https://doi.org/10.1021/acsomega.9b03940
Asmamawu, A. (2018). Community Based Health Insurance in Ethiopia: Enrollment, Membership Renewal, and Effects on Health Service Utilization. Creative Commons.
Basaza, R., Criel, B., and Van der Stuyft, P. (2008). Community Health Insurance in Uganda: Why Does Enrolment Remain Low? A View from Beneath. Health Policy, 87(2), 172–184. https://doi.org/10.1016/j.healthpol.2007.12.008
Bennett, S., Ozawa, S., and Rao, K. D. (2010). Which Path to Universal Health Coverage? Perspectives on the World Health Report 2010. PLoS Medicine, 7(11), e1001001. https://doi.org/10.1371/journal.pmed.1001001
Besley, T. (1995). Savings, Credit, and Insurance. In J. Behrman and T. N. Srinivasan (Eds.), Handbook of Development Economics (pp. 2123–2207). North-Holland. https://doi.org/10.1016/S1573-4471%2805%2980008-7
Bhatia, J. C., and Cleland, J. (2001). Health-Care Seeking and Expenditure by Young Indian Mothers in the Public and Private Sectors. Health Policy and Planning, 16(1), 55–61. https://doi.org/10.1093/heapol/16.1.55
Blendon, R. J., Brodie, M., Benson, J. M., Altman, D. E., Levitt, L., Hoff, T., and Hugick, L. (1998). Understanding the Managed Care Backlash. Health Affairs, 17(4), 80–94. https://doi.org/10.1377/hlthaff.17.4.80
Chankova, S., Sulzbach, S., and Diop, F. (2008). Impact of Mutual Health Organizations: Evidence from West Africa. Health Policy and Planning, 23(4), 264–276. https://doi.org/10.1093/heapol/czn011
Criel, B., and Waelkens, M. P. (2003). Declining Subscriptions to the Maliando Mutual Health Organisation in Guinea-Conakry (West Africa): What Is Going Wrong? Social Science and Medicine, 57(7), 1205–1219. https://doi.org/10.1016/S0277-9536%2802%2900495-1
De Allegri, M., Sanon, M., Bridges, J., and Sauerborn, R. (2006). Understanding Consumers' Preferences and Decision to Enrol in Community-Based Health Insurance in Rural West Africa. Health Policy, 76(1), 58–71. https://doi.org/10.1016/j.healthpol.2005.04.010
Devadasan, N., Ghosh, S., Nandraj, S., and Sundararaman, T. (2014). Monitoring and Evaluating Progress Towards Universal Health Coverage in India. PLoS Medicine, 11(9), e1001697. https://doi.org/10.1371/journal.pmed.1001697
Devadasan, N., Ranson, K., Van Damme, W., Acharya, A., and Criel, B. (2006). The Landscape of Community Health Insurance in India: An Overview Based on 10 Case Studies. Health Policy, 78(2–3), 224–234. https://doi.org/10.1016/j.healthpol.2005.10.005
Ding, Z., and Ng, F. (2008). A New Way of Developing Semantic Differential Scales With Personal Construct Theory. Construction Management and Economics, 26(11), 1213–1226. https://doi.org/10.1080/01446190802527522
Dror, D. M., Hossain, S. S., Majumdar, A., Pérez Koehlmoos, T. L., John, D., and Panda, P. K. (2016). What Factors Affect Voluntary Uptake of Community-Based Health Insurance Schemes in Low- and Middle-Income Countries? A Systematic Review and Meta-Analysis. PLoS One, 11(8), e0160479. https://doi.org/10.1371/journal.pone.0160479
Dror, D. M., van Putten-Rademaker, O., and Koren, R. (2008). Cost of Illness: Evidence From a Study in Five Resource-Poor Locations in India. Indian Journal of Medical Research, 127(4), 347–361.
Eseta, W. A., and Sinkie, S. O. (2022). Factors Affecting Households' Trust in the Community Based Health Insurance Scheme in Ethiopia. PLOS Global Public Health, 2(5), e0000375. https://doi.org/10.1371/journal.pgph.0000375
Gilson, L. (2006). Trust in Health Care: Theoretical Perspectives and Research Needs. Journal of Health Organization and Management, 20(5), 359–375. https://doi.org/10.1108/14777260610701768
Gnawali, D. P., Pokhrel, S., Sié, A., Sanon, M., De Allegri, M., Souares, A., Dong, H., and Sauerborn, R. (2009). The Effect of Community-Based Health Insurance on the Utilization of Modern Health Care Services: Evidence From Burkina Faso. Health Policy, 90(2–3), 214–222. https://doi.org/10.1016/j.healthpol.2008.09.015
Goold, S. D. (1998). Money and Trust: Relationships Between Patients, Physicians, and Health Plans. Journal of Health Politics, Policy and Law, 23(4), 687–695. https://doi.org/10.1215/03616878-23-4-687
Gumber, A. (2001). Hedging the Health of the Poor: The Case for Community Financing in India. https://doi.org/10.1596/13663
Hair, J. F. (2011). Multivariate Data Analysis: An Overview. In International Encyclopedia of Statistical Science (pp. 904–907). Springer Berlin Heidelberg. https://doi.org/10.1007/978-3-642-04898-2_395
Hill, C. R., and Hughes, J. N. (2007). An Examination of the Convergent and Discriminant Validity of the Strengths and Difficulties Questionnaire. School Psychology Quarterly, 22(3), 380. https://doi.org/10.1037/1045-3830.22.3.380
Horton, R. (2005). The Neglected Epidemic of Chronic Disease. The Lancet, 366(9496), 1514. https://doi.org/10.1016/S0140-6736%2805%2967454-5
Hunter, J. E. (1982). Unidimensional Measurement, Second-Order Factor Analysis, and Causal Models. Research in Organizational Behavior, 4, 267–299.
Hurley, A. E., Scandura, T. A., Schriesheim, C. A., Brannick, M. T., Seers, A., Vandenberg, R. J., and Williams, L. J. (1997). Exploratory and Confirmatory Factor Analysis: Guidelines, Issues, and Alternatives. Journal of Organizational Behavior, 18(6), 667–683. https://doi.org/10.1002/%28SICI%291099-1379%28199711%2918:6
Kao, A. C., Green, D. C., Zaslavsky, A. M., Koplan, J. P., and Cleary, P. D. (1998). The Relationship Between Method of Physician Payment and Patient Trust. JAMA, 280(19), 1708–1714. https://doi.org/10.1001/jama.280.19.1708
Karan, A., Selvaraj, S., and Mahal, A. (2014). Moving to Universal Coverage? Trends in the Burden of Out-of-Pocket Payments for Health Care Across Social Groups in India, 1999–2000 to 2011–12. PLoS One, 9(8), e105162. https://doi.org/10.1371/journal.pone.0105162
Kasirajan, G. (2012). Health Insurance an Empirical Study of Consumer Behavior in Tuticorin District. Indian Streams Research Journal, 2(3), 1–4.
Kirigia, J. M., Sambo, L. G., Nganda, B., Mwabu, G. M., Chatora, R., and Mwase, T. (2005). Determinants of Health Insurance Ownership Among South African Women. BMC Health Services Research, 5(1), 1–10. https://doi.org/10.1186/1472-6963-5-17
Kline, R. B. (2023). Principles and Practice of Structural Equation Modeling. Guilford
Publications.
Kyomugisha, E. L., Buregyeya, E., Ekirapa, E., Mugisha, J. F., and Bazeyo, W. (2009). Strategies for Sustainability and Equity of Prepayment Health Schemes in Uganda. African Health Sciences, 9(2).
La Forgia, G., and Nagpal, S. (2012). Government-Sponsored Health Insurance in India: Are You Covered? World Bank Publications. https://doi.org/10.1596/978-0-8213-9618-6
Lake, T. (1999). Do HMOs Make a Difference? Consumer Assessments of Health Care. Inquiry, 36(4), 411–418.
Madhukumar, S., Sudeepa, D., and Gaikwad, V. (2012). Awareness and Perception Regarding Health Insurance in Bangalore Rural Population. International Journal of Medicine and Public Health, 2(2). https://doi.org/10.5530/ijmedph.2.2.5
Maria. (2021). India's Health Inequality Severely Affects Dalits-International Dalit Solidarity Network.
Mathiyazaghan, K. (1998). Willingness to Pay for Rural Health Insurance Through Community Participation in India. The International Journal of Health Planning and Management, 13(1), 47–67. https://doi.org/10.1002/%28SICI%291099-1751%28199801/03%2913:1
Nair, S. (2019). A Comparative Study of the Satisfaction Level of Health Insurance Claimants of Public and Private Sector General Insurance Companies. The Journal of Insurance Institute of India, 6, 33–42.
Ozawa, S., and Walker, D. G. (2009). Trust in the Context of Community-Based Health Insurance Schemes in Cambodia: Villagers' Trust in Health Insurers. In Innovations in Health System Finance in Developing and Transitional Economies (pp. 107–132). Emerald Group Publishing Limited. https://doi.org/10.1108/S0731-2199%282009%290000021008
Panda, P., Chakraborty, A., Dror, D. M., and Bedi, A. S. (2014). Enrolment in Community-Based Health Insurance Schemes in Rural Bihar and Uttar Pradesh, India. Health Policy and Planning, 29(8), 960–974. https://doi.org/10.1093/heapol/czt077
Pirson, M. (2009). Facing the Trust Gap-Measuring and Managing Stakeholder Trust. In J. Friedland (Ed.), Doing Well and Good: The Human Face of the New Capitalism. Information Age Publishing. https://doi.org/10.1108/978-1-60752-176-120251005
Planning Commission and United Nations. (2011). India UNDAF - United Nations Development Action Framework, 2013-2017. Government of India.
Ranson, M. K. (2001). The Impact of SEWA's Medical Insurance Fund on Hospital Utilization and Expenditure: A Household Survey. World Bank. https://doi.org/10.1596/1-932126-07-4
Rao, M. G., and Choudhury, M. (2012). Health Care Financing Reforms in India. National Institute of Public Finance and Policy.
Reddy, K. S., Patel, V., Jha, P., Paul, V. K., Kumar, A. S., and Dandona, L. (2011). Towards Achievement of Universal Health Care in India by 2020: A Call to Action. The Lancet, 377(9767), 760–768. https://doi.org/10.1016/S0140-6736%2810%2961960-5
Reshmi, B., Nair, N. S., Sabu, K. M., and Unnikrishan, B. (2007). Awareness of Health Insurance in a South Indian Population: A Community Based Study. Health Popul Perspect Issues, 30(3), 177–188.
Schneider, P. (2005). Trust in Micro-Health Insurance: An Exploratory Study in Rwanda. Social Science and Medicine, 61(7), 1430–1438. https://doi.org/10.1016/j.socscimed.2004.11.074
Sethi, J., and Bhatia, N. (2023). Elements of Banking and Insurance. PHI Learning Pvt. Ltd.
Shahrawat, R., and Rao, K. D. (2012). Insured Yet Vulnerable: Out-of-Pocket Payments and India's Poor. Health Policy and Planning, 27(3), 213–221. https://doi.org/10.1093/heapol/czr029
Sharma, D. C. (2015). Concern Over Private Sector Tilt in India's New Health Policy. The Lancet, 385(9965), 317. https://doi.org/10.1016/S0140-6736%2815%2960103-9
Sinha, T., Patel, F., and Gandhi,
F. (2006). Understanding Member Dropout in VIMO SEWA. Indian Institute of
Management.
Srinivasan, J., and Ponmuthusaravanan, P. (2009). Determinants of Health Insurance in Pondicherry Region: An Econometric Analysis. International Research Journal of Social Sciences, 2(2), 215–227.
Subramanian, S. V., Corsi, D. J., Subramanyam, M. A., and Davey Smith, G. (2013). Jumping the Gun: The Problematic Discourse on Socioeconomic Status and Cardiovascular Health in India. International Journal of Epidemiology, 42(5), 1410–1426. https://doi.org/10.1093/ije/dyt017
Suhr, D. D. (2006). Exploratory or Confirmatory
Factor Analysis?
Tabachnick, B. G., and Fidell, L. S. (2007). Experimental Designs Using ANOVA (Vol. 724). Thomson/Brooks/Cole.
Turcotte-Tremblay, A.-M., Haddad, S., Yacoubou, I., and Fournier, P. (2012). Mapping of Initiatives to Increase Membership in Mutual Health Organizations in Benin. International Journal for Equity in Health, 11(1), 1–15. https://doi.org/10.1186/1475-9276-11-74
Uzochukwu, B. S. C., Onwujekwe, O. E., Eze, S., Ezuma, N., Obikeze, E., and Onoka, C. (2009). Community
Based Health Insurance Scheme in Anambra
State, Nigeria: An Analysis
of Policy Development, Implementation
and Equity Effects.
Consortium for Research on Equitable Health Systems, London School of Hygiene
and Tropical Medicine.
Yadav, C. S., and Sudhakar, A. (2017). Personal Factors Influencing Purchase Decision Making: A Study of Health Insurance Sector in India. Bimaquest, 17(1-A).
|
|
 This work is licensed under a: Creative Commons Attribution 4.0 International License
© ShodhKosh 2026. All Rights Reserved.